On this page
The Bullish Engulfing pattern and the Bearish Engulfing pattern are two patterns that a great many traders know, because they are a reversal signal that is easy to spot. We introduce both of these patterns in our series on Japanese candlesticks. If this pattern interests you, read on.
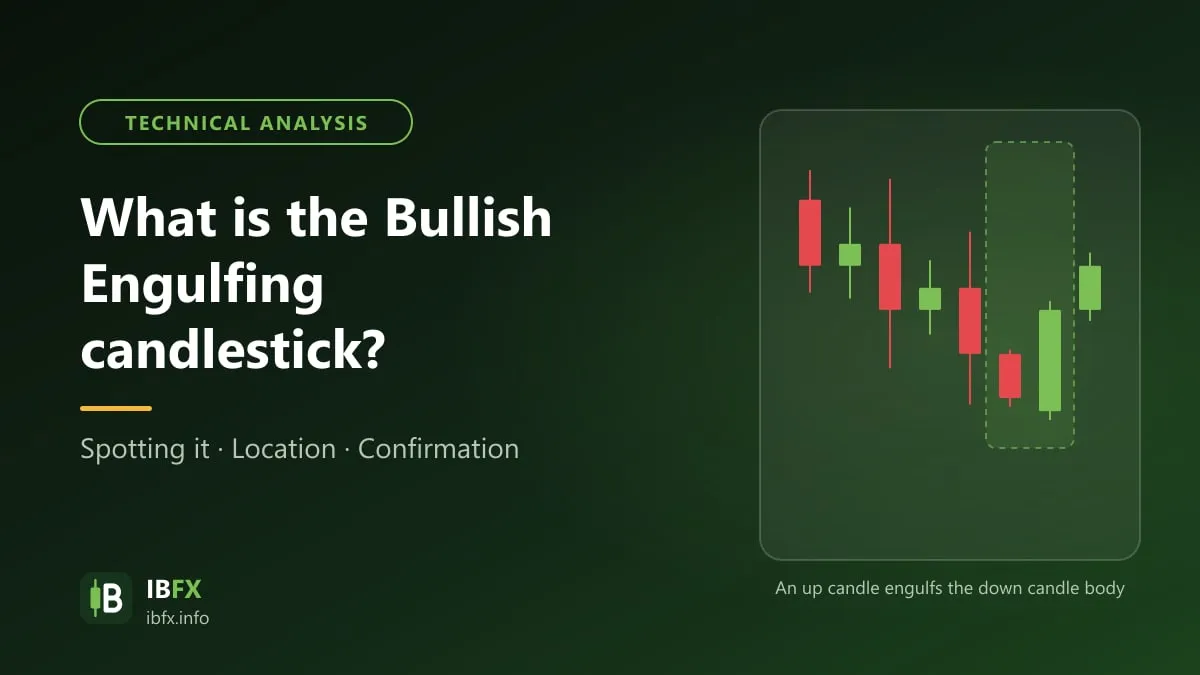
If it is called an engulfing pattern, then of course one candle has to cover the other. Here it is the Bullish Engulfing pattern, which means the rising candle covers and wraps up the falling candle. Like an old tree casting shade over the grass below!
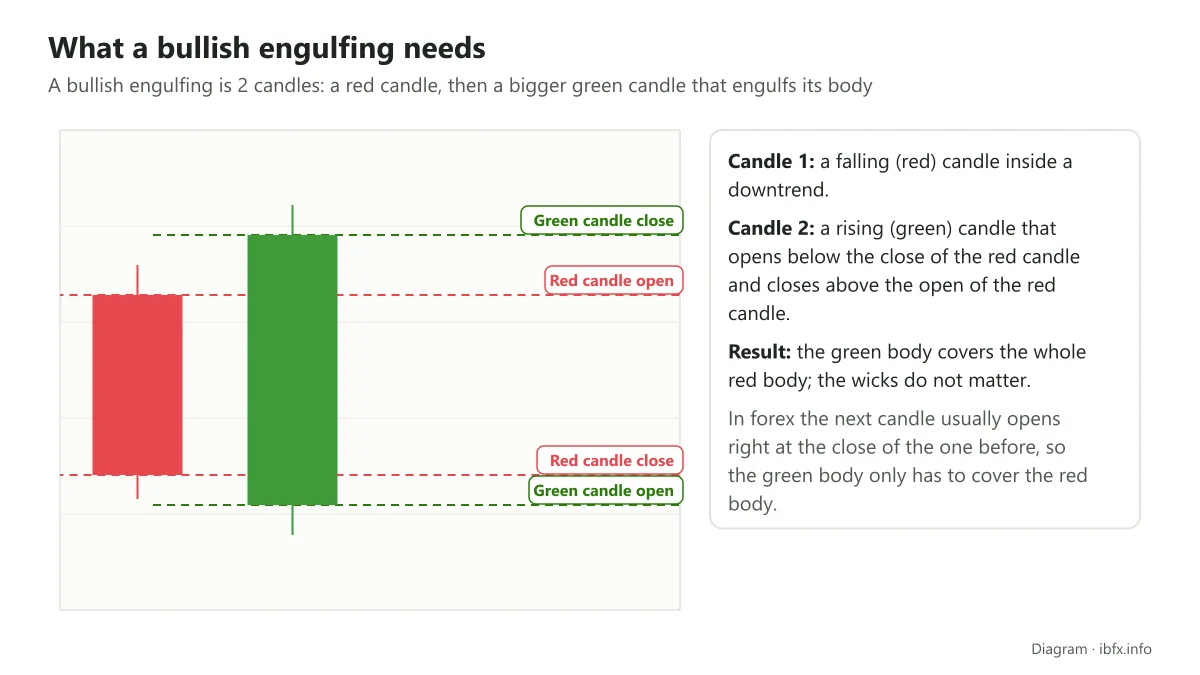
The Bullish Engulfing pattern is usually seen as more reliable when it appears after a clear downtrend, at a support zone, when buyers step into the market and push price higher.
When a large rising candle appears after a downtrend, buyers are blocking the fall. Once the green candle closes, sellers usually try to push price back down to test whether this really is the start of an uptrend. If sellers do not have the strength to push price any lower, more green candles end up forming. And that is also the moment that confirms an uptrend is about to begin.
How to recognize a Bullish Engulfing
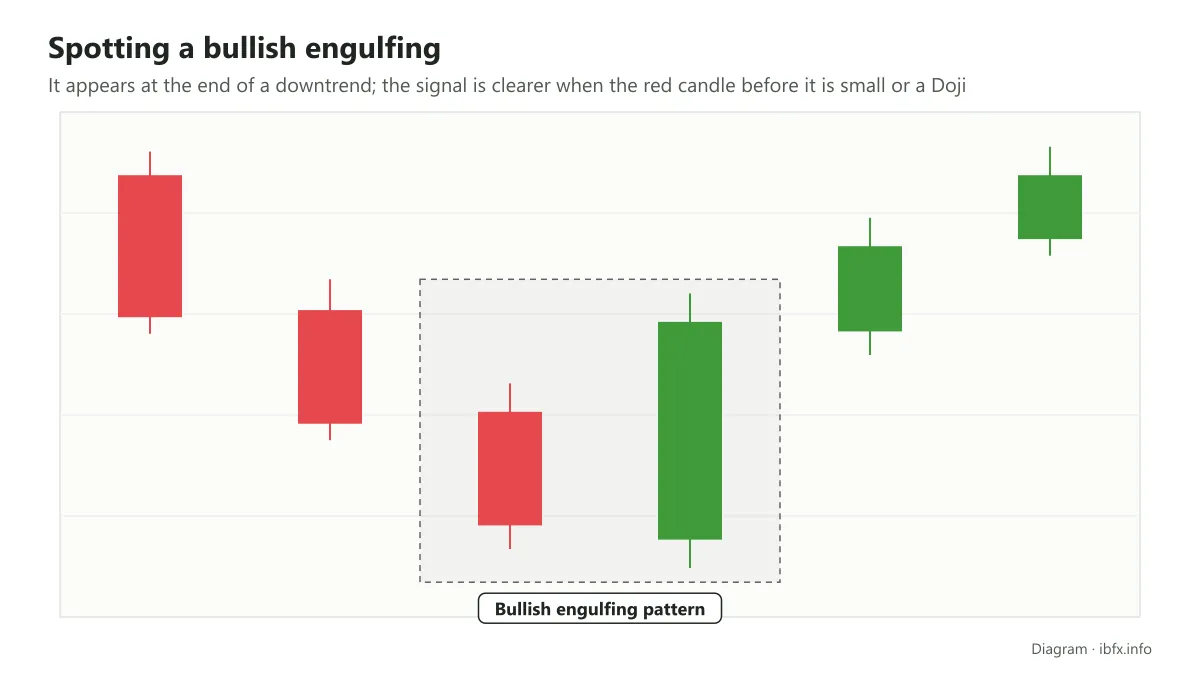
- It appears at the end of a downtrend
- The rising green candle has to be large enough to cover the whole body of the red candle before it (the wicks do not matter).
- The reversal signal is usually seen as clearer when the candle before it is very small or is a doji.
Finding an entry with the Bullish Engulfing pattern
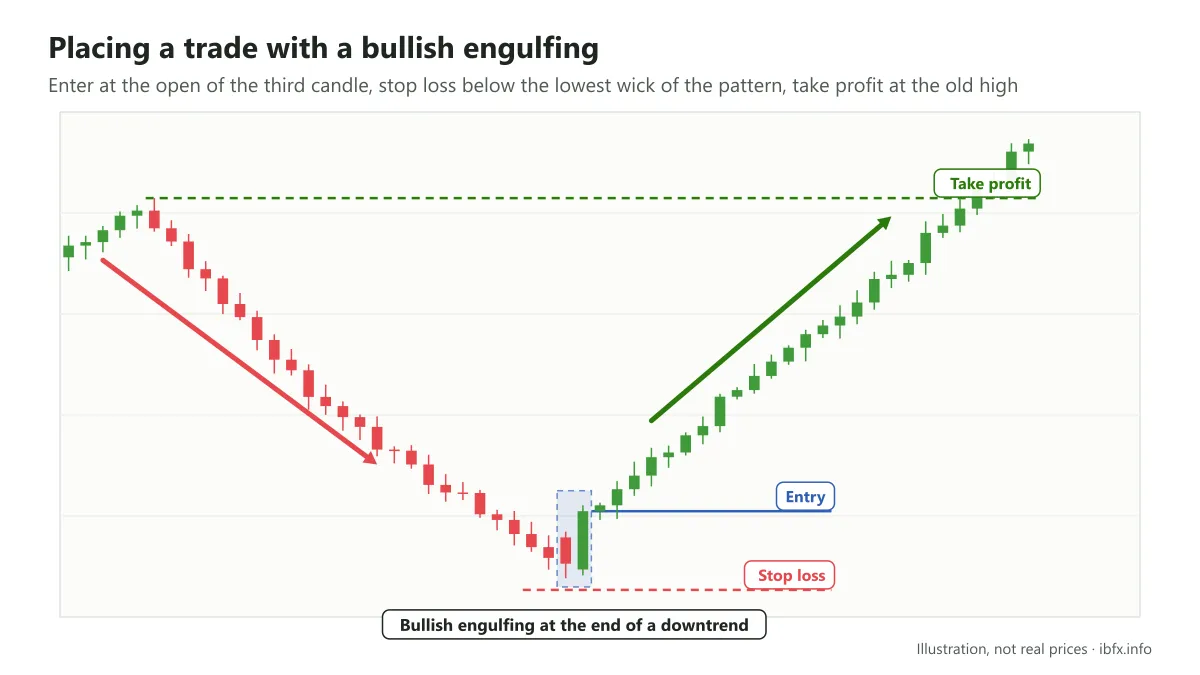
Looking at the picture above, you will see a downward move followed right after by the Bullish Engulfing pattern. In this example, if you spot the bullish engulfing pattern and place a BUY order, the trade turns a profit. The trade is set up like this:
Entry: right at the open of the third candle of the Bullish Engulfing pattern.
Stop loss: placed a small distance below the bottom of the lowest wick in the pattern (depending on the time frame), and you work out your position size from that distance.
This pattern usually means more when it appears after a sharp fall. The reason for that is actually fairly simple: market prices are driven by the psychology of the people taking part in the market. After a sharp downtrend, the traders on the selling side are close to exhausted, tired of keeping such a steady, strong fall going for any longer. Meanwhile buyers start stepping in and leave sellers at a disadvantage, so price can reverse and start to rise.
An example of the Bullish Engulfing pattern
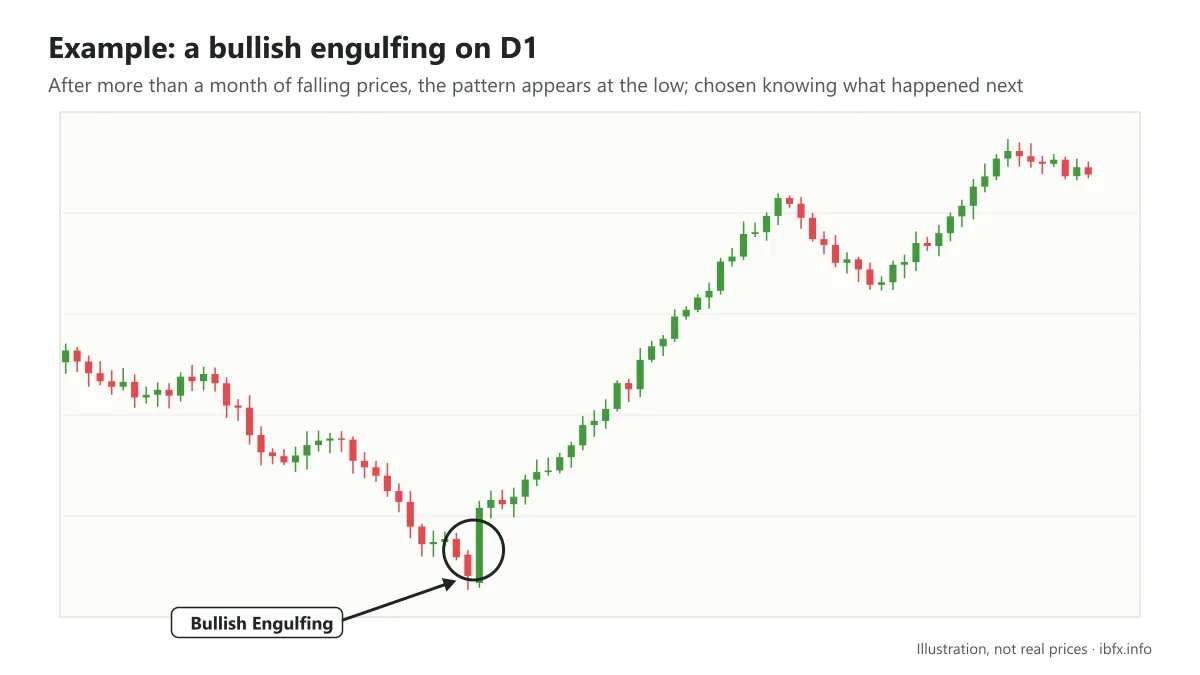
Above is an example of the Bullish Engulfing pattern on the D1 time frame. After more than a month of continuous falling prices, that fall ended when a Bullish Engulfing pattern formed. This is a situation where buying is worth considering, and price then rose sharply as the chart above shows (note that this is an example looked at in hindsight, once the outcome was known).
Note: once they see a Bullish Engulfing pattern, traders start looking at an entry. Many traders may place a BUY order the moment they see a Bullish Engulfing pattern. To be surer of it, though, you should add a few other indicators such as MACD or RSI to confirm the reversal. And whichever method you pick, you still have to put a stop loss just below the wick of the Bullish Engulfing pattern, so that if the pattern fails you still protect your capital.