On this page
Many swing traders favor the Price Action school of reading price behavior, in which candlestick patterns are a very widely used tool.
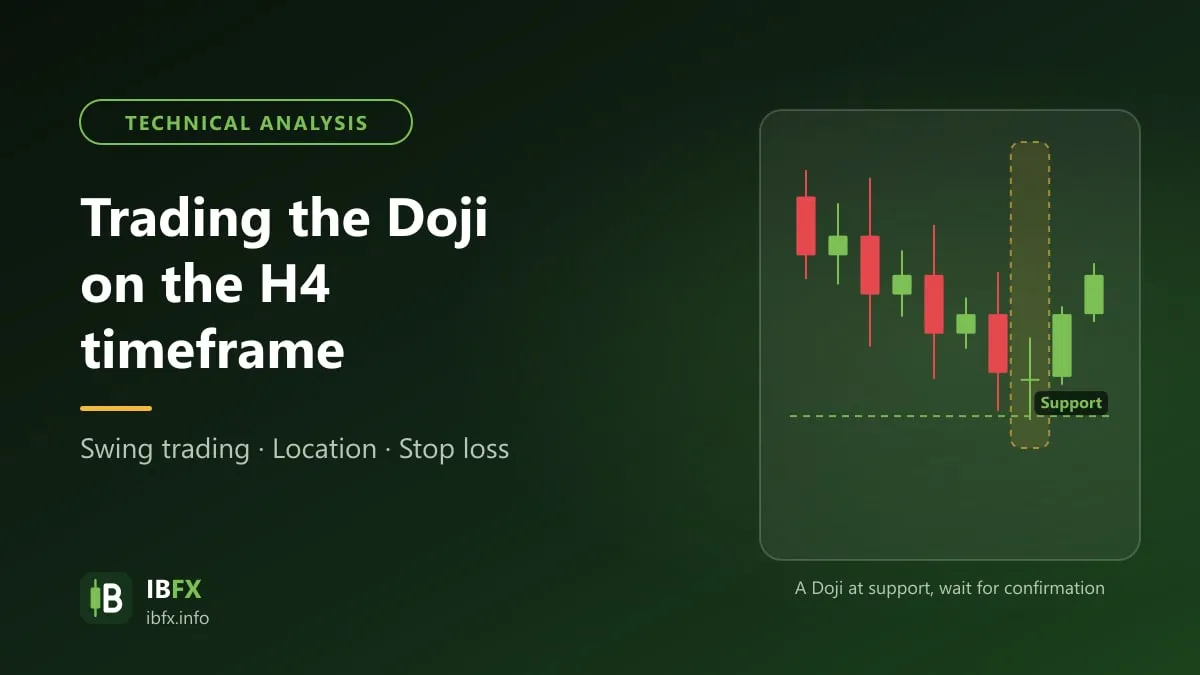
Trading the Doji candle pattern on the H4 timeframe is the strategy we are going to introduce to you in this article, and what makes it special is that this is a strategy for swing traders in particular.
Before we go into the strategy in detail, let us go back over the Doji candle a little, and over why H4 is the timeframe that many swing traders pick. Let us begin.
What is the Doji candle? The types of Doji and what they mean
What is a Doji candle?
The Doji is one of the candles that show up most often in the market. This candle has a close equal to the open, so the body of the candle looks like a horizontal line, and the wick can run long on one side, long on both sides, or the candle may have no upper and lower wick at all.
When the open and the close are different, the gap between them is small enough not to matter, and the color of the candle does not matter either at that point.
A Doji can show up in any market condition: when the market is in an uptrend, in a downtrend or moving sideways. But it only gives a strong signal in a few particular situations. Besides that, the body of a Doji being a straight line shows that by the end of the session neither side won out, since the close came out almost unchanged from the open. That is why, working from the Doji candle alone, a trader can hardly predict where price goes next. In the strategies for trading the Doji, a trader will usually combine it with indicators or with the price action happening around this candle.
The types of Doji and what they mean
The Doji has 5 variants in all, each with a shape of its own and each giving particular information about how the session that built the candle went, which helps a trader make some prediction about where price is headed, at least for a few sessions afterwards.
The standard Doji
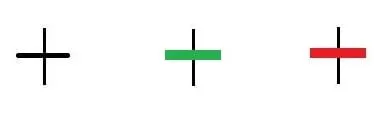
This Doji has short wicks on both sides, even with each other, which together with the body make the shape of a balanced plus sign. (Note: the name Doji Star is used for a Doji that has a price gap from the body of the candle before it; it is not because Doji means star.)
The buying and selling pressure in the session that builds a standard Doji is level, and neither side is very forceful in the fight. That is why, whatever kind of trend a standard Doji shows up in, the signal it gives is neither clear nor strong: price can still carry on with the trend, or reverse, or turn sideways.
Of course, with this standard Doji candle on its own it is hard to predict the next trend in price. But if you also watch how price behaves around this candle, a trader will have more useful information.
The long-legged Doji
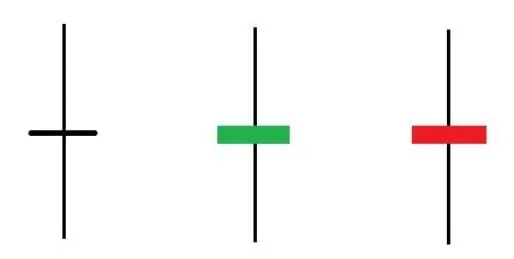
The upper and lower wicks of this Doji are even with each other too, but they are very long rather than short as on the standard Doji.
This Doji shows an extremely fierce tug of war between buyers and sellers right through the session. A very long upper wick shows there was a stretch when buyers had the upper hand and took price very high, but heavy selling pressure came in and pulled price back down. A very long lower wick shows sellers had a stretch of holding the upper hand in the market, but heavy buying pressure wiped out the sell side’s plan completely. In the end this fierce tug of war left neither side with a win.
This long-legged Doji does, though, give one fairly important clue: price may move strongly afterwards, so when a long-legged Doji shows up a trader will watch closely how price behaves right after the pattern completes, in order to predict which way the large move will go.
The dragonfly Doji
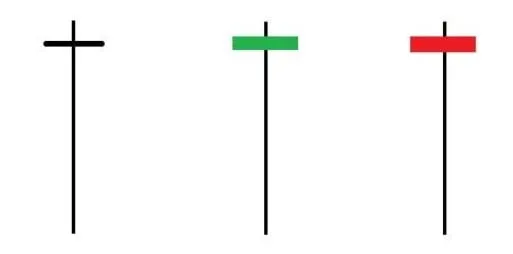
This Doji has a very long lower wick and a very short upper wick or none at all, which together with the body makes a shape like a dragonfly with its wings out.
Like the other Doji candles, the dragonfly Doji reflects a fight in which neither side wins, but this candle clearly says that buyers seem to have the upper hand, since they did not let the market take price any lower.
Normally price action traders will only take an interest in this Doji candle if it shows up in a downtrend or in a pullback within an uptrend, because at that point the dragonfly Doji says that selling pressure is weakening, that sellers cannot drag price any lower, and that heavy buying pressure has come in that may turn the trend around.
The other way round, if a dragonfly Doji shows up in an uptrend, then every possible move in price has much the same chance. Price may carry on rising because buying pressure is still strong even though selling pressure has appeared; the market may also reverse downward because buying pressure is weakening since it cannot take price any higher; but price may just as well move sideways straight afterwards.
The gravestone Doji
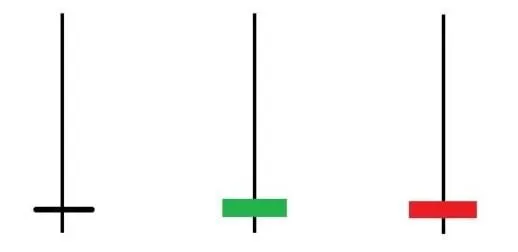
This is the Doji that turns the dragonfly upside down, with a very long upper wick and a very short lower wick or no wick at all.
At the start of the session buyers took price very high, but heavy selling pressure came in, pulled price down and held it level with the open until the end of the session. That is why, if this candle shows up in an uptrend or in a rally within a downtrend, the signal of a reversal in price is stronger. If it shows up in a downtrend, then every possible move in price has the same chance, the same as with the dragonfly Doji.
The four-price Doji

This is the Doji with no upper and no lower wick, made up of nothing but the body, a straight line where the close equals the open.
Right through the session that builds this candle, neither buyers nor sellers stir; neither side joins the market, so there is no movement in price at all. Every prediction about how price may move after this pattern appears is impossible. That is why, when they come across this Doji, traders usually pass it by.
How to trade the Doji candle
As said above, we pass by the Doji with no wicks and take no interest in it. The other 4 Doji candles fall into 2 groups:
- The standard Doji and the long-legged Doji: both of these Doji only say that buyers and sellers fought fiercely and that neither side won, and the long-legged Doji says in addition that a strong move in price may happen afterwards, but neither of them can give any further clue about which way price will move once the pattern completes. That is why, with these 2 Doji candles, the way to trade them is to watch how price behaves before and after the Doji forms, while also taking in the important price zones (support and resistance).
- The dragonfly Doji and the gravestone Doji: these 2 Doji do give a clue about which way price will move once the pattern completes, but under one particular condition, namely the trend of the market before the pattern appeared. In detail, the reversal trading strategy applies if a dragonfly Doji shows up in a downtrend or in a pullback within an uptrend, and if a gravestone Doji shows up in an uptrend or in a rally within a downtrend.
What is H4?
H4 in forex trading, or in stock or cryptocurrency investing, is the code for the 4 hour trading timeframe.
Each candle on the H4 timeframe describes how price moved over 4 hours, and the forex market runs 24 hours a day, so there are 6 H4 candles in a day. In the stock market, meanwhile, there are usually only about 2 H4 candles a day, because the trading hours are short.
The H4 timeframe is not small but not too large either, which makes it an ideal timeframe for medium-term trades held for a few days to a few weeks.
Why does the H4 timeframe matter to swing traders?
First, trading on H4 you no longer have to be a slave to the market, no longer have to keep your eyes glued to the screen, rushing whatever you do so as to get back to the price chart quickly; you will be freer.
Second, because each candle has 4 hours to complete, short-term noise affects the signals on H4 less than on the smaller timeframes. That said, strong news can still produce very large H4 candles, so you still need to follow the economic calendar.
Third, the range of movement on H4 is larger, so each trade can run further; in exchange the stop loss is further away too, so you have to cut your position size to match, and when a trade is held for several days you need to allow for the overnight cost (swap).
Fourth, it does not call for timing the entry point as precisely as scalping or day trading does.
And last, it is easy to combine with larger timeframes such as D1 to filter the trend.
The strategy for trading the Doji candle on H4
The Doji shows up on nearly every timeframe. From the experience of many traders, on H4 the Doji carries less noise than on the smaller timeframes while still showing up often enough, especially when it comes with a few particular setups given below.
This strategy is used when the Doji candle is held between 2 candles with relatively large bodies, and it can show up in an uptrend or a downtrend depending on the 2 large candles beside the Doji.
The setup of the strategy
If the market is in an uptrend or in a rally within a downtrend, what we need is:
- A relatively large bearish candle appears
- Followed by a Doji
- The third candle of this pattern is a bearish candle too, with a body equal to or close to the body of the first candle.
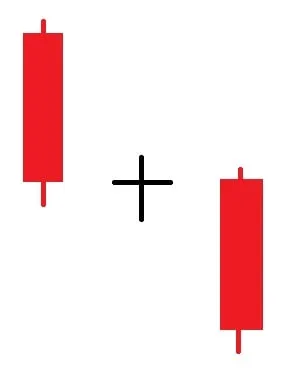
We can call this setup the bearish Doji pattern.
The other way round, if the market is in a downtrend or in a pullback within an uptrend, what we need is:
- A relatively large bullish candle appears
- Followed by a Doji
- The third candle of this pattern is a bullish candle with a body much like the body of candle 1.
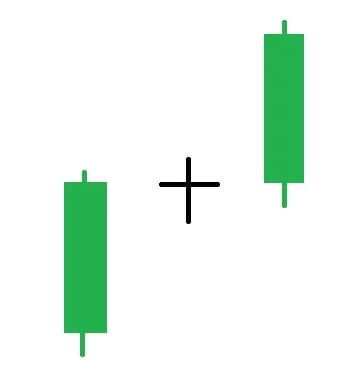
And the other way round, this setup is the bullish Doji pattern.
Note: there can be more than 1 Doji candle held between the 2 candles beside it, and many traders read that as a clearer signal.
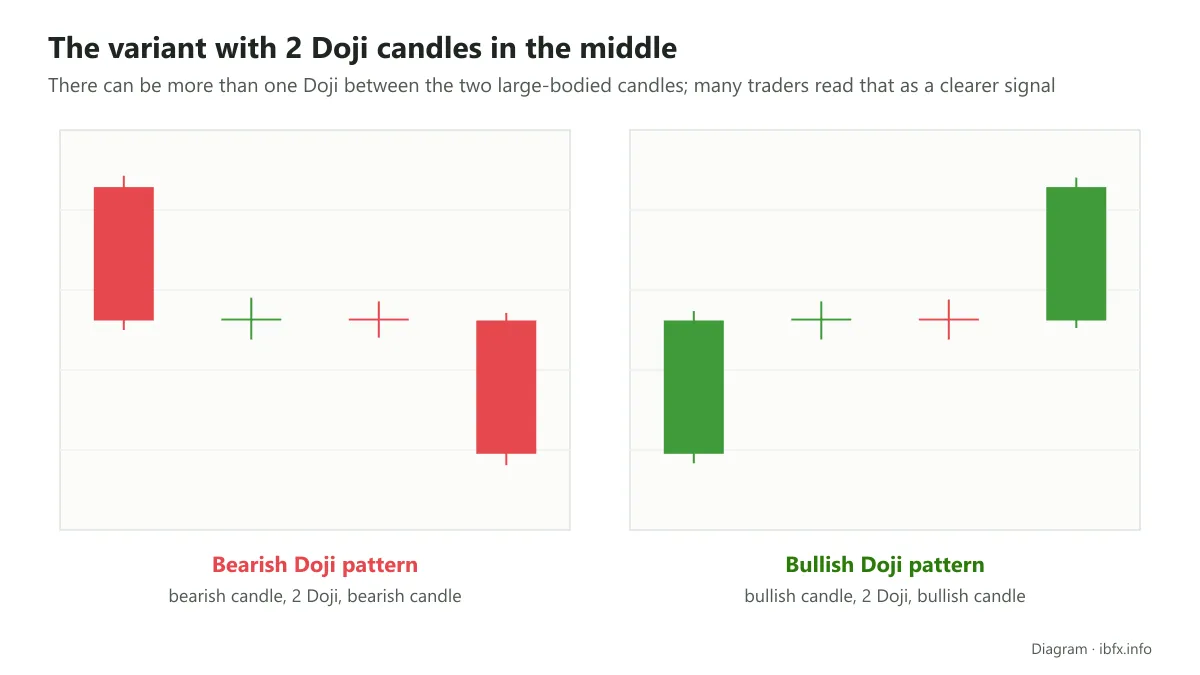
As for working out the trend of the market before the 3 candles of this pattern appear, you can simply go by the structure of the trend through the behavior of price, read straight off the H4 timeframe. In detail:
- If price moves making each high above the last and each low above the last → the market is in an uptrend
- If price moves making each high below the last and each low below the last → the market is in a downtrend.
Working out the current trend is not very hard but it is extremely important, and this step must never be skipped.
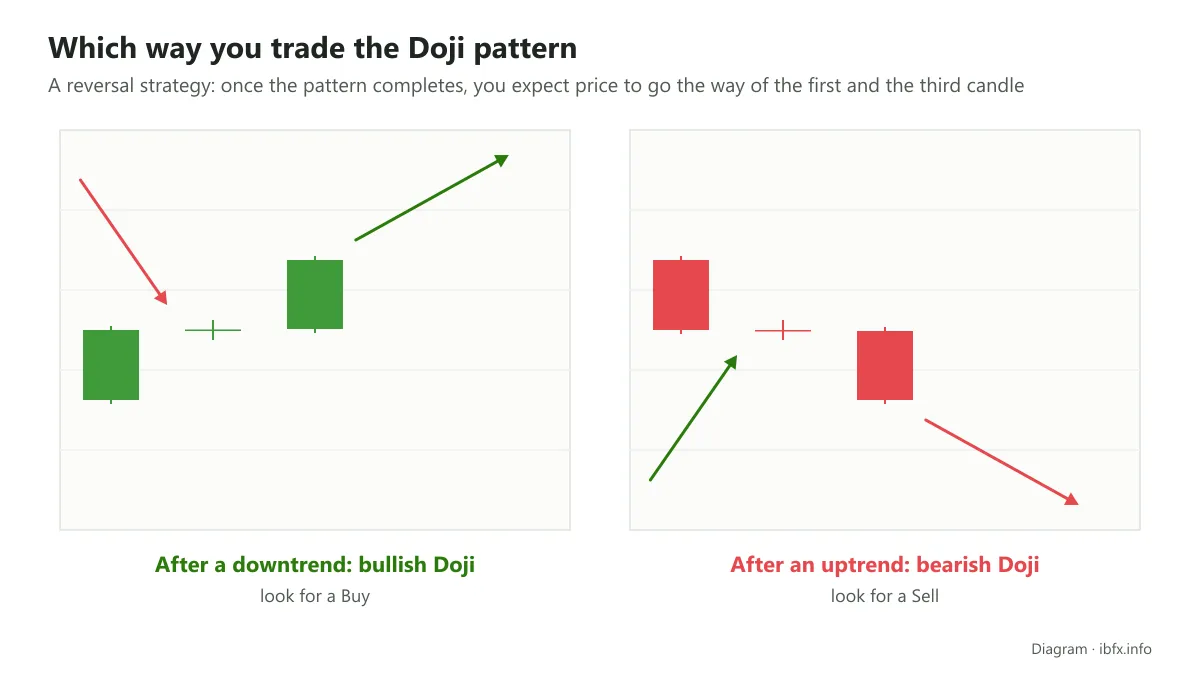
Which way you trade
This is a reversal trading strategy (a reversal of the trend, or the end of a corrective move), meaning that once the pattern completes you expect price to go the way of the first and the third candle.
Working out the entry point
There are 3 ways to enter when you trade this strategy:
- Enter as soon as the 3rd candle of the pattern closes
- Wait for a confirming candle to appear right after the third candle (if candle 3 is a bullish candle then candle 4 is a bullish candle too, and the other way round) and enter when this candle closes.
- Wait for price to break the high or the low of the third candle and then enter.
With this strategy you can use any one of the 3 entry methods above.
Confirming the trading signal with indicators
As with any candlestick pattern or any other analysis tool, the reversal signal this pattern produces also needs confirming from the signal of another analysis tool. In this strategy in particular, we use the overbought and oversold signal from Stochastic.
Managing the trade with the MA moving average
Managing the trade has to do with a trader working out whether the trade being placed is a short-term trade or one with long-term potential. And which signals say that holding the trade for a long time is well founded, or say that this trade only works in the short term.
The tool we use to manage the trade in this strategy is the moving average MA, a basic but very useful indicator.
First, use the SMA200 to work out whether the trade works in the long term and how long you should hold it.
- If the bullish Doji pattern sits below the SMA200, we should treat this as a short-term or medium-term trade. The other way round, if the bullish Doji pattern sits above the SMA200 then we have enough grounds to develop the trade over the long term, meaning to stay with the trend in order to catch a larger wave.
- If the bearish Doji pattern sits below the SMA200 then that is a chance for us to trade over the long term; the other way round, treat the trade as a short-term or medium-term trade if the pattern sits above the SMA200.
Second, use the SMA50 as a tool to watch whether the trade is going the right way.
- With the bullish Doji pattern, what we want is for price to cross above the SMA50 on the first candles after the trade has been placed, or during the building of the pattern itself.
- The other way round, with the bearish Doji pattern, price crossing below the SMA50 on the first candles after entry or during the building of the pattern is what we are interested in and waiting for.
The strategy for placing the stop loss and the take profit
Stop loss
Because the strategy uses the SMA50 moving average, we will make use of this indicator for the stop loss strategy too. In detail:
- For the bullish Doji pattern: place the stop loss just below the lowest price of the pattern, and when price crosses above the SMA50, move the stop loss to just below that moving average to cut the risk.
- For the bearish Doji pattern: place the stop loss just above the highest price of the pattern, and when price crosses below the SMA50, move the stop loss to just above that moving average to cut the risk.
- In both cases, work out the position size from the original stop loss distance so that each trade risks only a small part of the account.
Take profit
For the take profit strategy we have more choices, depending on the real conditions of the market.
- For the bullish Doji pattern, if the pattern shows up below the SMA200 then we can close the trade when Stochastic goes into the overbought zone and is coming back out of it. If the pattern shows up above the SMA200 then we need another, stronger reversal signal in order to catch a larger wave, such as the SMA50 crossing the SMA200 from above, or price crossing the SMA50 from above.
- For the bearish Doji pattern, if the pattern shows up above the SMA200 then we can close the trade when Stochastic goes into the oversold zone and is coming back out of it. If the pattern shows up below the SMA200 then we need another, stronger reversal signal, such as the SMA50 crossing the SMA200 from below, or price crossing the SMA50 from below.
Example 1: the bearish Doji pattern
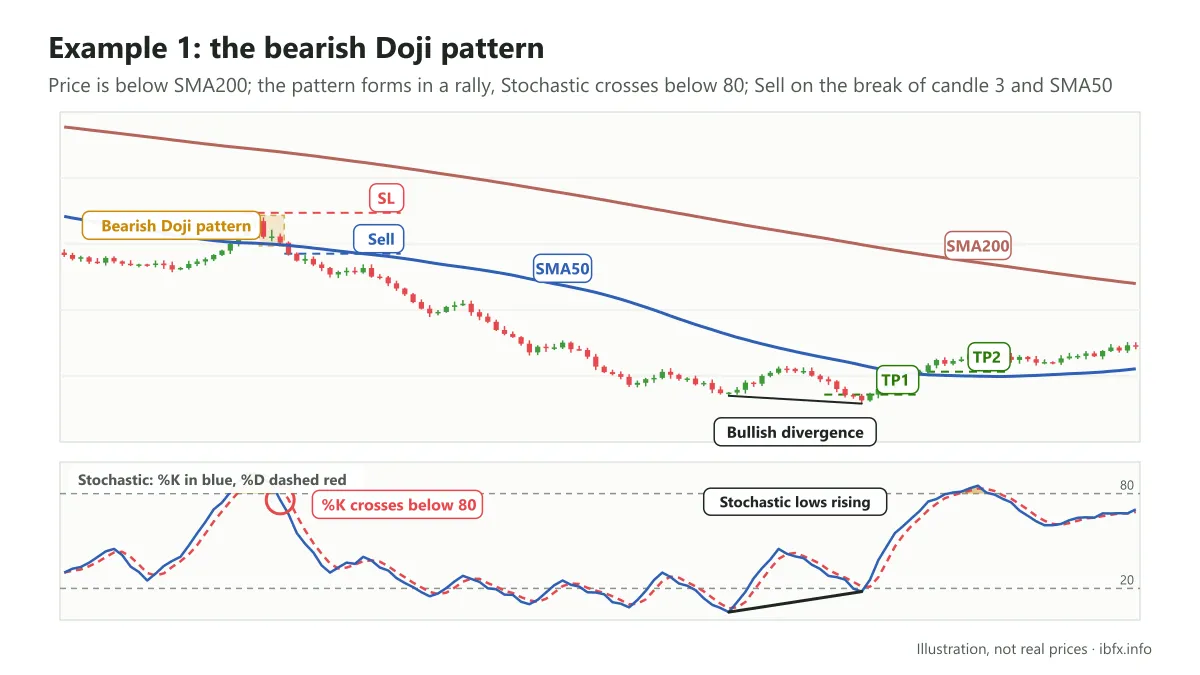
First of all, we can judge that the current trend of the market is down, because all of the prices sit below the SMA200. The bearish Doji pattern appears while the market is in a rally.
While the candles of the pattern are building, Stochastic goes into the overbought zone as well (up through the 80 level). When the 3rd candle of the pattern completes, Stochastic also crosses the 80 line heading down → a signal that price may start to fall.
We can enter a Sell right away when the 3rd candle closes, or wait for price to break the lowest price of candle 3 successfully and only then enter (as in the picture above). In this case the red candle that breaks out of candle 3 of the pattern (closing below the lowest price of candle 3) is also the candle that breaks the SMA50 heading down → the signal of a fall in price is reinforced.
Place the stop loss just above the highest price of the pattern. In this case the distance from the pattern to the point where price breaks the SMA50 heading down is very short, so we do not need to move the stop loss.
This bearish Doji pattern shows up below the SMA200, so we can look forward to a long-term trade. Our first target is to wait for price to cross the SMA200 from below, or for the SMA50 to cross the SMA200 from below, and close the trade then, because at that point the long downtrend has officially reversed.
As price moved on, though, a bullish divergence between price and Stochastic appeared, warning that the trend may reverse. So we can close the trade early here to keep as much of the profit as possible (point TP1). Or straight afterwards price crosses the SMA50 from below, and you can close the trade there as well (point TP2).
Example 2: the bullish Doji pattern
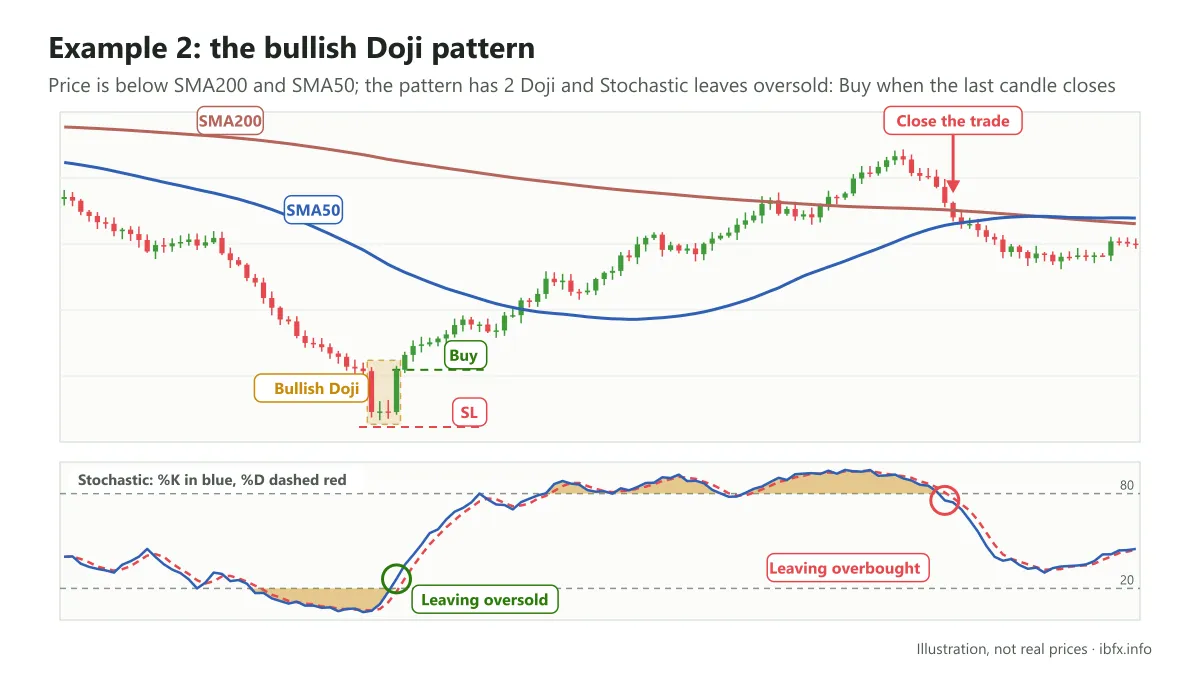
Most of the prices sit below the SMA200, and below the SMA50 as well → the market is in a strong downtrend. The bullish Doji pattern shows up in a downtrend, warning that the trend may reverse or that a rally may follow. Because the pattern shows up below the SMA200, this trade is expected to be a short-term or medium-term one.
This bullish Doji pattern is fairly clear, with 2 Doji candles in the middle and the 2 candles beside them almost equal in size.
When the pattern completes, Stochastic also begins to leave the oversold zone → the bullish signal is reinforced → enter as soon as the last candle of the pattern closes.
After that, price also crosses the SMA50 from below. Our job now is to wait for a signal of a downward reversal in price so that we can close the trade.
In this case we can move the stop loss up, placing it just below the candle that broke the SMA50.
After a stretch of rising as expected, price crosses the SMA200 from below, but straight afterwards it falls and crosses below the SMA200, and at the same time Stochastic begins to leave the overbought zone → a warning that price may fall, so we can close the trade right as the falling candle that crosses below the SMA200 closes (as in the picture).
Another setup of the Doji pattern
Alongside the basic setup of the Doji pattern set out above, there is one more setup. In detail:
- The bullish Doji pattern: shows up in a downtrend or in a pullback within an uptrend. The first signal candle is a bearish candle with a relatively large body, then comes a Doji, and the 3rd candle is a bullish candle that closes above the open of the first candle.
- The bearish Doji pattern: shows up in an uptrend or in a rally within a downtrend. The first signal candle is a bullish candle with a relatively large body, then comes a Doji, and the 3rd candle is a bearish candle that closes below the open of the first candle.
These 2 patterns are fairly close to the Morning Star and the Evening Star; the difference is that here the third candle must close above or below the open of candle 1, while with the Morning Star and the Evening Star it only has to close above or below 50% of the body of candle 1.
The trading strategy for this special setup is exactly the same as for the basic setup above, or you can also look at the trading strategies for the Morning Star and Evening Star patterns, because in terms of what they mean they are very much alike.
Final thoughts
For anyone who follows the swing trading style and the price action method of analysis, you can test this strategy out, or use it as a detailed guide for building your own Doji strategy on H4 to suit your own system. Like every other strategy, it is not right in every case, so check it on past data and on a demo account before you use it with real money.