Sign in

Technical analysis

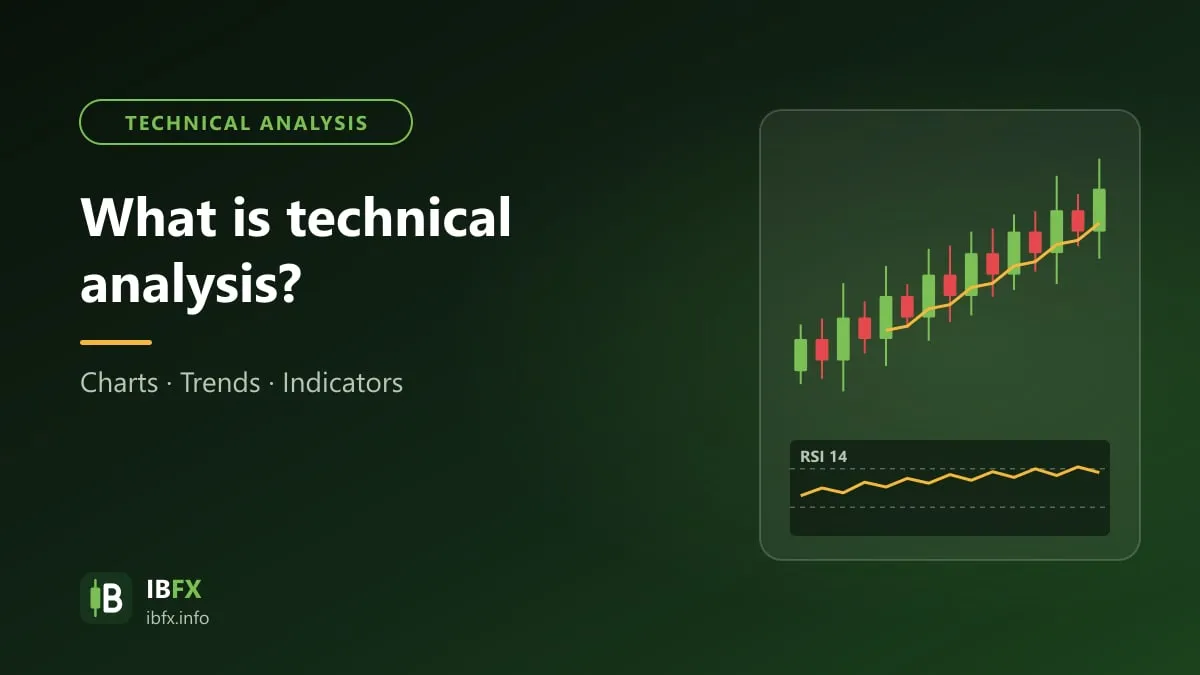
Candlestick patterns, chart patterns, support and resistance, and indicators such as RSI, MACD, Bollinger Bands, Fibonacci and Ichimoku.

54 guides

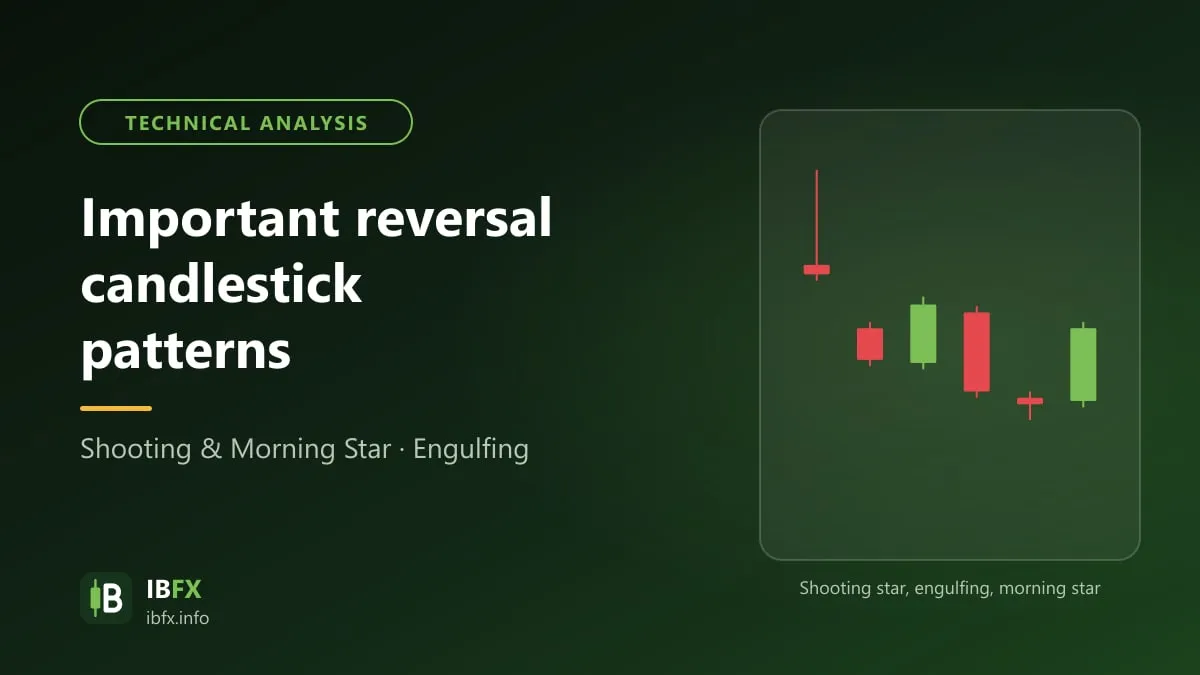
Important reversal candlestick patterns to know in forex

A roundup of the important bullish and bearish reversal candlestick patterns in forex: Doji, engulfing, Piercing, Harami, Hammer, Morning Star, Evening Star, Shooting Star, with how to confirm them and the rules for trading them…

Updated Sep 24, 2026

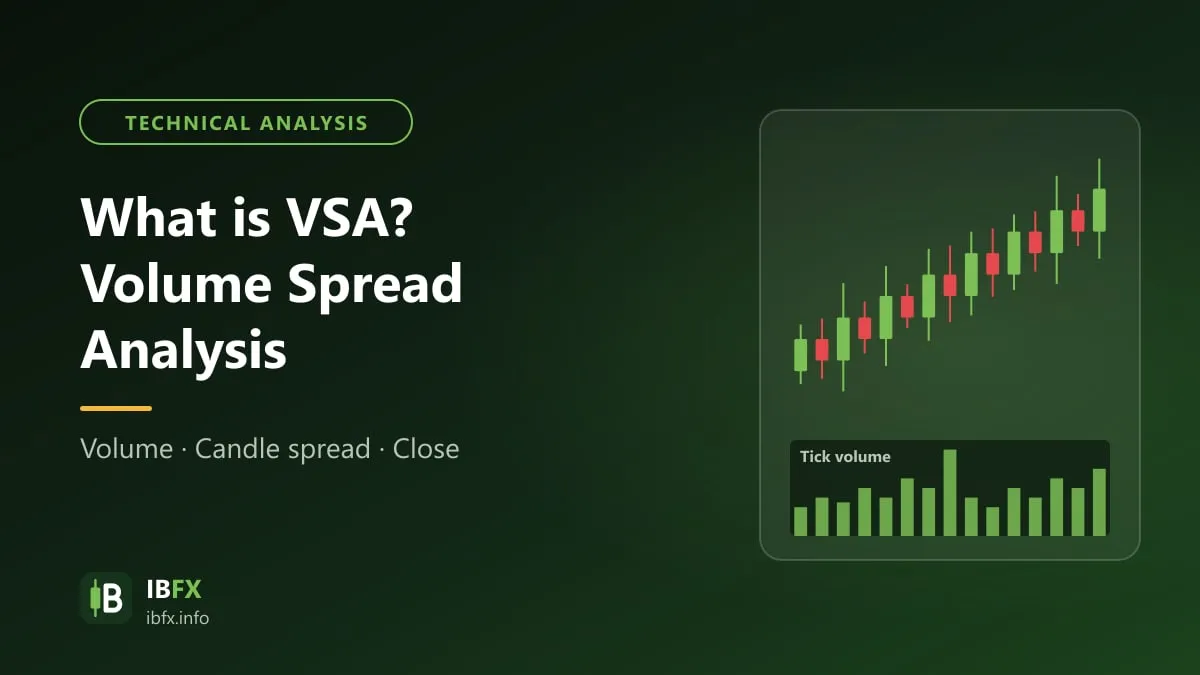
What is VSA? How to apply Volume Spread Analysis

Volume Spread Analysis (VSA) is a method of analysis many people see as hard to get into. It reads the relationship between volume, the range of the candle and the closing price to judge supply and demand…

Updated Sep 23, 2026

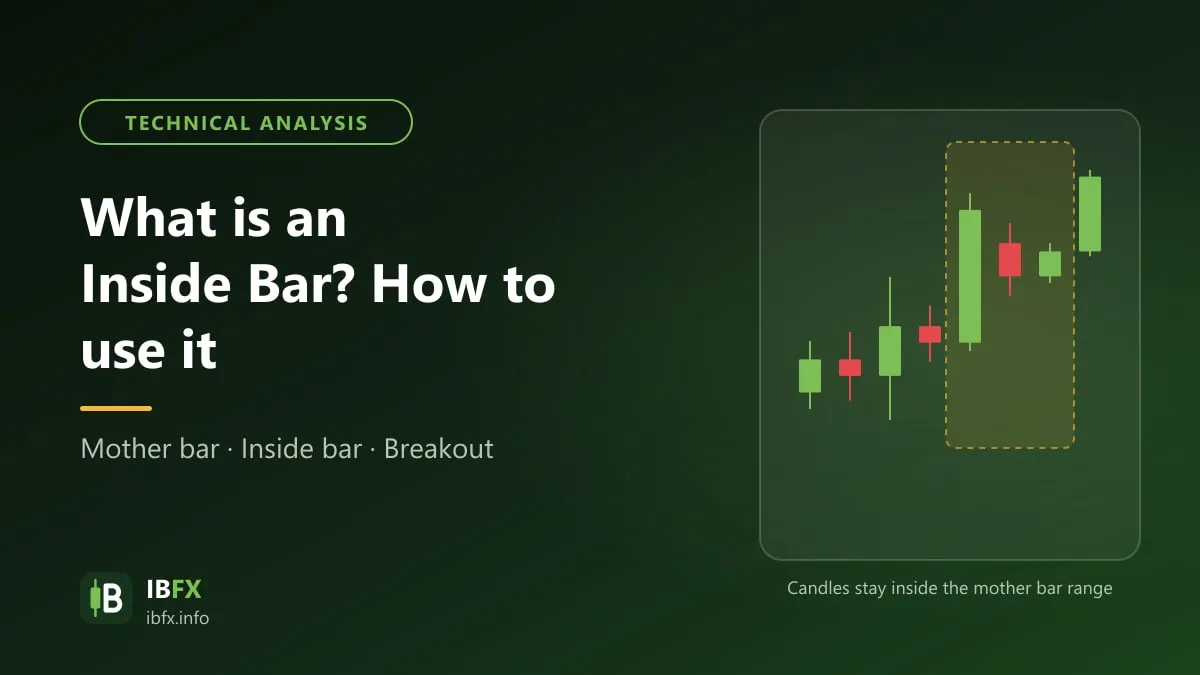
What is an Inside Bar? How to use the Inside Bar candle

The Inside Bar is a candle-inside-a-candle pattern which, together with the Pin Bar and the Fakey, is one of the patterns Price Action traders mention most. What marks it out, its variations and how to trade it…

Updated Sep 23, 2026

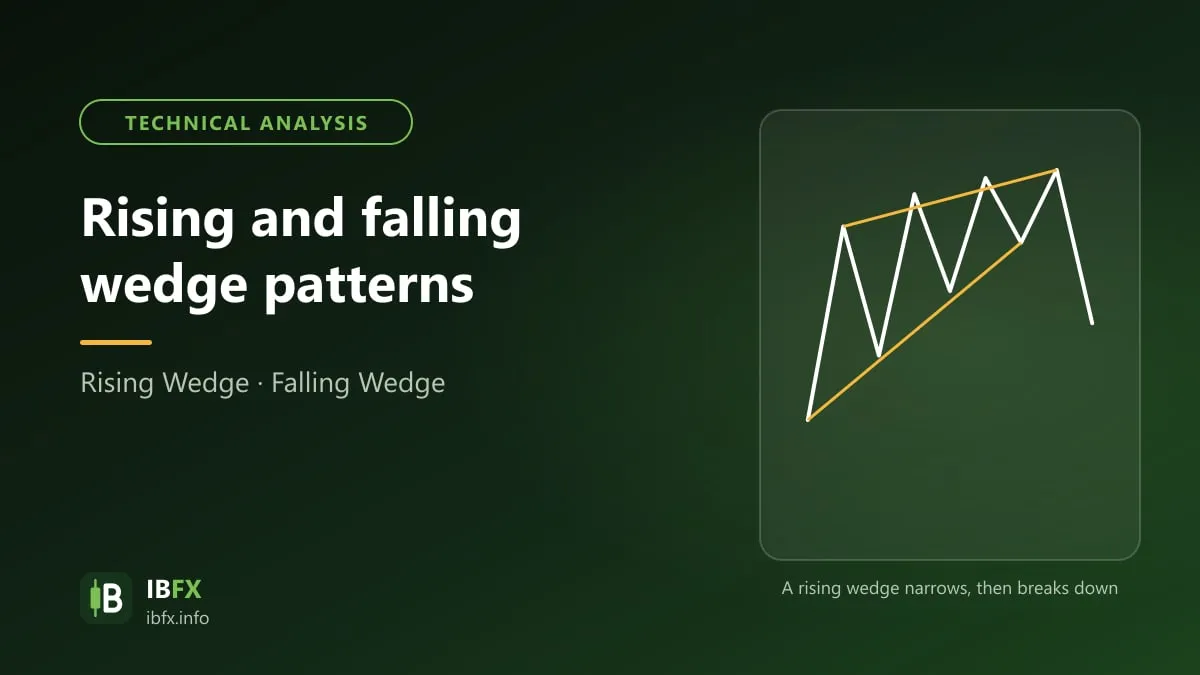
Rising and falling wedge patterns

The wedge is made of two trendlines that both slope up (rising wedge) or both slope down (falling wedge) and gradually converge. A wedge can be a continuation or a reversal pattern. How to spot one and how to trade it…

Updated Sep 23, 2026

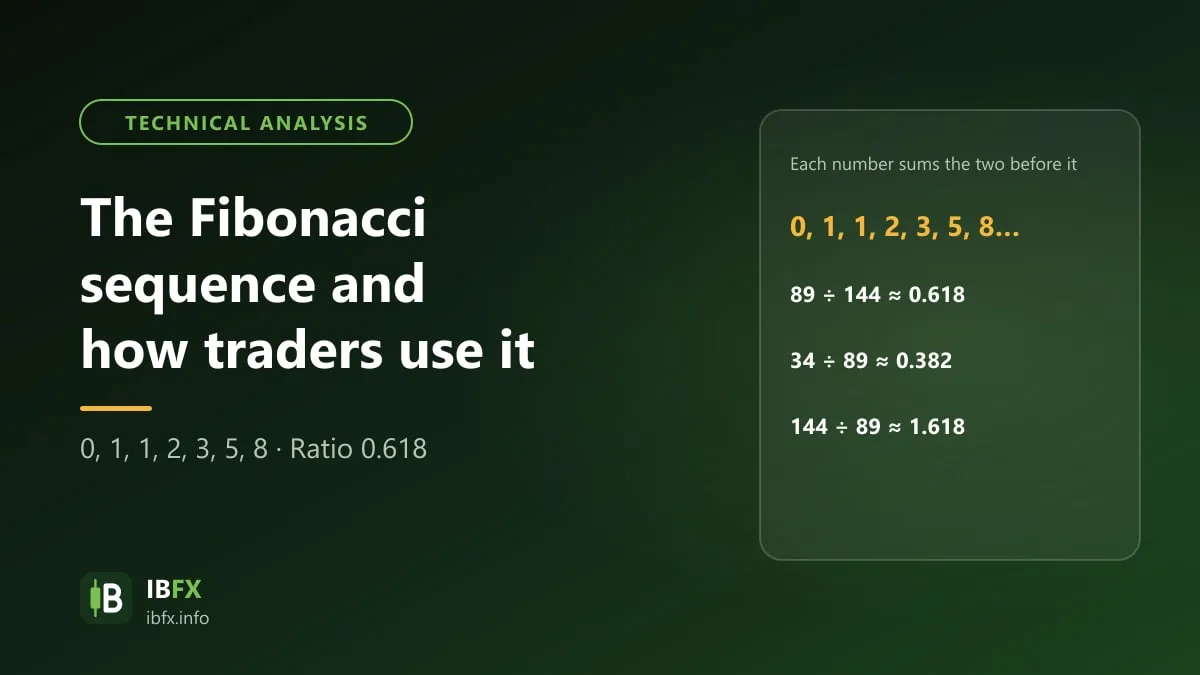
The Fibonacci sequence: what it is and how traders use it

The Fibonacci sequence and the golden ratio sit behind the Fibonacci tools that are so common in technical analysis. Where the sequence comes from, the ratios that matter and how Fibonacci is used in forex…

Updated Sep 24, 2026

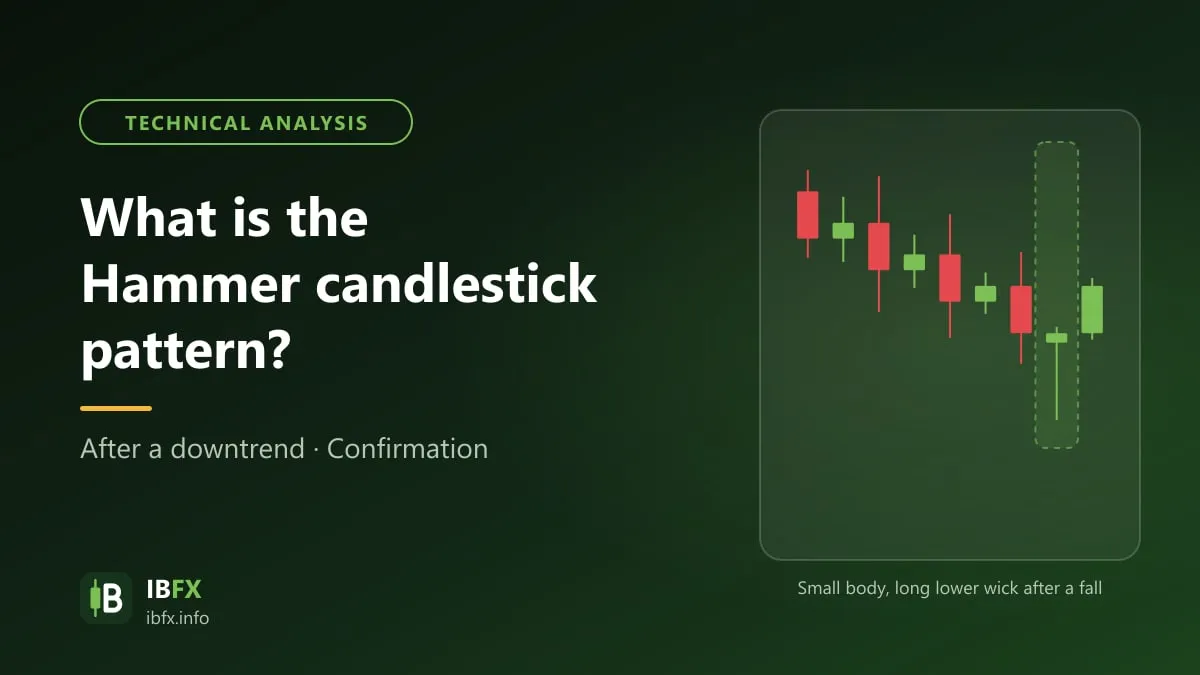
What is the Hammer candlestick pattern?

The Hammer candlestick pattern is probably one of the candle patterns most traders know, in particular traders who follow the Price Action school, because it is very easy…

Updated Sep 24, 2026

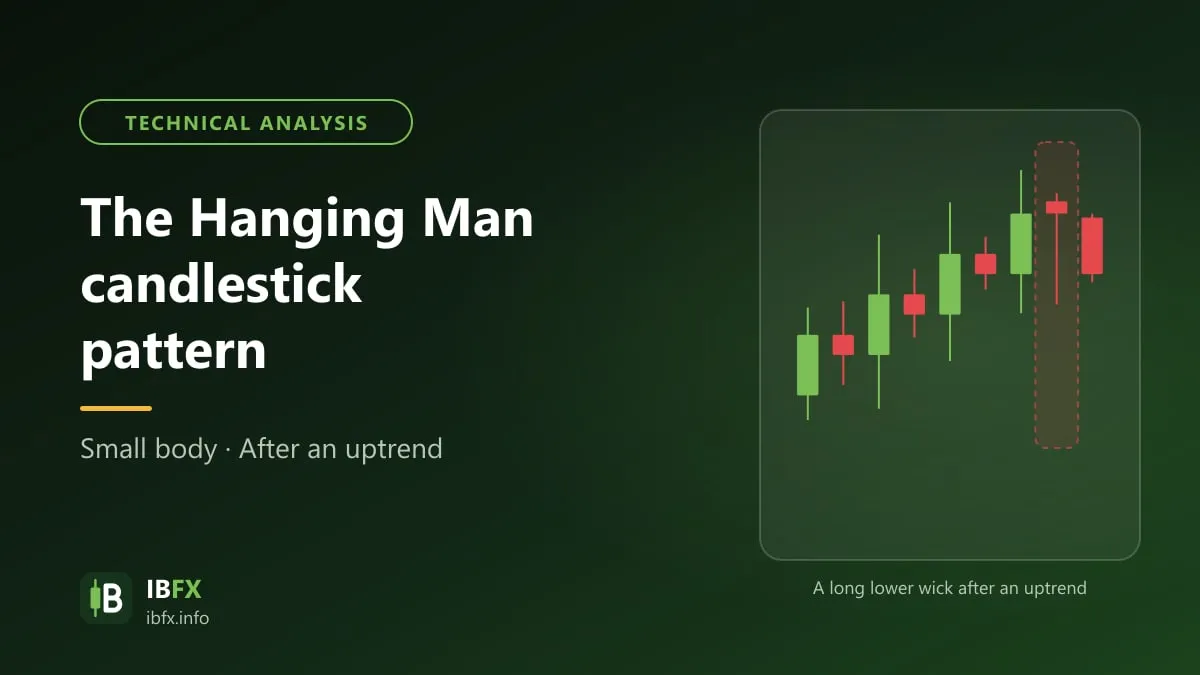
The Hanging Man candlestick pattern

The Hanging Man is a bearish reversal candle that appears after a rise in price, with a small body and a long lower wick. What marks it out, the market psychology behind it and how to trade the Hanging Man…

Updated Sep 24, 2026

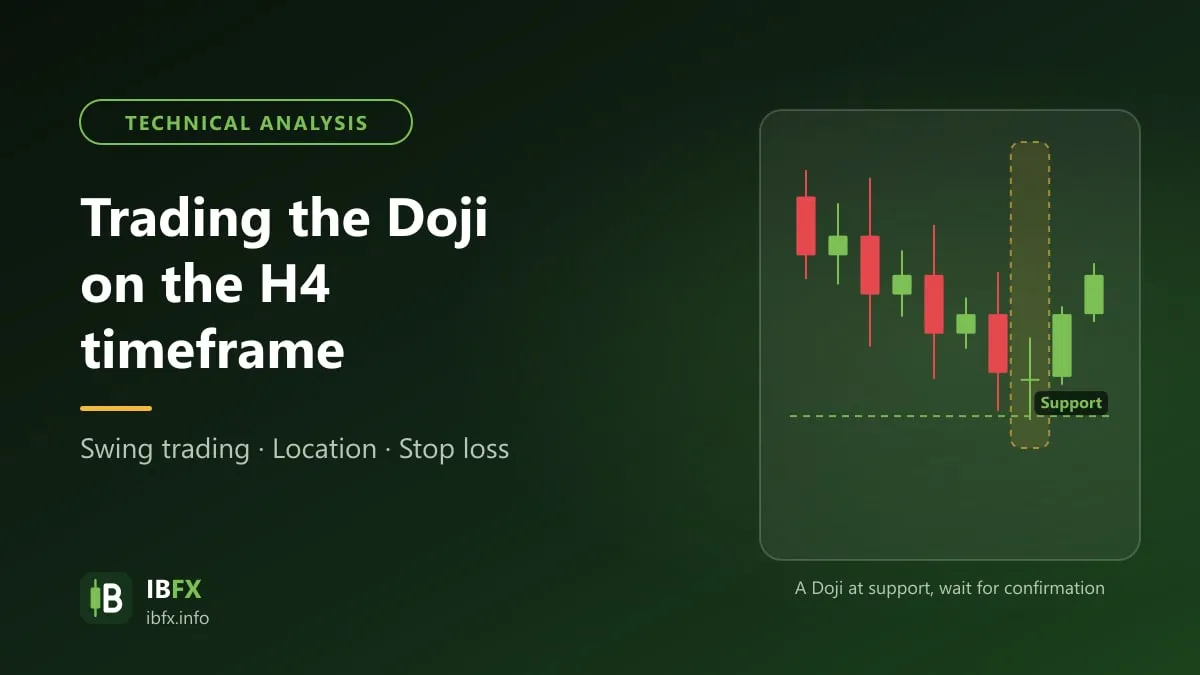
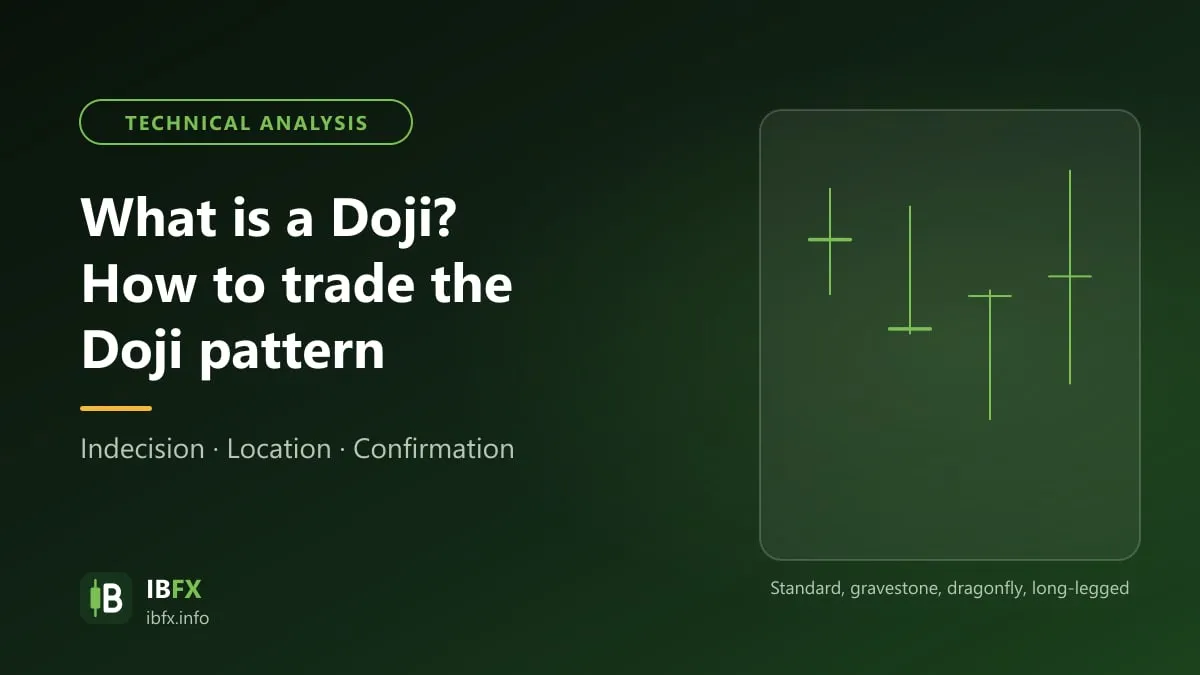
What is a Doji candle? How to trade the Doji pattern

Just about anyone who trades forex knows the Doji candle, one of the classic candle shapes because it is so easy to spot. But seeing a Doji does not mean you enter a trade straight away…

Updated Sep 24, 2026

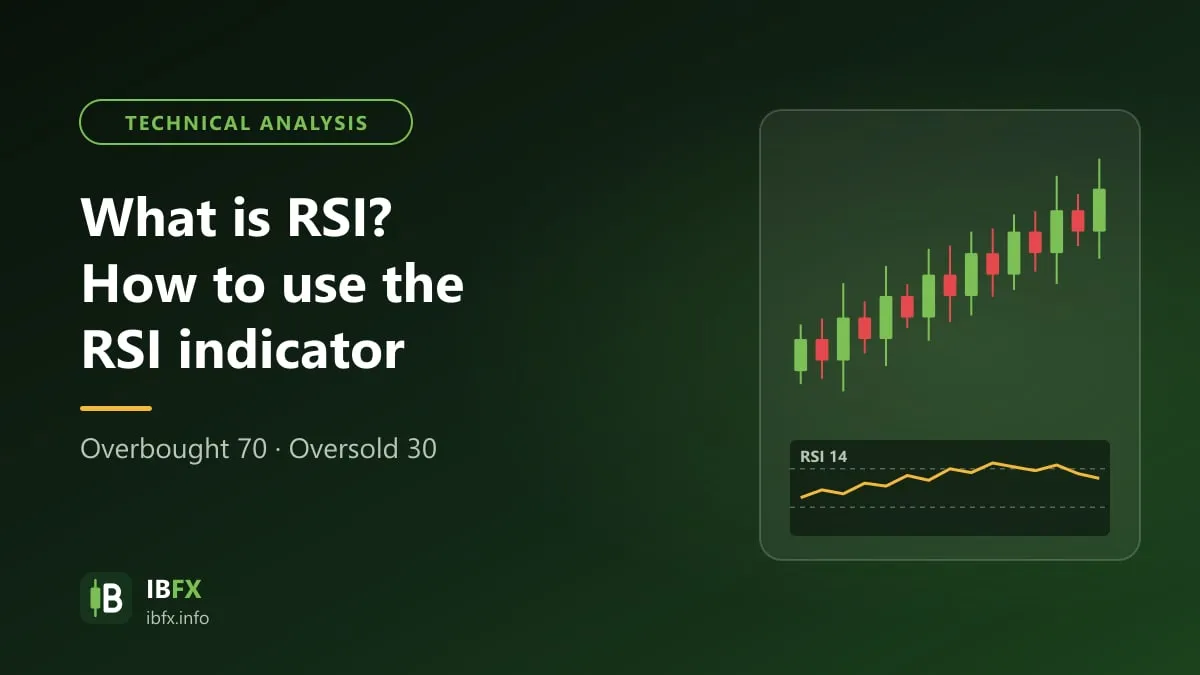
What is RSI? How to use the RSI indicator

RSI (Relative Strength Index) is a momentum indicator that moves between 0 and 100, used by many traders to spot overbought and oversold conditions, divergence and Failure Swings. The formula, the setup and how to trade it…

Updated Sep 23, 2026

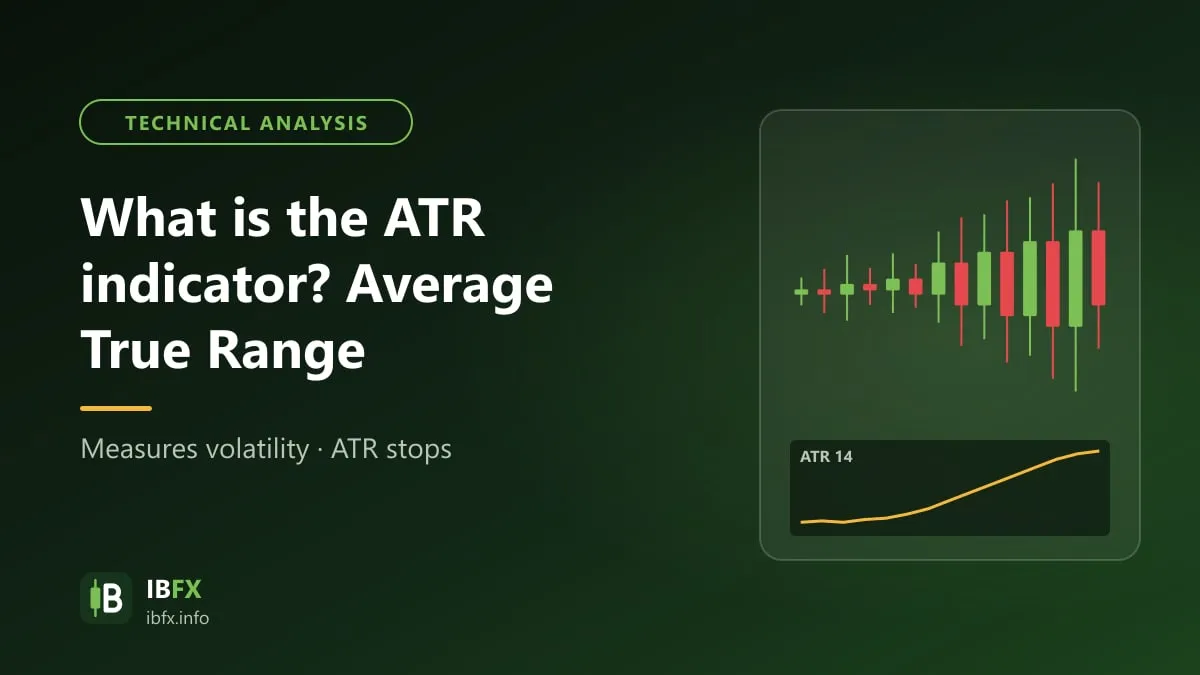
What is the ATR indicator? How to use the Average True Range

The ATR (Average True Range) is an indicator that measures how much price moves; it does not tell you whether the trend is up or down. The formula, how to set it up in MT4 and how to use the ATR to place a stop loss and a take profit…

Updated Sep 24, 2026

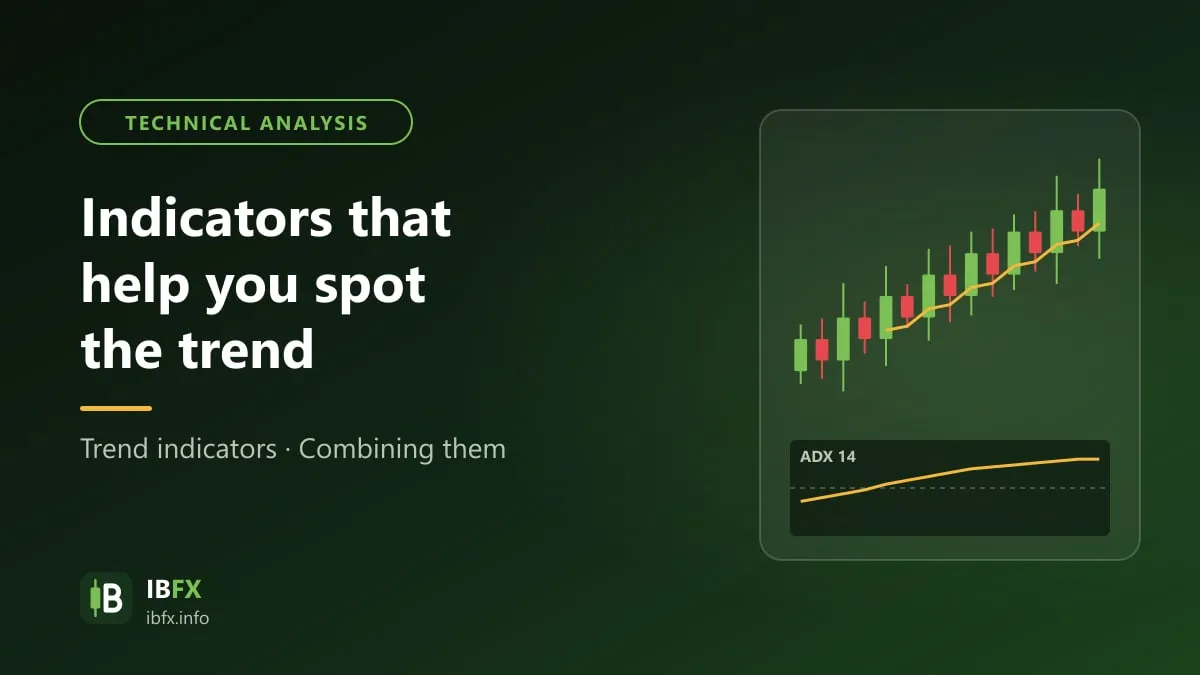
What is the ADX indicator? How to set it up and how to use it

ADX (the Average Directional Index) is the indicator that measures the strength of a trend, used together with the +DI and -DI lines to work out the direction. How to read ADX, how to set it up on MT4 and how to trade it…

Updated Sep 24, 2026

What is a pullback? How to trade pullbacks

A pullback, put simply, is the stretch where price temporarily moves against the main trend (up or down) that was set before it, to correct the price…

Updated Sep 24, 2026

What is Chaikin Money Flow? How to trade with CMF

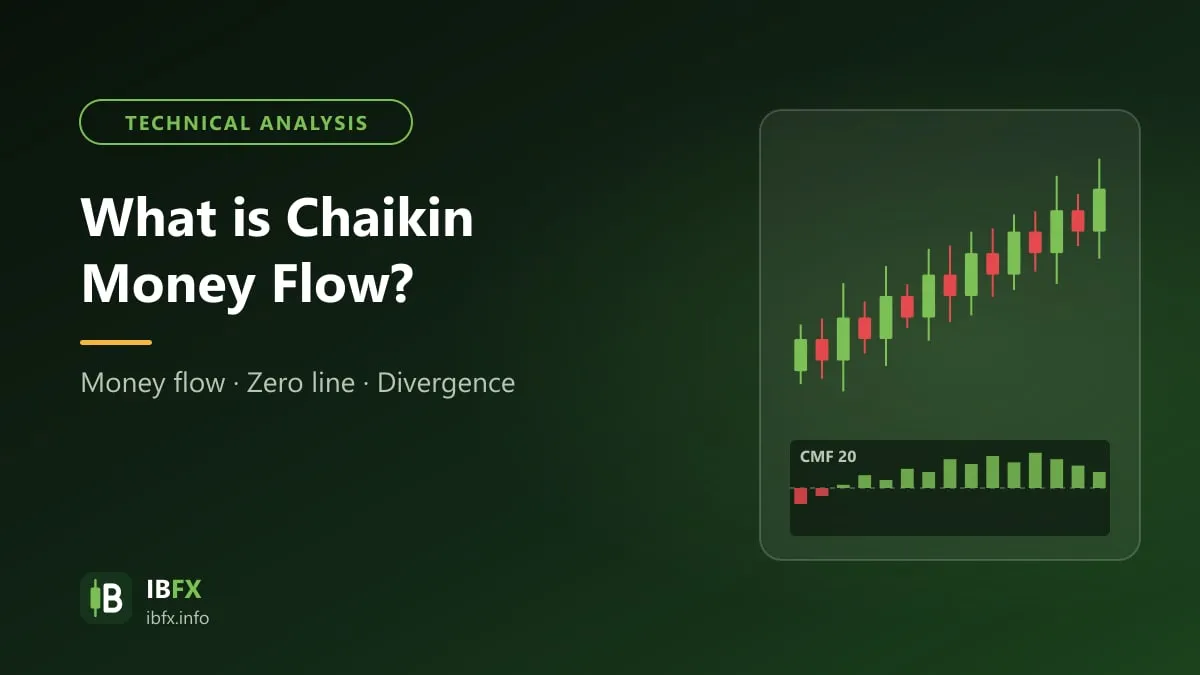
Chaikin Money Flow (CMF) is a volume indicator developed by Marc Chaikin that measures buying and selling pressure from price and volume. The formula, how to set it up on MT4 and how to trade with CMF…

Updated Sep 24, 2026

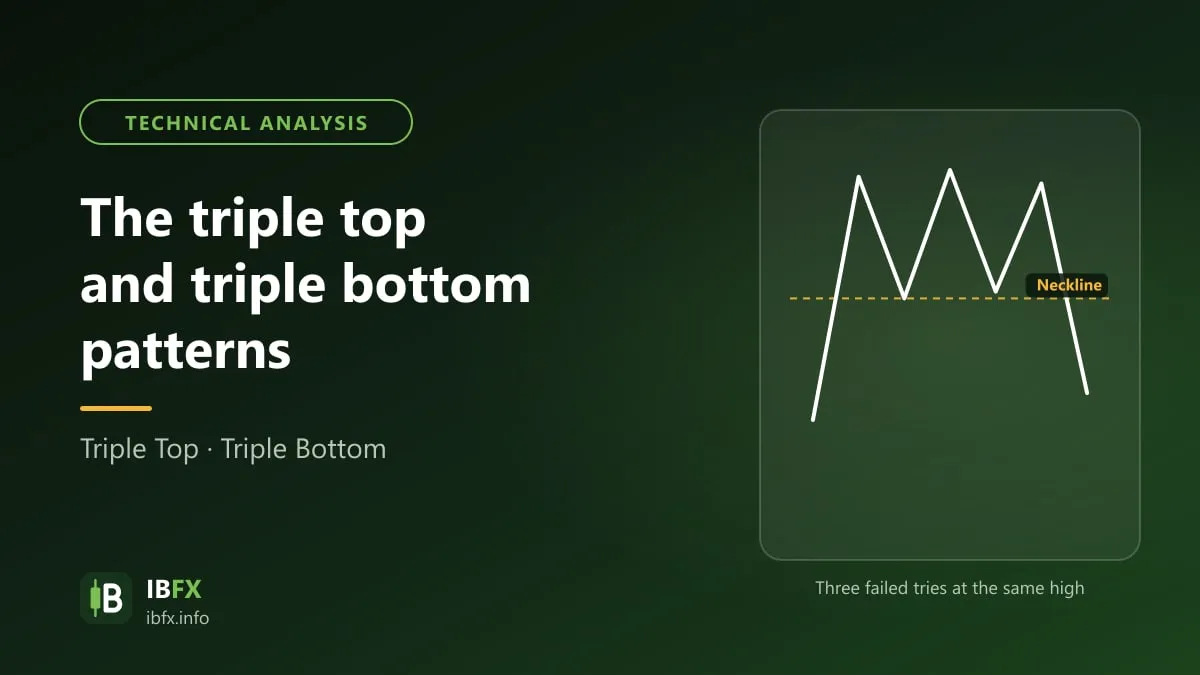
The triple top and triple bottom patterns

The triple top and the triple bottom are reversal price patterns, variants of the double top and double bottom. How to spot a textbook pattern, how to enter, where to put the stop loss…
Updated Sep 24, 2026

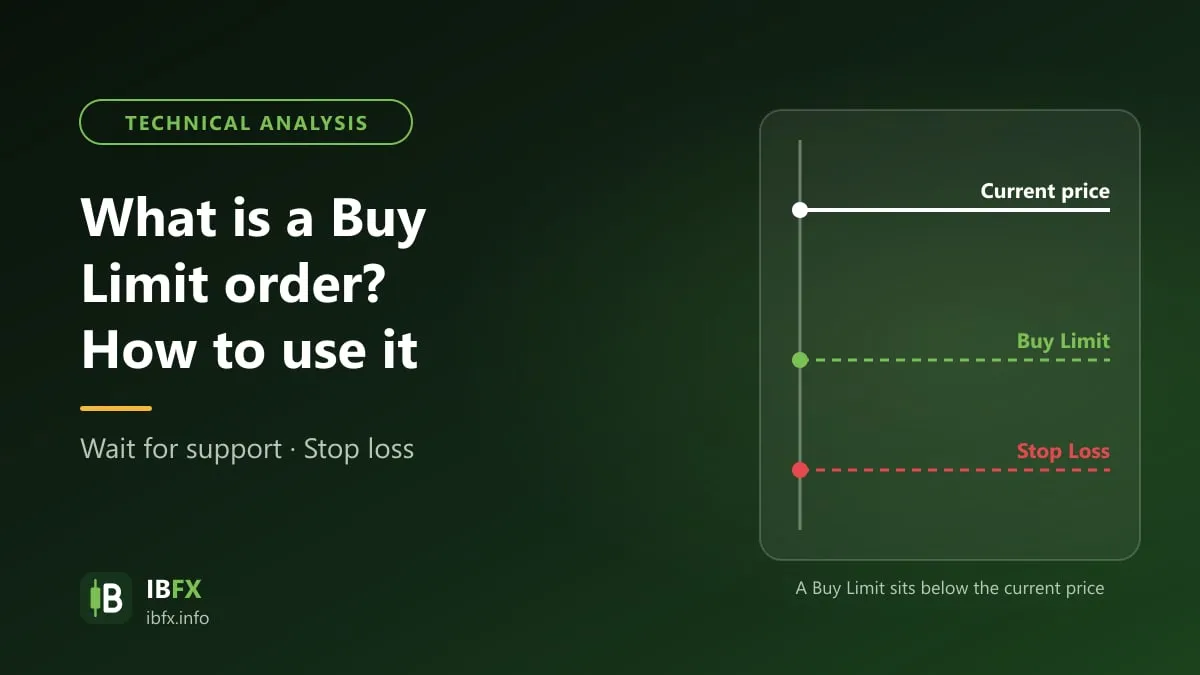
What is a Buy Limit order? How to use it

A Buy Limit is a pending order to buy at a price below the current one, usually used to buy at a support area in an uptrend. How to place a Buy Limit in MT4, with an example and the risks…
Updated Sep 23, 2026

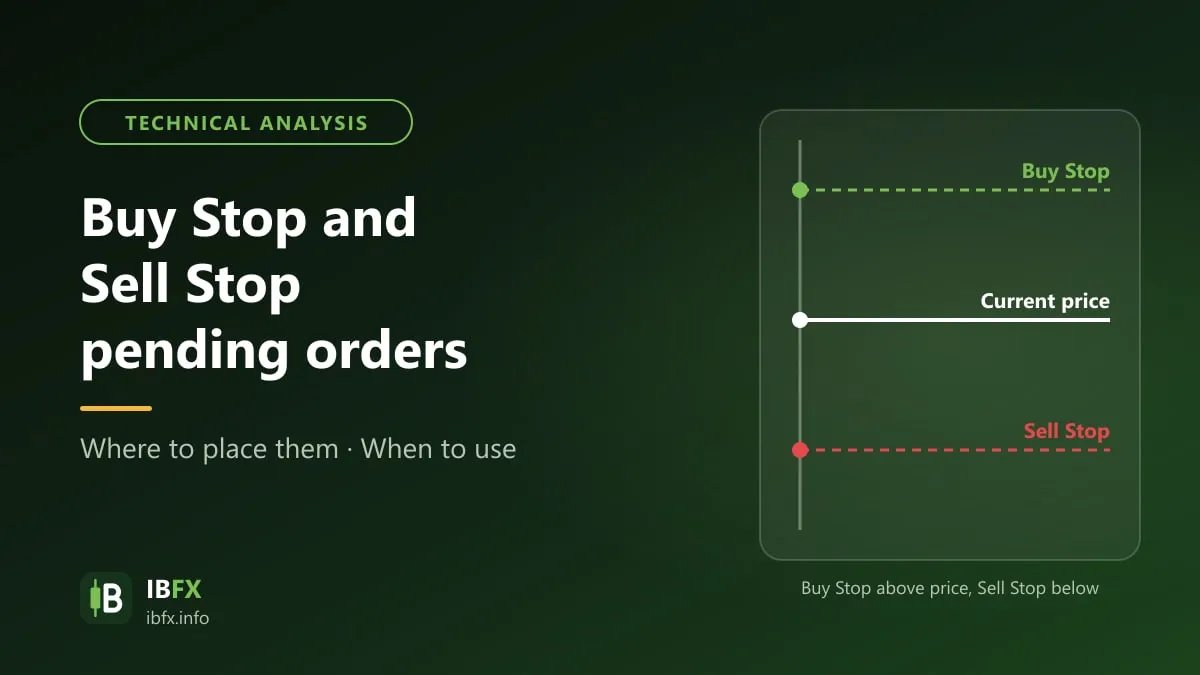
What are Buy Stop and Sell Stop orders?

A Buy Stop is a pending order to buy at a price above the current one, a Sell Stop a pending order to sell at a price below the current one, and both are usually used for breakout trading. How to place them, with examples…
Updated Sep 23, 2026

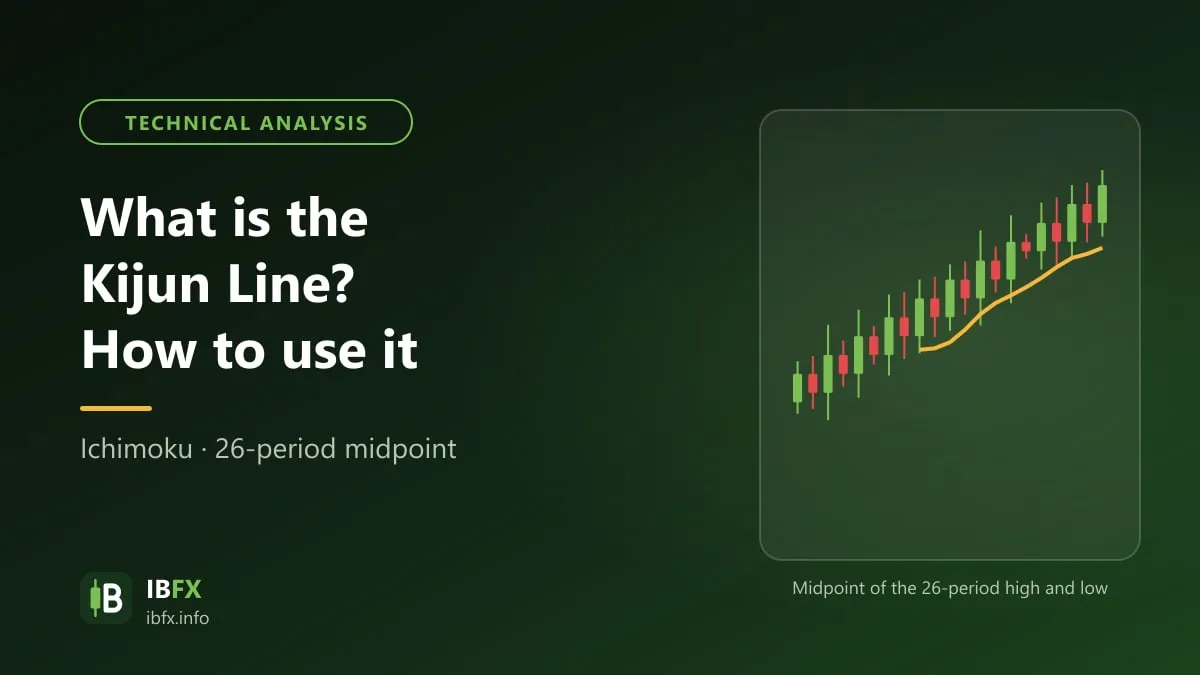
What is the Kijun Line? How to use it

The Kijun-sen (the Kijun Line, the base line) is an important part of the Ichimoku indicator, and it shows the balance point of price over 26 sessions. The formula and how to use the Kijun-sen…

Updated Sep 23, 2026

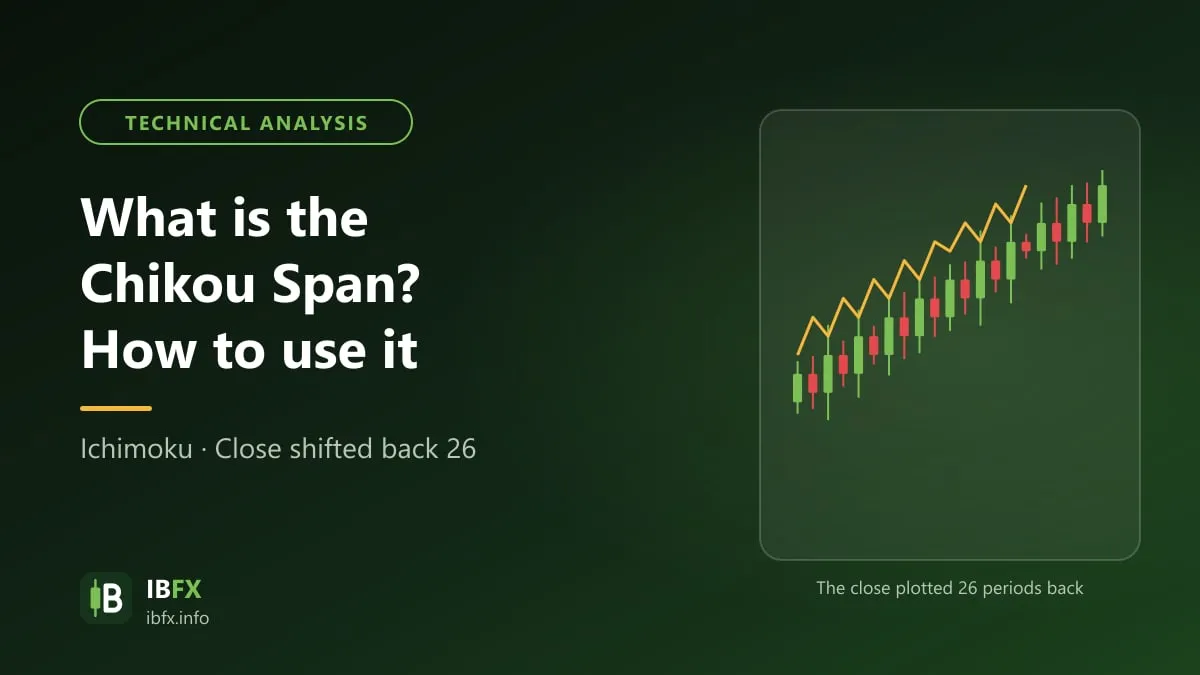
What is the Chikou Span? How to use it

The Chikou Span (the lagging span) is a part of the Ichimoku indicator, made by shifting the closing price 26 sessions back, and it is mostly used to confirm the trend. How to read it and how to trade it…

Updated Sep 23, 2026

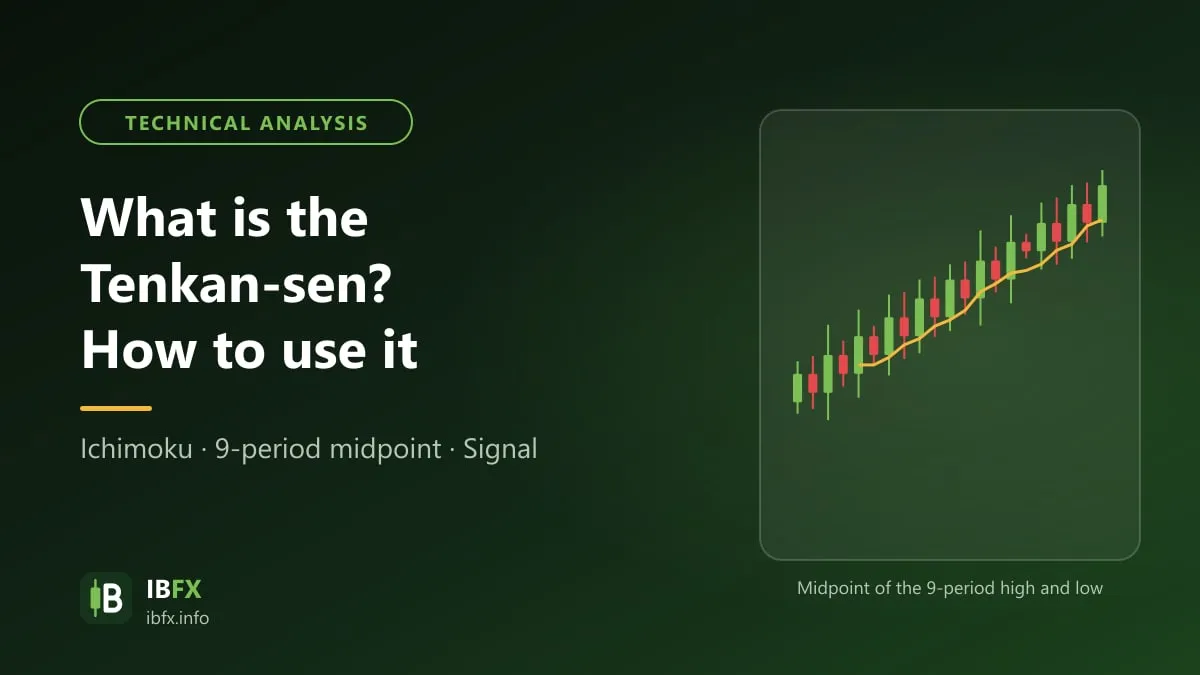
What is the Tenkan-sen? How to use it

The Tenkan-sen (the conversion line) is one of the 5 parts of the Ichimoku indicator, and it shows the short-term balance point of price over 9 sessions. The formula, the setup and how to use it…

Updated Sep 23, 2026

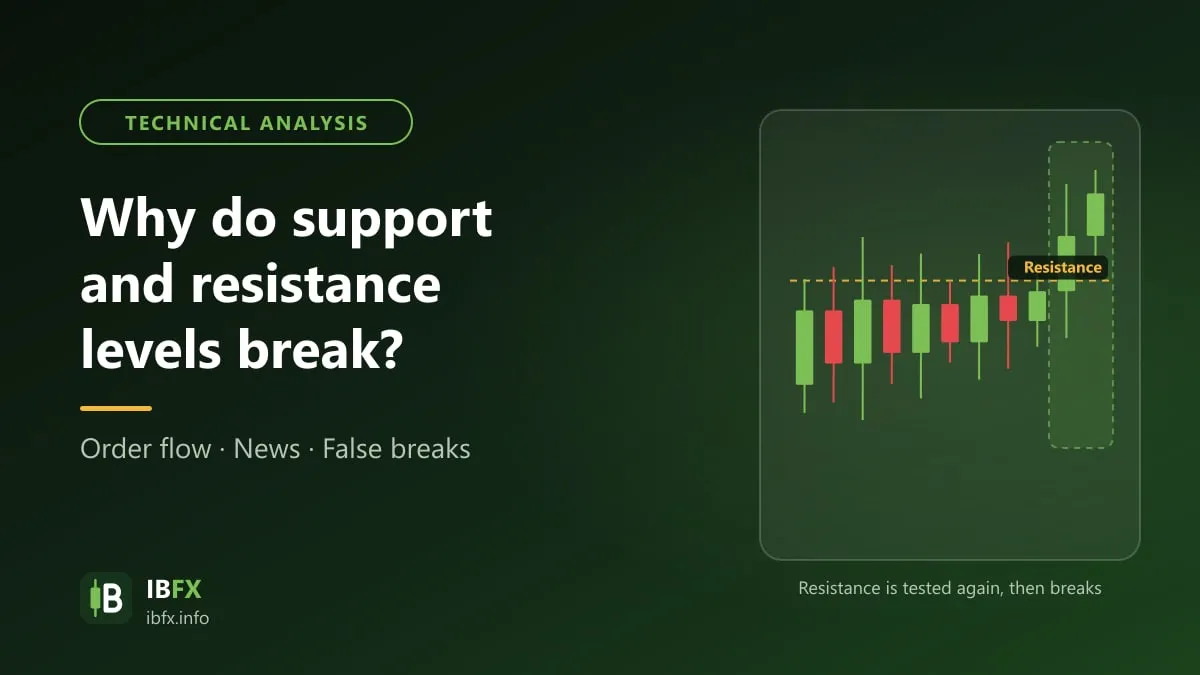
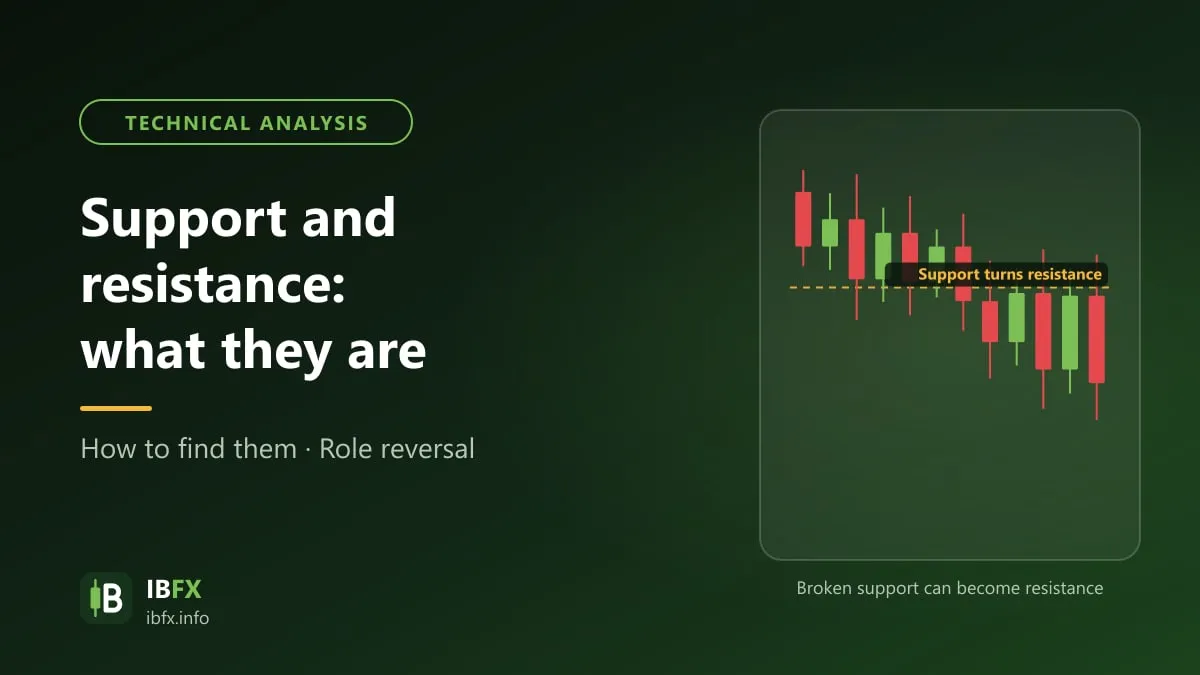
Why do support and resistance levels break?

Working out support and resistance levels matters a great deal to a trader, but it is not easy, and no level lasts forever. Why support and resistance break, and how to spot it…

Updated Sep 23, 2026

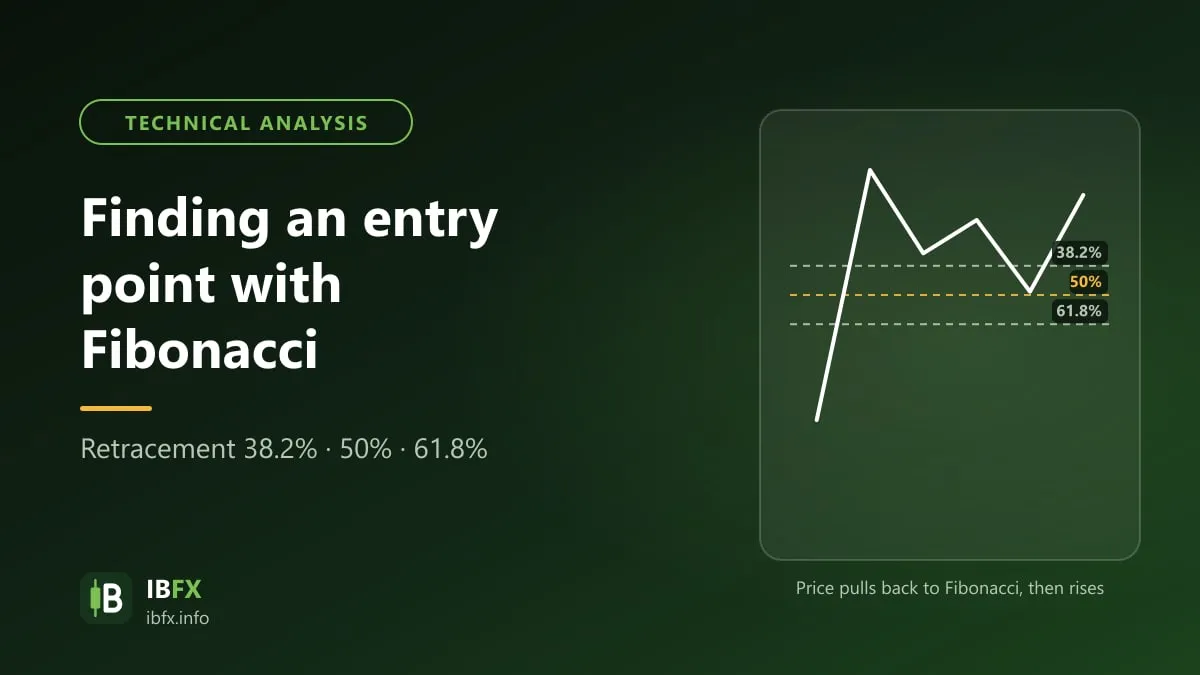
How to find an entry point with Fibonacci

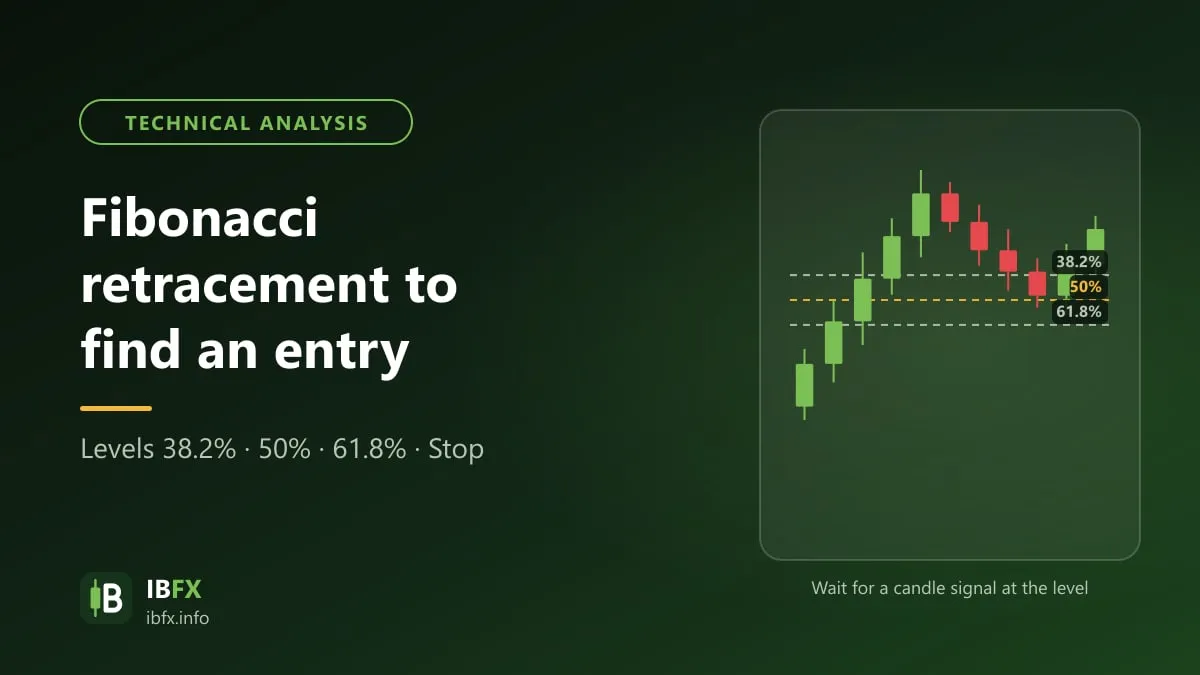
Fibonacci is a classic tool in technical analysis, used by traders at every level to find potential support and resistance zones, entry points and take profit targets…

Updated Sep 23, 2026

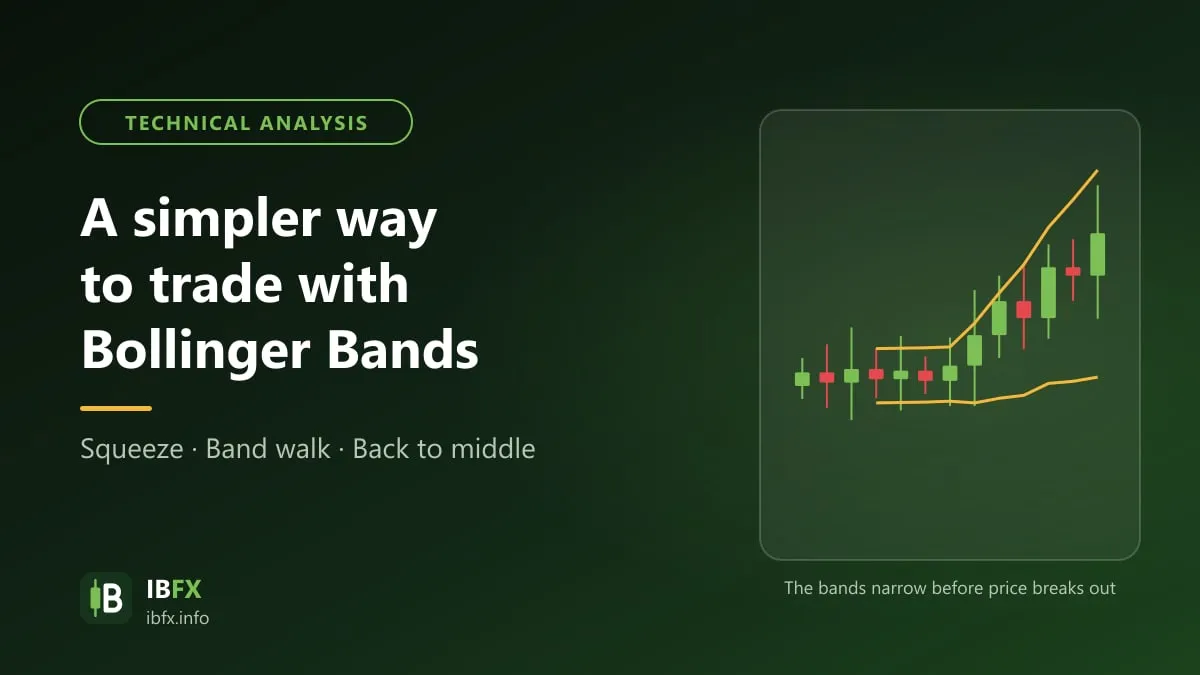
How to trade with Bollinger Bands

If you are a devotee of Bollinger Bands, this article will help you put the ways of using this indicator in order. This article will help you…

Updated Sep 24, 2026

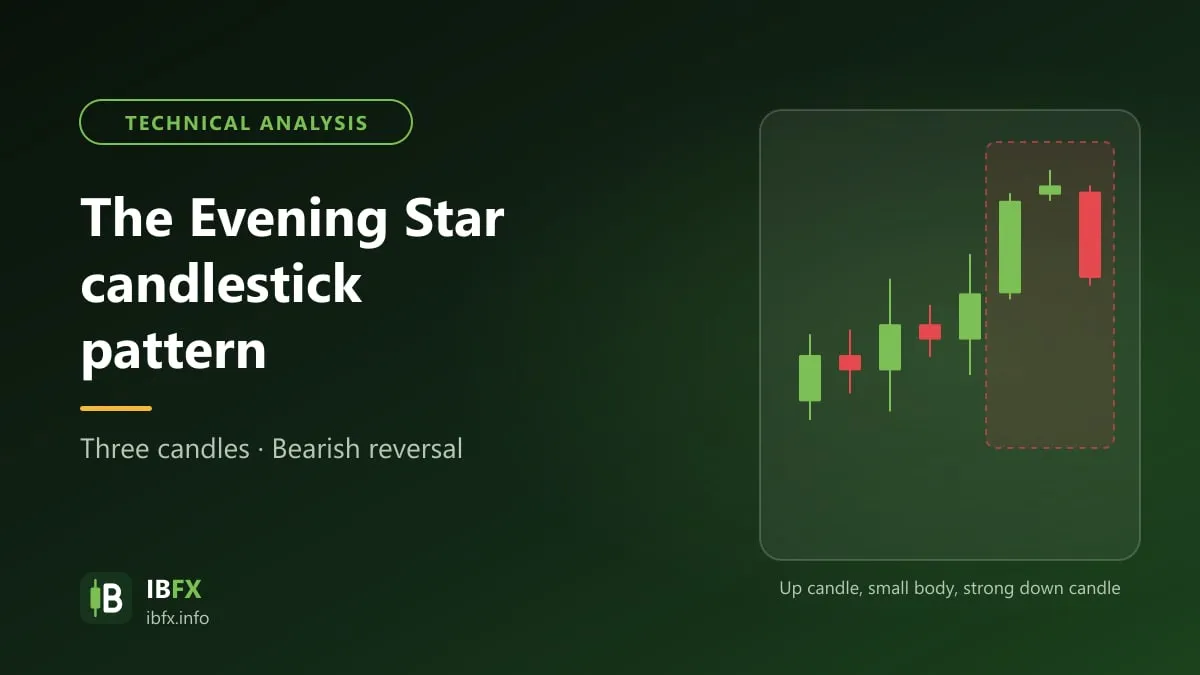
The Evening Star candlestick pattern

The Evening Star is a pattern of three candles that signals a possible downward reversal after an uptrend. What marks it out, how to enter, where to put the stop loss, and what to keep in mind when you trade it…

Updated Sep 23, 2026

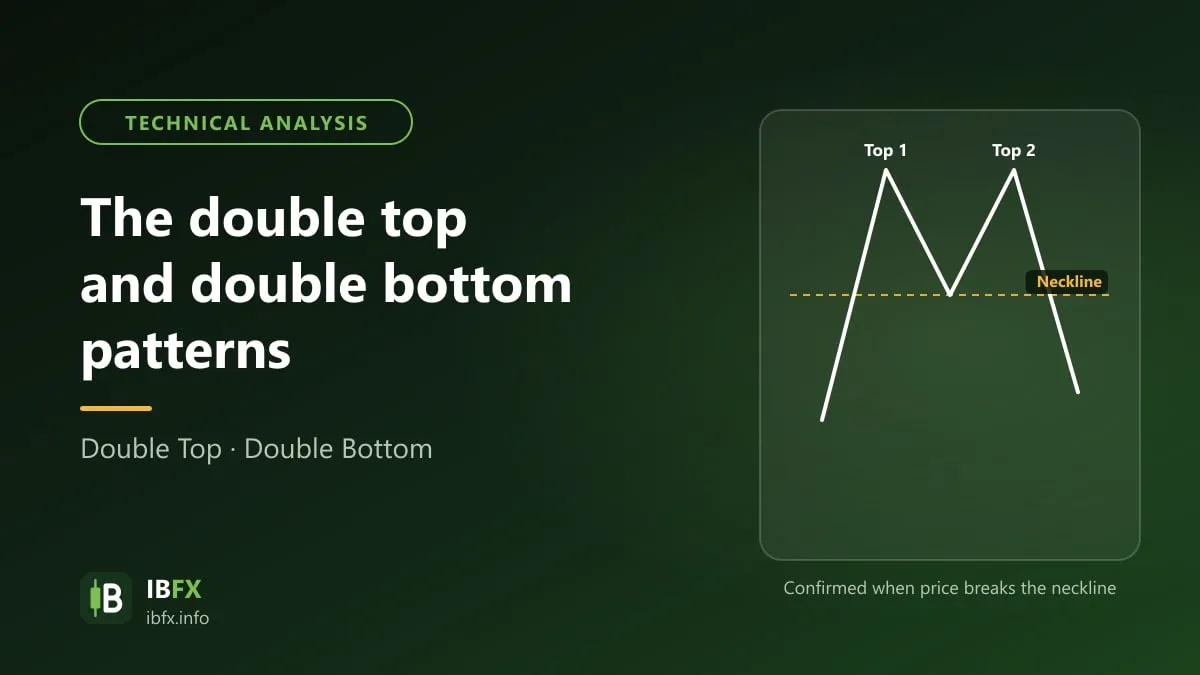
The double top and double bottom patterns

The double top and the double bottom are basic price patterns that turn up on the chart very often, but not every one of them is worth trading. What they are made of, how they are confirmed and how to enter…

Updated Sep 24, 2026

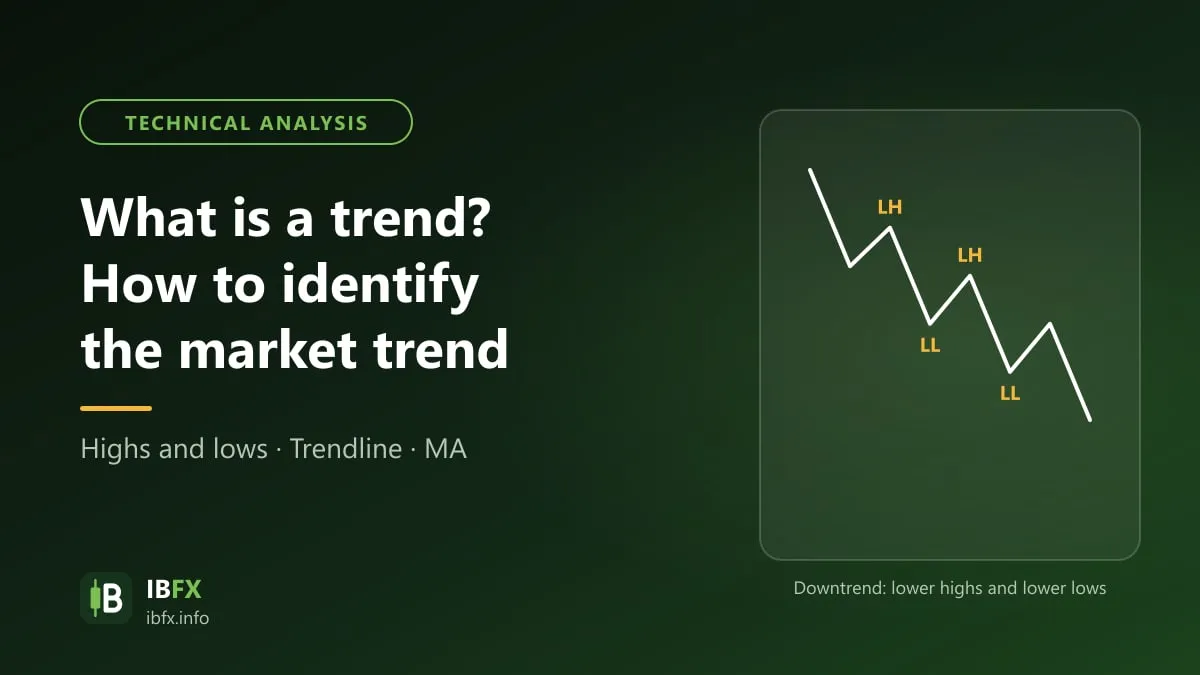
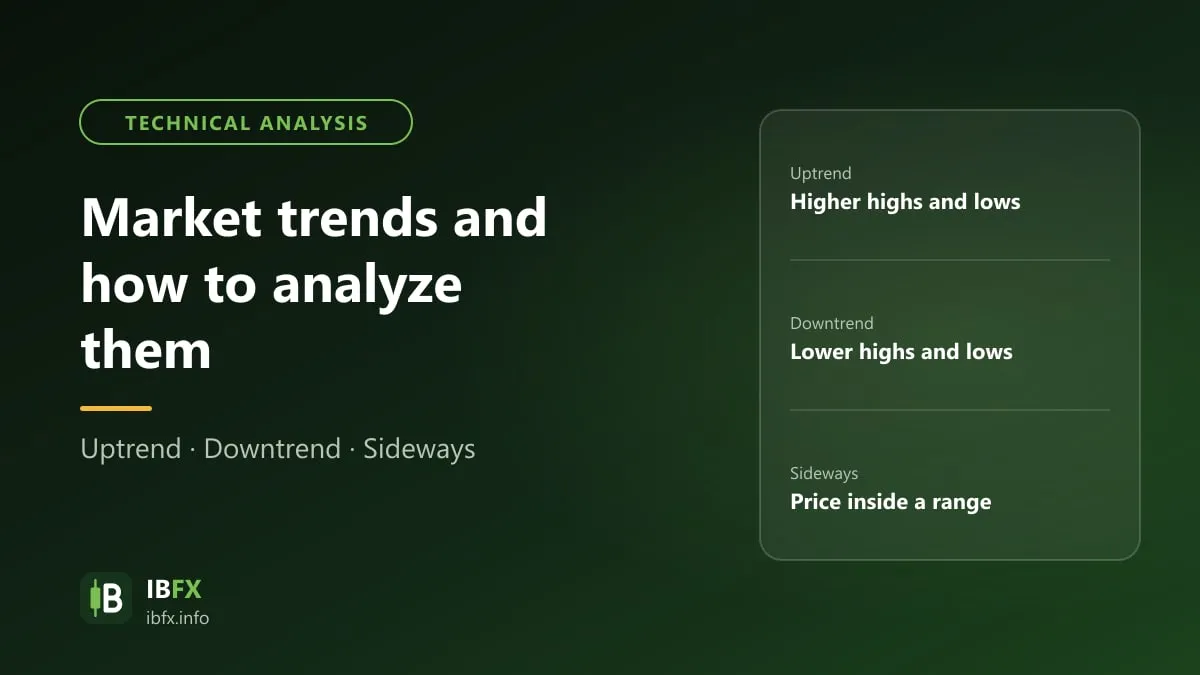
Market trends and how to analyze them

In trading, if you do not have a grip on the market trend, the chance of losing money is a great deal higher. Understanding it and applying it, though, is…

Updated Sep 24, 2026

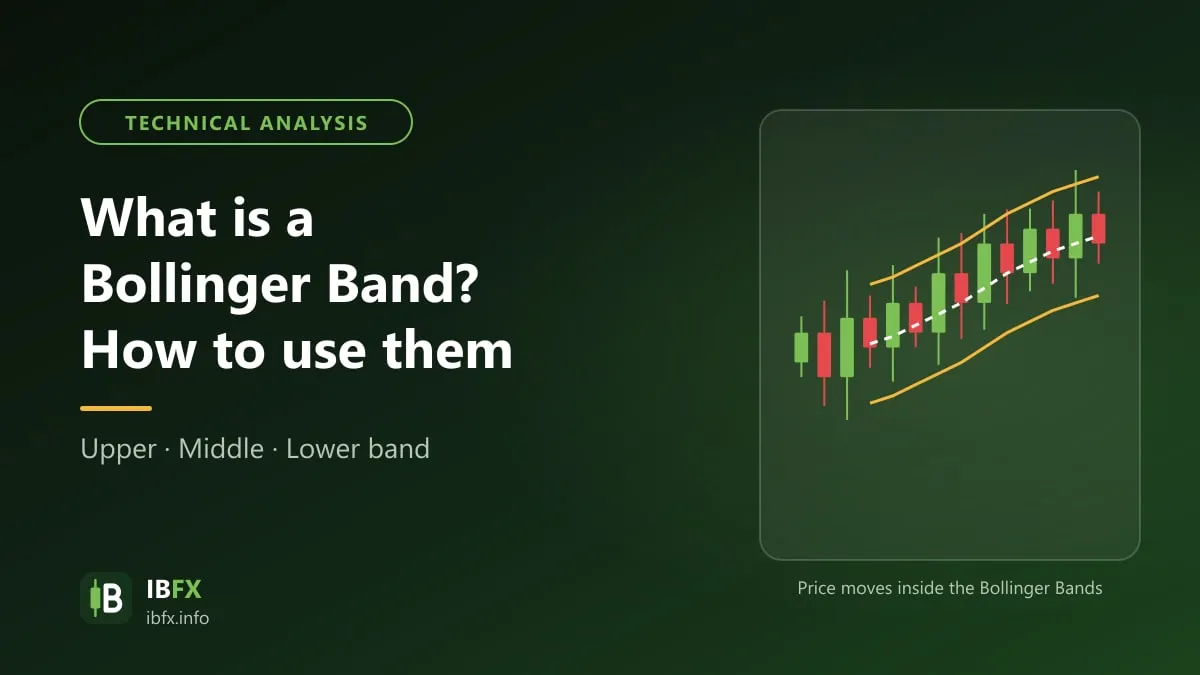
What is a Bollinger Band? How to use Bollinger Bands

Bollinger Bands is an indicator made of 3 bands built on a simple moving average and the standard deviation, which shows how much price is moving. This article covers the formula, how to set it up on MT4 and the common ways of trading it.

Updated Sep 24, 2026

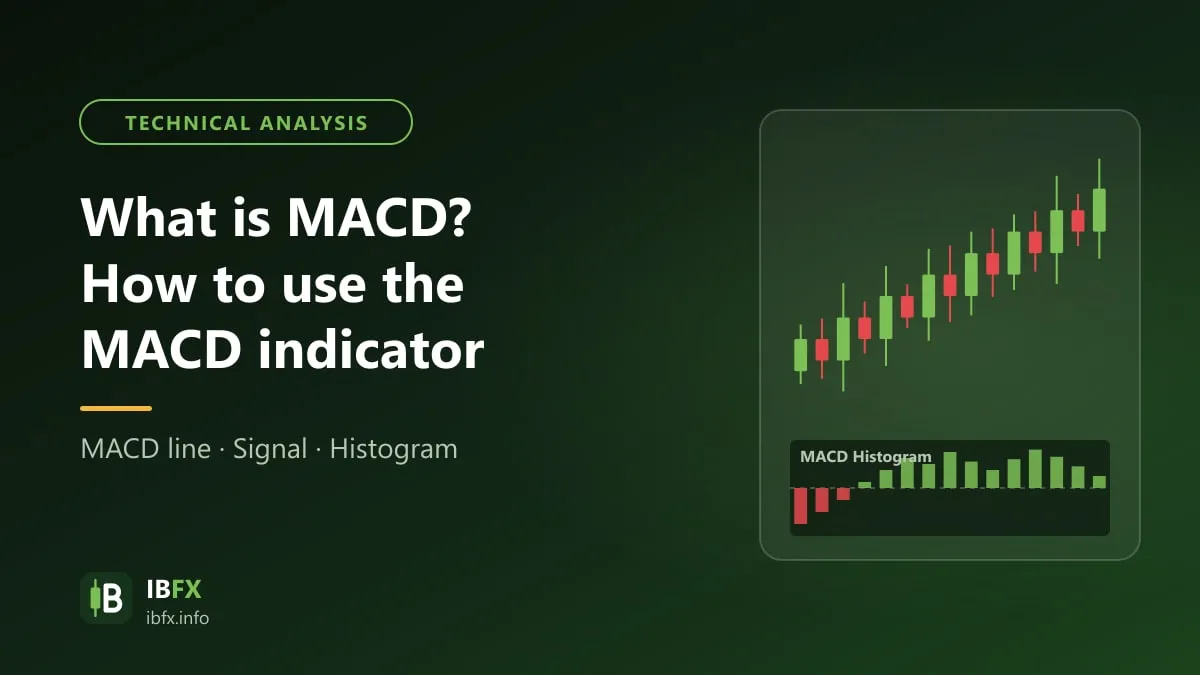
What is MACD? How to use the MACD indicator

MACD is a momentum indicator built on two EMA lines. This article explains its parts, the MACD formula, the signal line, the histogram and ways of trading MACD with the trend, divergence and candlestick patterns.

Updated Sep 24, 2026

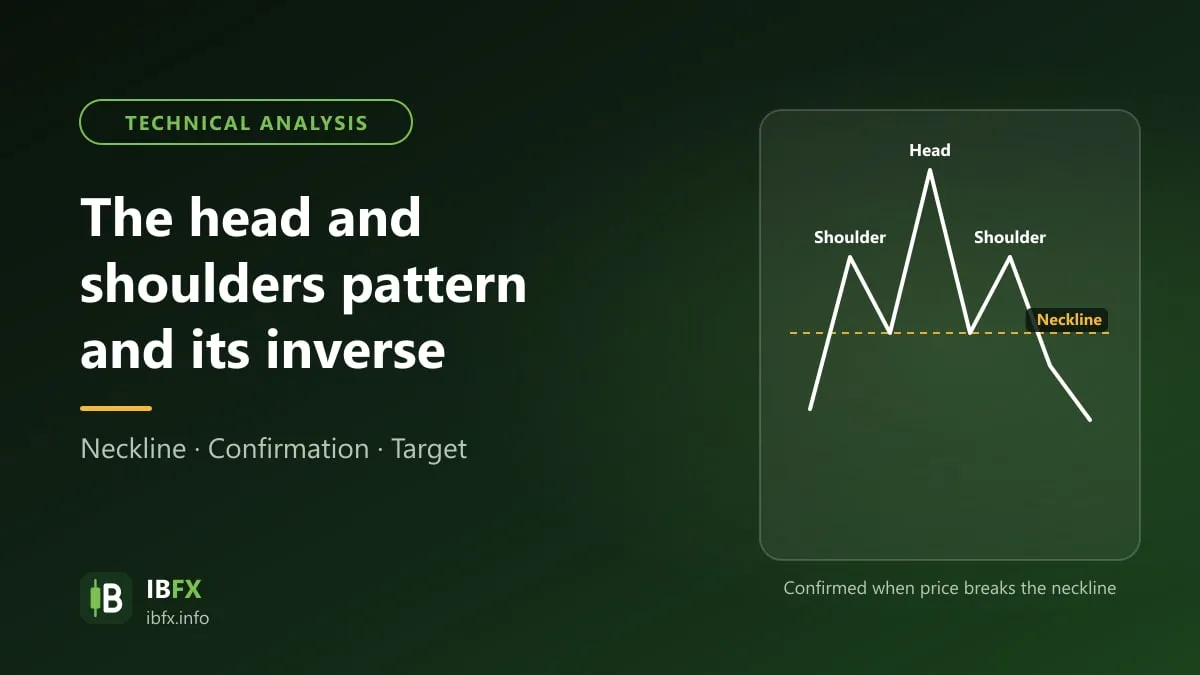
The head and shoulders pattern and its inverse

If you already understand Dow theory, the trendline, support and resistance lines and a few reversal candlestick patterns, this is also the moment when you can take one more step…

Updated Sep 24, 2026

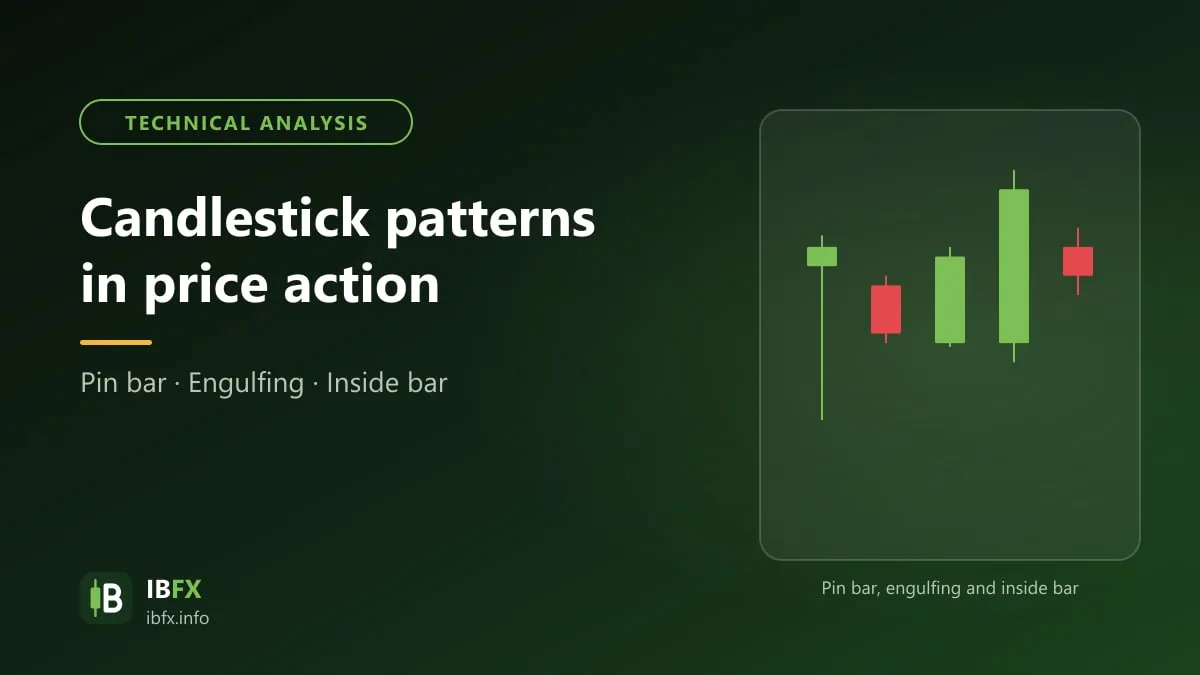
An introduction to candlestick patterns in price action

An introduction to reading Japanese candlesticks and the basic candlestick patterns of price action: Bullish Engulfing, Bearish Engulfing, Hammer, Morning Star, Dark Cloud Cover and Shooting Star, with notes on trading them.

Updated Sep 23, 2026

What is a fakey? How to trade the fakey pattern

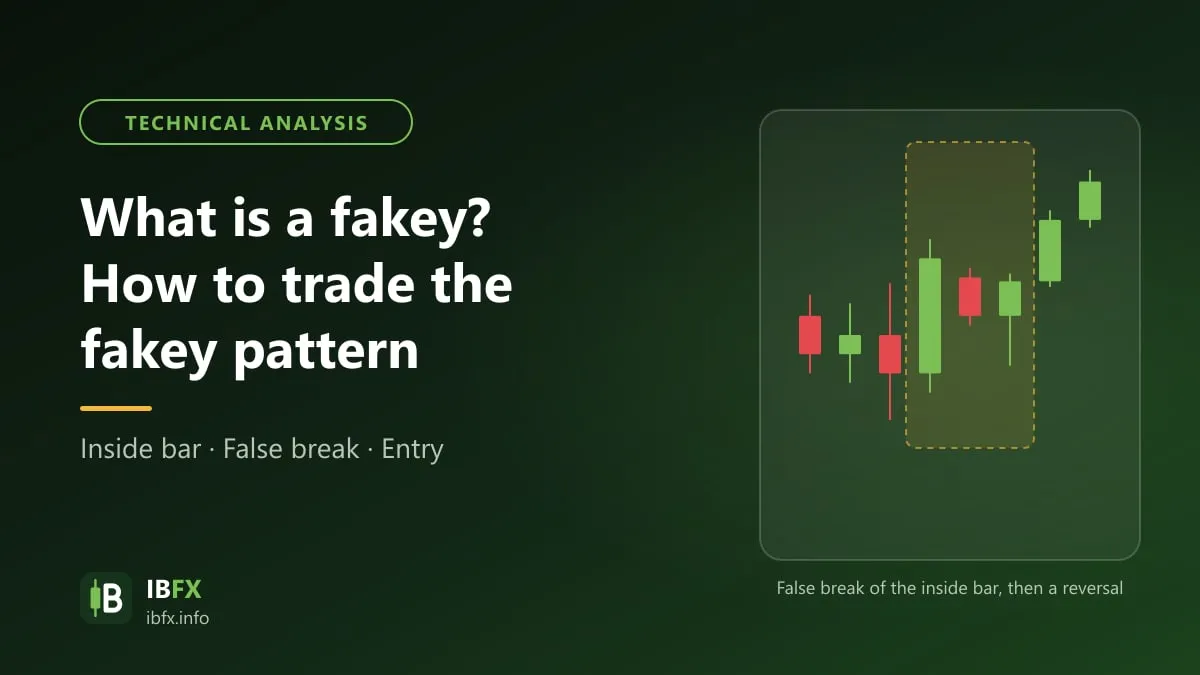
The fakey is a price action pattern that forms out of a false break from an inside bar. This article explains the structure of the fakey, how to read the bullish and bearish signals, how to enter, where to place the stop loss, and what to watch out for.

Updated Sep 23, 2026