On this page
Bullish Harami is one of the common bullish reversal patterns in financial markets such as stocks, foreign exchange and cryptocurrency; whatever the market, as long as it is driven by the relationship between supply and demand, this pattern can appear in it.
Although it is a reversal pattern, the Bullish Harami does not give as strong a reversal signal as many other candle patterns such as the Engulfing, the Hammer or the Morning/Evening Star. Even so, a great many investors and traders still like trading this pattern, by adding one or several signals from other tools to raise the chance of it working out.
In this article we will go through what marks out the Bullish Harami, how it is built and how to trade it in detail.
What is a Bullish Harami? What marks out the pattern
“Harami” in Japanese means “pregnant”, and the Bullish Harami pattern is also called the bullish “mother and baby” candle pattern. Naturally there is also a bearish “mother and baby” pattern, the Bearish Harami. In this article, though, we will keep to the Bullish Harami.
The Bullish Harami is a bullish reversal candle pattern, showing that the current downtrend is gradually weakening and that the market may reverse upward.
What marks out the Bullish Harami pattern
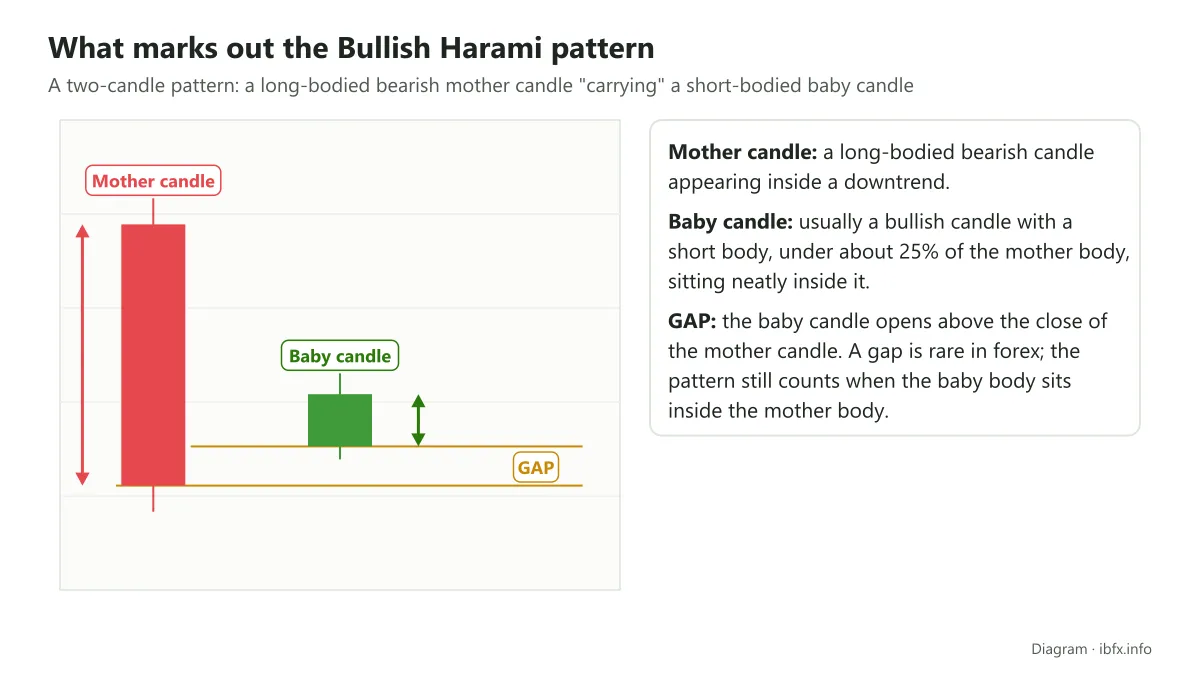
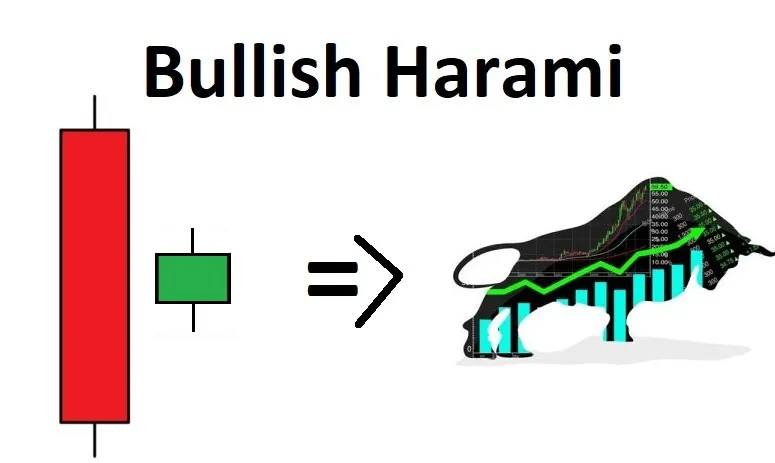
- The Bullish Harami is made of 2 candles: a long-bodied bearish candle (the mother candle) and a second candle with a short body (the baby candle). The baby candle is usually a bullish candle; some traders do not attach much weight to the color of the baby candle, but when it is a bullish candle the signal is seen as better. The body of the baby candle should be shorter than about 25% of the body of the mother candle.
- The body of the baby candle sits neatly inside the body of the mother candle; if the wicks of the baby candle sit inside the mother body as well, the pattern is clearer still.
- The baby candle opens above the close of the mother candle, creating a GAP. Note: this condition is mostly met in the stock market; in forex the next candle usually opens right at the close of the one before it, so a gap is rare, and the pattern still counts as long as the body of the baby candle sits inside the body of the mother candle.
The Bullish Harami Cross pattern
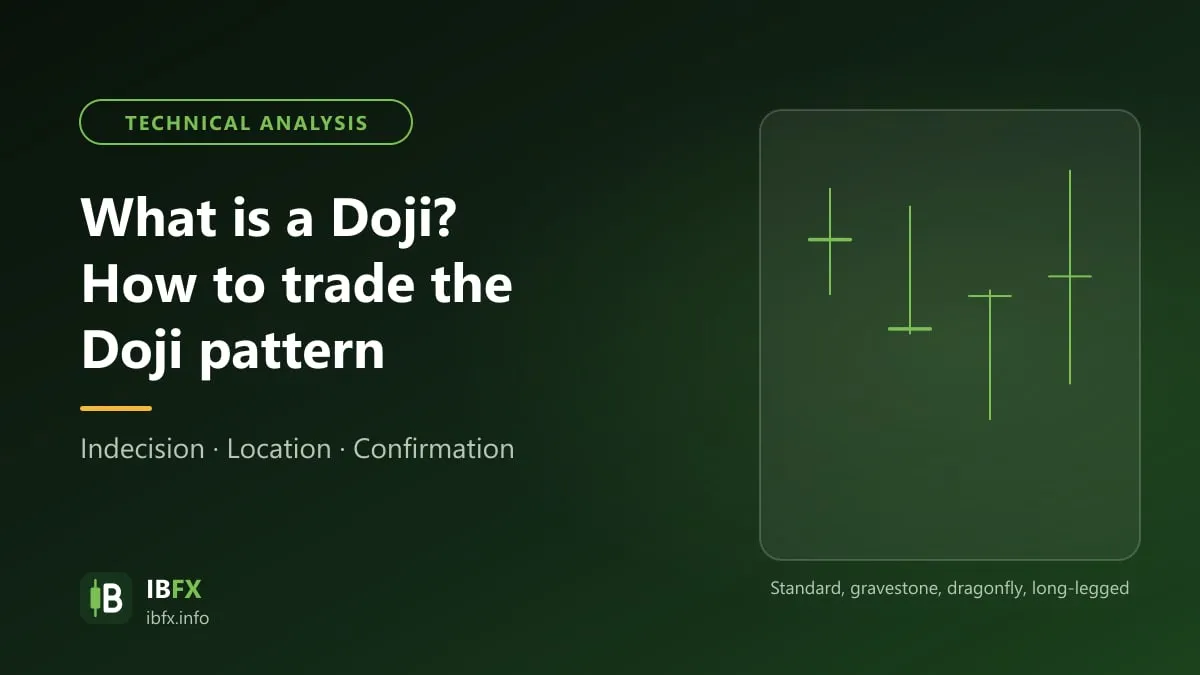
This is a variant of the basic Bullish Harami in which the baby candle is a Doji candle (a body as short as a single line, with short wicks). Many investors would rather see the Doji candle in this pattern, because a Doji standing there shows hesitation and a lack of conviction on both sides of the market.
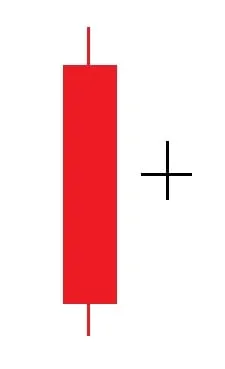
The color of the Doji candle does not matter, because a Doji appearing at the end of a downtrend already gives a possible bullish signal by itself.
The Bullish Harami and the Inside Bar
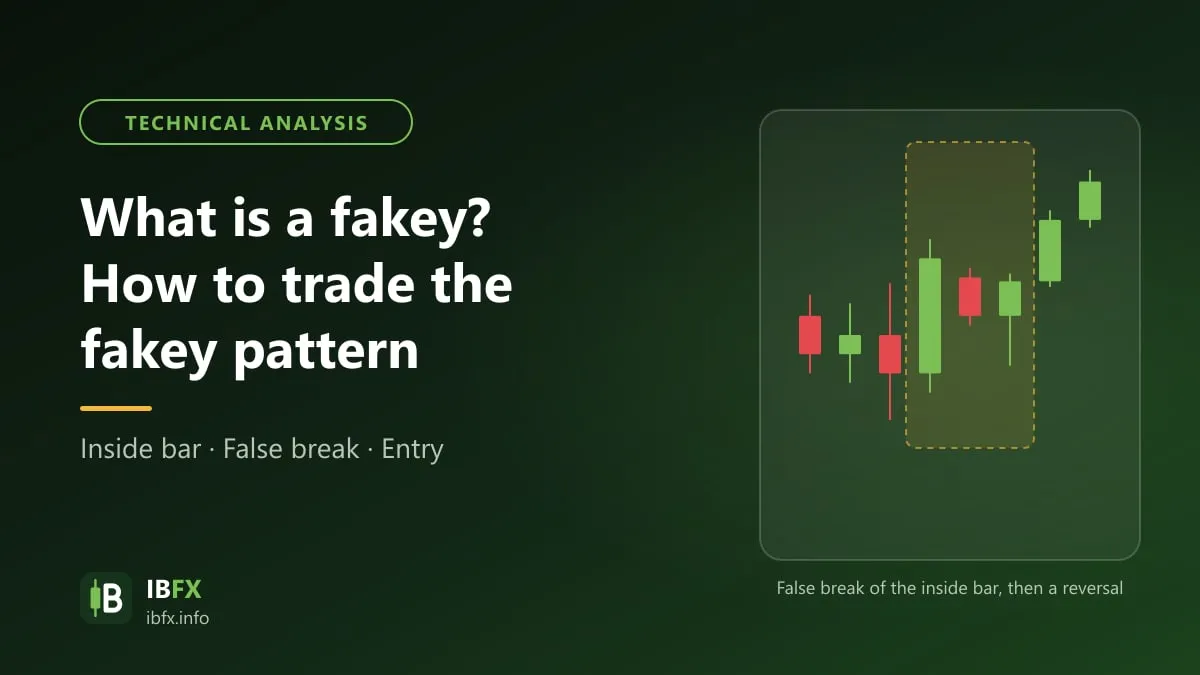
In the way it is built, the Bullish Harami is very much like the Inside Bar pattern, but there are a few differences: the Harami compares the candle bodies (the baby body sits inside the mother body), while the Inside Bar compares the whole candle (the high and the low of the baby candle sit within the price range of the mother candle); the baby candle of a Harami has to be very short, while the Inside Bar is not as strict about that; and an Inside Bar can take in several baby candles, while the Bullish Harami has only one.
When an Inside Bar pattern appears, an investor trades the direction in which the pattern breaks out, whereas with the Bullish Harami the bullish reversal trade is always the one that matters.
The Bullish Harami and the Pin Bar
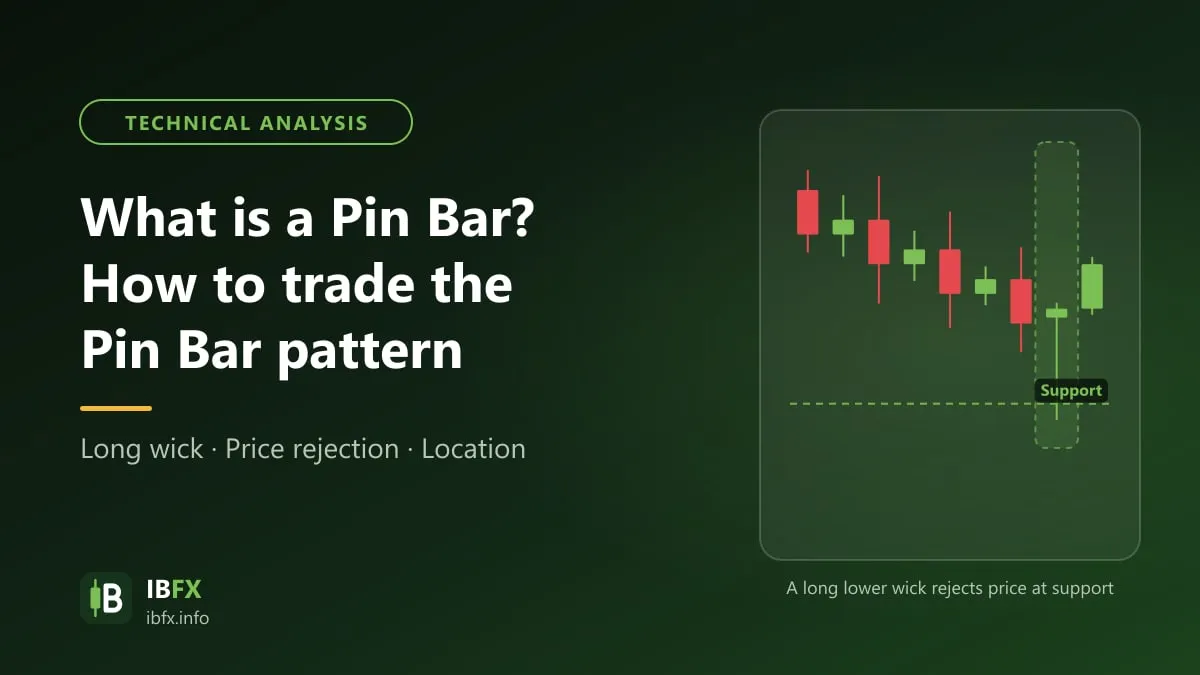
When you merge the 2 candles of a Bullish Harami into one trading session, you usually get a candle with a long lower wick, close to a Bullish Reversal Pin Bar (clearest when the baby candle sits in the upper half of the mother body).
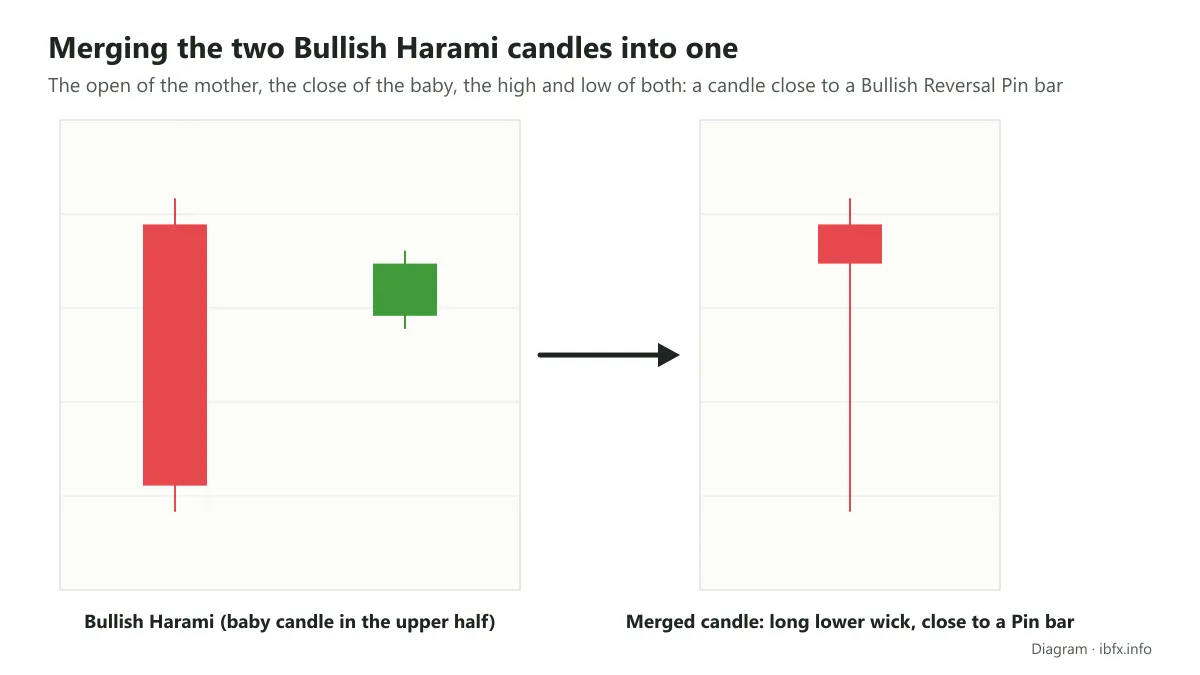
Traders clearly have grounds for treating the Bullish Harami as a bullish reversal pattern, because what happens across the 2 trading sessions of this pattern is close to a Bullish Reversal Pin Bar, itself a bullish reversal pattern watched by many traders.
Whether that combination produces a reliable and strong Bullish Reversal Pin Bar, though, depends on where the baby candle sits within the Bullish Harami pattern. The further up the mother body the baby candle sits, the longer the lower wick of the Pin Bar that comes out of it, and the stronger the bullish reversal signal of the pattern.
What the Bullish Harami pattern means
The Bullish Harami appears at the end of a downtrend, a sign that the falling pressure is gradually easing and that the market may reverse upward.
A bearish candle with a long body appearing inside a downtrend shows that the falling pressure is being reinforced. Right after it, though, a bullish candle appears (possibly with a price GAP), which shows buyers beginning to push back a little, while the short body shows the tug of war between the 2 sides, buyers and sellers, through the whole trading session. Sellers turn more cautious, because the downtrend has been running for a long stretch of time before this as well.
Even so, none of that makes it certain that price will reverse straight afterwards; traders usually wait for confirmation from the session that follows, after which price may reverse, or may start moving sideways into an accumulation phase.
How to trade the Bullish Harami pattern effectively
The main idea in trading the Bullish Harami candle pattern is to look for a chance to enter a Buy after this pattern has appeared inside a downtrend. You should keep in mind that you only trade once you have an extra signal confirming that price may rise (though nothing is certain), and not enter a Buy the moment you see a Bullish Harami appear, because the market may well form a period of accumulation, or even carry on with the downtrend rather than reversing upward. The chance of a bullish reversal is higher, but it is not 100% certain.
Trading the Bullish Harami pattern can run through these basic steps:
Step 1: Establish that the market is in a downtrend.
If you are trading on a short timeframe, that may be a stretch of downtrend inside a general downtrend, or a downward correction inside a general uptrend over the long term.
You can look at it with the naked eye and work out the trend from the structure and the behavior of price on the chart. If price keeps making lower highs and lower lows, the market is in a downtrend.
Step 2: Recognize the Bullish Harami candle pattern
If a bearish candle with a long body appears, what you are waiting for is the forming, right after it, of a slightly bullish candle or a Doji candle. That is the first requirement of a Bullish Harami pattern.
Next, if the following points are met, the pattern grows more reliable:
- The body of the baby candle is less than 25% of the length of the mother candle
- The whole of the baby candle sits neatly in the middle of the body of the mother candle
- There is a GAP between the 2 candles
Step 3: Look for a bullish reversal signal from other analysis tools
There are 3 common, easy-to-use tools and methods you can use to confirm a bullish reversal signal when the Bullish Harami candle pattern appears inside a downtrend: the RSI indicator, an important barrier (here a support zone) and the trend line of the downtrend.
- The Bullish Harami together with the RSI indicator
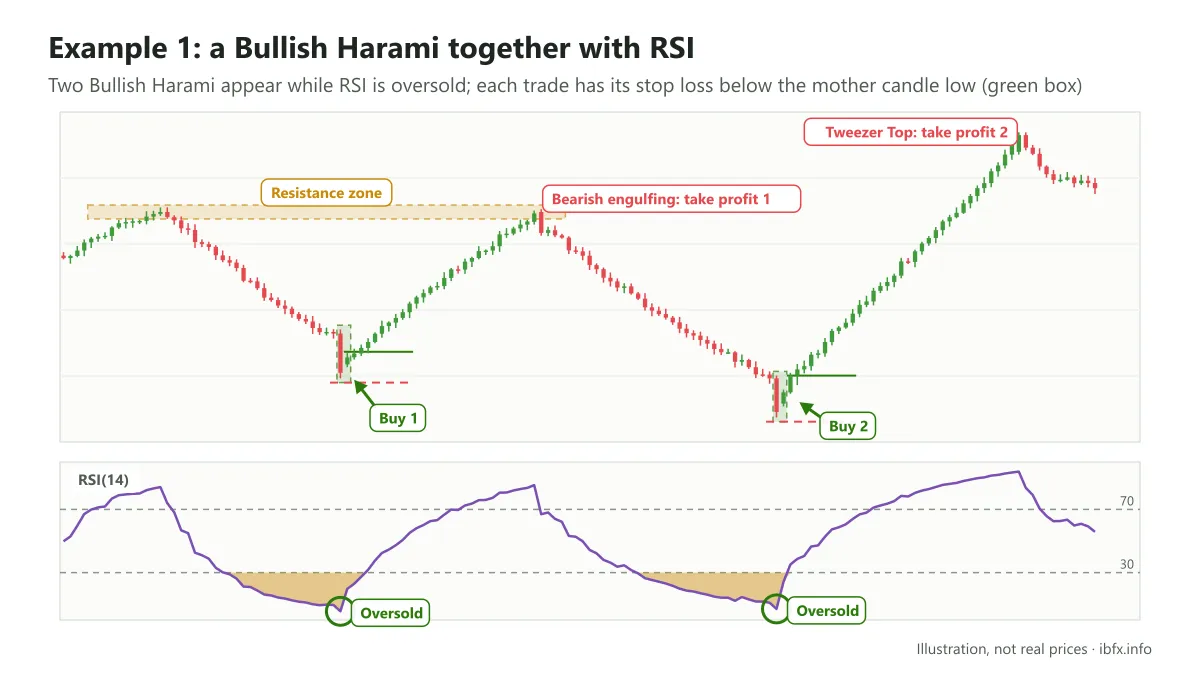
The RSI indicator has overbought and oversold areas which are often used to look for a possible reversal. When a Bullish Harami pattern appears and at the same moment RSI has dropped into the oversold area (below the 30 line) and is starting to turn back up, the bullish reversal signal gains extra weight. Note: in a strong downtrend, RSI can sit in the oversold area for a very long time while price keeps falling.
- The Bullish Harami together with a support zone
A support zone puts up a strong barrier (a strong support zone) when candles have touched that price area many times and turned back up (at least 2 times before this). So when the Bullish Harami pattern appears at a strong support zone, the chance of a bullish reversal in price is reinforced more strongly, and the chance of the trade working out is higher.
- The Bullish Harami together with the trend line of the downtrend
This method has a drawback against the 2 methods above, in that the confirming signal comes some time after the Bullish Harami has formed, rather than all but at the same moment as with the other 2.
When the Bullish Harami forms and price starts to rise, you can enter a Buy right at that point, because if you apply the Inside Bar pattern to this case, price has broken the Inside Bar pattern upward (breaking the high of the mother candle), which gives a trader a signal to enter a Buy. To be surer of it, though, you can wait for price to break the trend line of the downtrend properly; by then price has already reversed some way and the potential profit is smaller, but the chance of price carrying on upward is higher.
Step 4: Place the trade, enter, set the stop loss and the take profit
With each method used in step 3 you get a different entry point.
- Entry
The Bullish Harami together with RSI
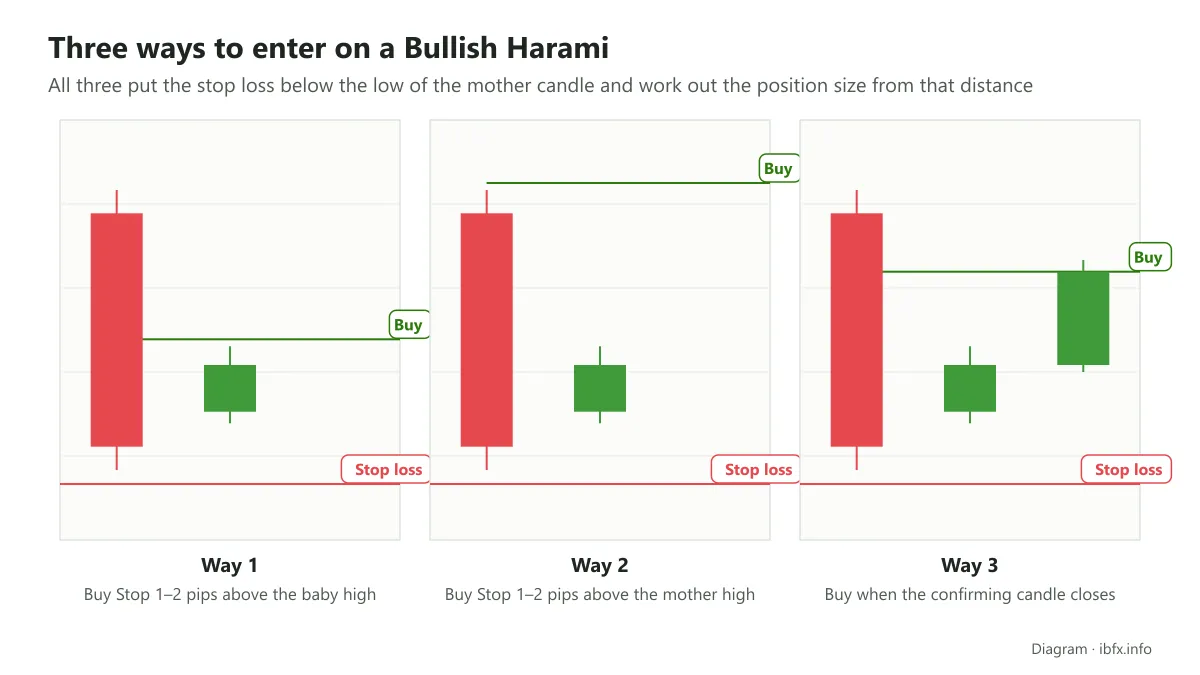
With this strategy there are 3 different ways to enter:
- Way 1: enter a Buy 1-2 pips above the high of the baby candle, which counts as one more confirmation of the signal that the market is heading up. If you enter a Buy as soon as the baby candle closes, the risk is higher, because the market may suddenly turn against you and carry on deeper down.
- Way 2: enter a Buy 1-2 pips above the high of the mother candle. This confirmation is somewhat surer, because by then not only does the market give a signal that it is heading up, but the Inside Bar pattern (the Bullish Harami has features in common with the Inside Bar) has been broken upward, so the bullish reversal signal is confirmed at a higher level.
- Way 3: right after the baby candle ends, if the market forms one more bullish candle, enter when that confirming bullish candle closes.
With ways 1 and 2 you can use a Buy Stop pending order to enter; with way 3 you use a market order and enter straight away.
The Bullish Harami together with a support zone
A Bullish Harami appearing at a strong support zone makes the bullish reversal signal more reliable; with this strategy you can enter as soon as the baby candle closes.
The Bullish Harami together with the trend line of the downtrend
In this strategy you use the signal of price breaking out of the trend line to enter. Enter a Buy as soon as the breakout bar closes.
- Stop loss
With all 3 strategies the sensible place for the stop is below the low of the mother candle. Because the mother candle is usually long, the distance to the stop loss can be quite far, so you have to work the position size out again so that the amount you can lose still stays within what you allow yourself (1-2% of the account, for instance).
- Take profit
If the Bullish Harami really does mark the start of an uptrend, the potential profit is fairly large and the take profit can be set further away. The financial markets, though, make nothing certain, so you should close the trade in one of the following ways:
- When a trend reversal signal appears: that signal may come from a bearish reversal candle pattern, from price breaking out of the trend line of the uptrend, from price reaching a strong resistance zone or from an overbought signal on the RSI indicator, and so on
- When you have reached your profit target
Examples of the Bullish Harami pattern in practice
Example 1: the Bullish Harami together with the RSI indicator
- Buy trade 1
The market is in a downtrend and a Bullish Harami pattern appears. This pattern is fairly reliable, because the body of the mother candle is very long, the short body of the baby candle meets the < 25% condition against the mother body, and it creates a GAP with the mother candle. At the same moment, on the indicator chart, RSI has dropped into the oversold area (down past the 30 level) and is starting to turn back inside. The signal that price may reverse upward is reinforced further.
In the picture we are entering by the first way, 1-2 pips above the high of the baby candle, with the stop loss just below the low of the mother candle.
After rising as expected, price starts moving into a strong resistance zone, the high of the downtrend before it, which gives a bearish reversal signal. You can close the trade as soon as price touches that resistance zone. This reversal signal is confirmed by a bearish engulfing pattern, a Bearish Engulfing, appearing right afterwards.
- Buy trade 2
In the same way, a Bullish Harami pattern appears inside a downtrend; although the body of the baby candle is a little long, longer than 25% of the mother candle, the GAP makes up for it by being wide enough for the pattern to be reliable. At the same moment, RSI has also dropped into the oversold area and is starting to head up.
This trade has its Buy entry set by the third way, entering after the confirming candle (the bullish candle right after the baby candle) has closed. The stop loss goes below the low of the mother candle.
In this situation you have 2 ways of taking profit. Either close the trade as soon as a bearish reversal pattern appears, here a Tweezer Top, or set the take profit target at the strong resistance zone formed just before it.
Example 2: the Bullish Harami with a strong support zone
A strong and reliable support zone is at times very hard to find on small timeframes, especially when the chart is zoomed in. For this strategy you should zoom the chart out to work out where the support zone lies.
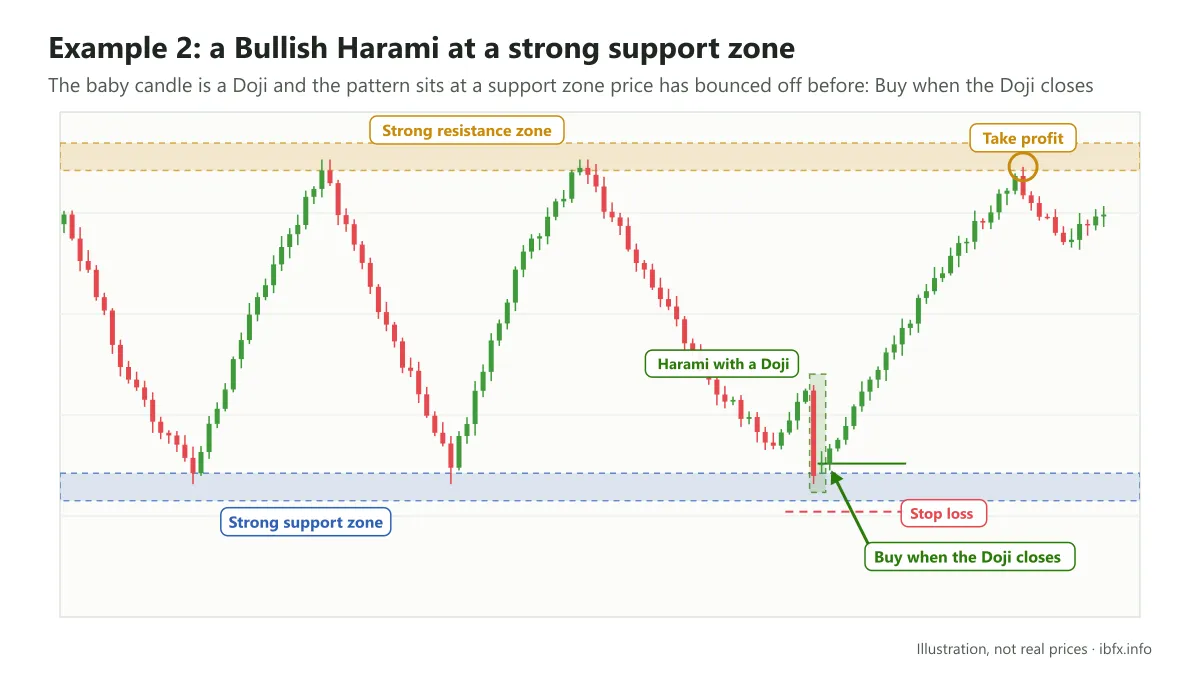
A Bullish Harami pattern whose baby candle is a Doji raises the chance of the trend reversing upward. This pattern also appears at an extremely strong support zone, because this is the price area at the low of a sharp downtrend before it, so the chance of a Buy trade working out is higher, though you still have to place a stop loss.
Enter a Buy as soon as the Doji candle ends. Put the stop loss below the low of the mother candle. In this situation you can set the take profit target at the nearest strong resistance zone.
Example 3: the Bullish Harami with the trend line of a downtrend
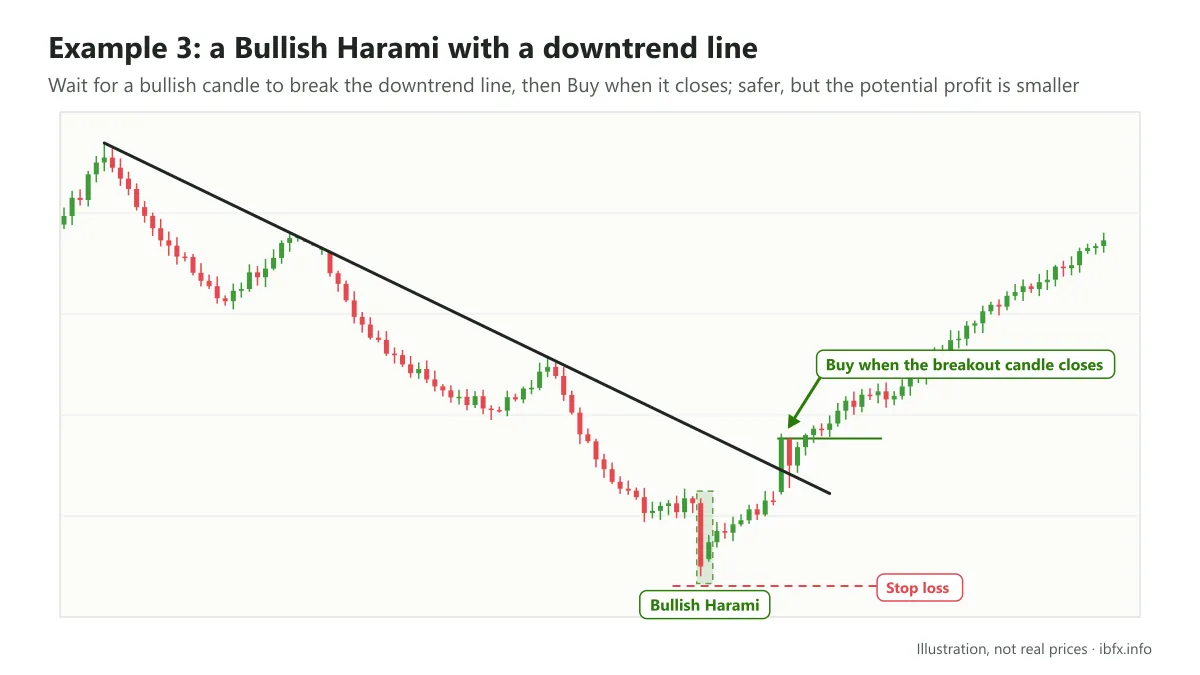
The Bullish Harami pattern appears inside a downtrend and meets the conditions that make the pattern reliable. After this pattern appeared, price rose and broke the high of the mother candle, and you can enter right at that point.
In this strategy, though, we wait for a breakout of the downtrend to be surer that price will not suddenly head back down. A bullish candle with quite a long body has broken the trend line of the downtrend; enter as soon as this candle closes. Put the stop loss below the low of the mother candle.
Of all the strategies, trading the Bullish Harami with a breakout of the downtrend line cuts part of the potential profit away, so traders usually pick the strategy that puts the pattern together with RSI or with a strong support zone rather than this one.
In closing
The Bullish Harami candle pattern on its own does not give a strong bullish reversal signal, but put together with other tools and methods the signal becomes more reliable.
As with any reversal candle pattern, strategies for trading the Bullish Harami do not work out every time; what matters is that you learn to filter out the noisy signals and always place a stop loss. Practice recognizing and trading the Bullish Harami pattern on a demo account before you use real money.