On this page
The idea of the Golden Cross in stock investing or in forex may still be unfamiliar to many traders, but in practice this signal comes up a great deal, especially when people talk about long-term moving averages.
So what is the Golden Cross? How do traders use the Golden Cross to trade a long-term trend? And is there a Golden Cross strategy for a new trader?
What is the Golden Cross?
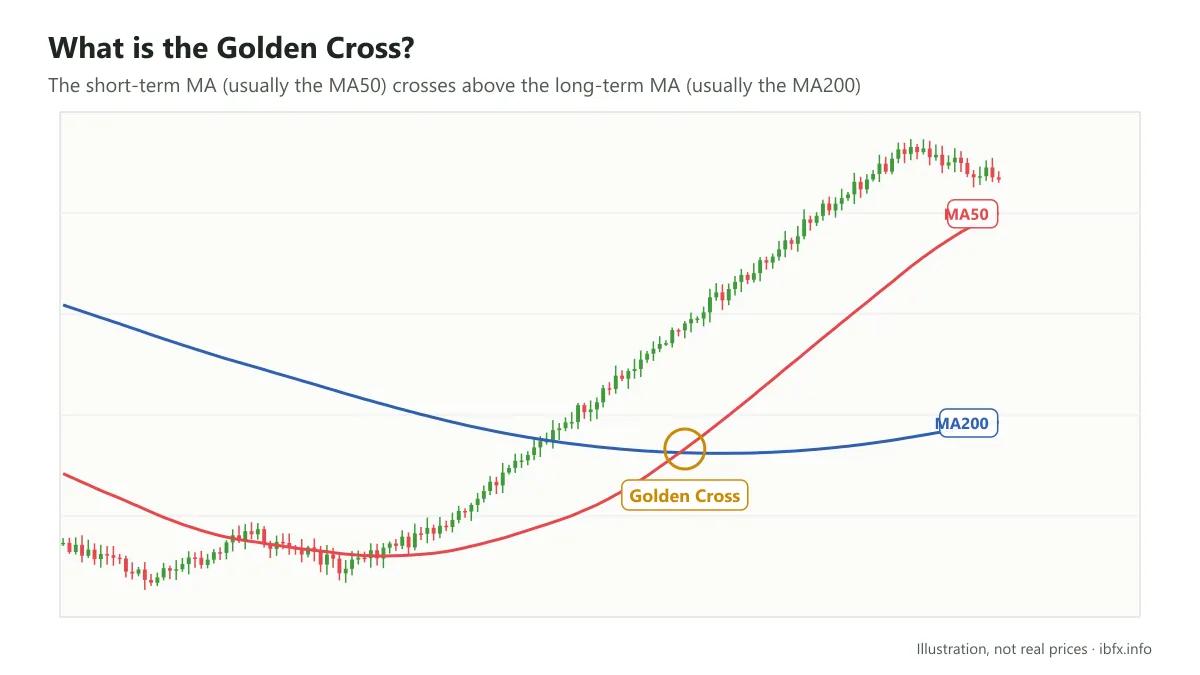
A cross in financial trading is the crossing of the parts of a technical indicator, used to produce a certain kind of trading signal.
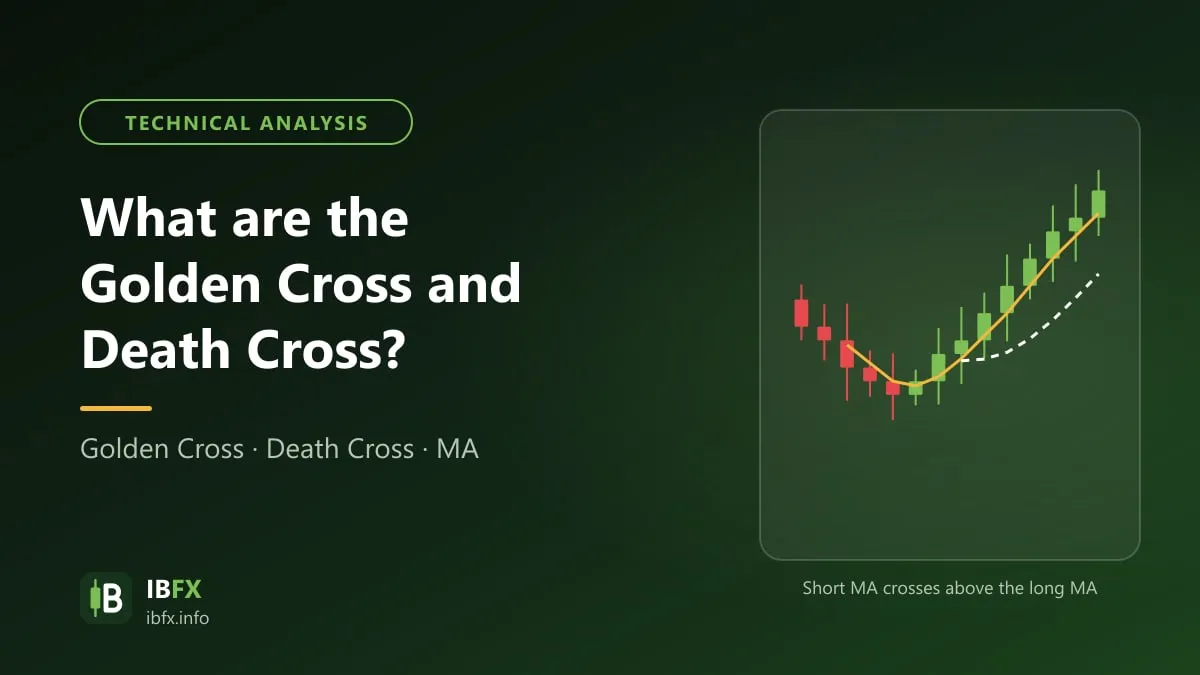
The Golden Cross is an upward crossing between 2 moving averages, most commonly the MA50 crossing above the MA200.
What signal does the Golden Cross give?
The Golden Cross is at bottom a crossing between 2 moving averages, so its signal also comes from the MA lines.
Because the MA belongs to the group of trend indicators, the Golden Cross is mainly used to confirm a long-term trend. Note that this is a lagging signal: by the time 2 long-term MA lines cross, price has usually already run a considerable stretch.
How does the Golden Cross work?
The Golden Cross works in the same way the MA lines work. Here the MA50 is the fast MA and the MA200 is the slow MA.
To understand the MA50 and the MA200 better, you should also read: What is a moving average?
While the market is in a long-term downtrend, the MA50 usually sits below the MA200. No downtrend lasts forever; when a new uptrend forms, the MA50 gradually rises and ends up above the MA200. The moment the MA50 crosses the MA200 from below is usually treated as a (late) confirmation that the market has turned from a downtrend into an uptrend.
Are the Golden Cross and the Death Cross the same thing?
Because it uses the crossing of 2 MA lines, there are 2 directions:
- If the MA50 crosses the MA200 from below, it is called a Golden Cross
- If the MA50 crosses the MA200 from above, it is called a Death Cross
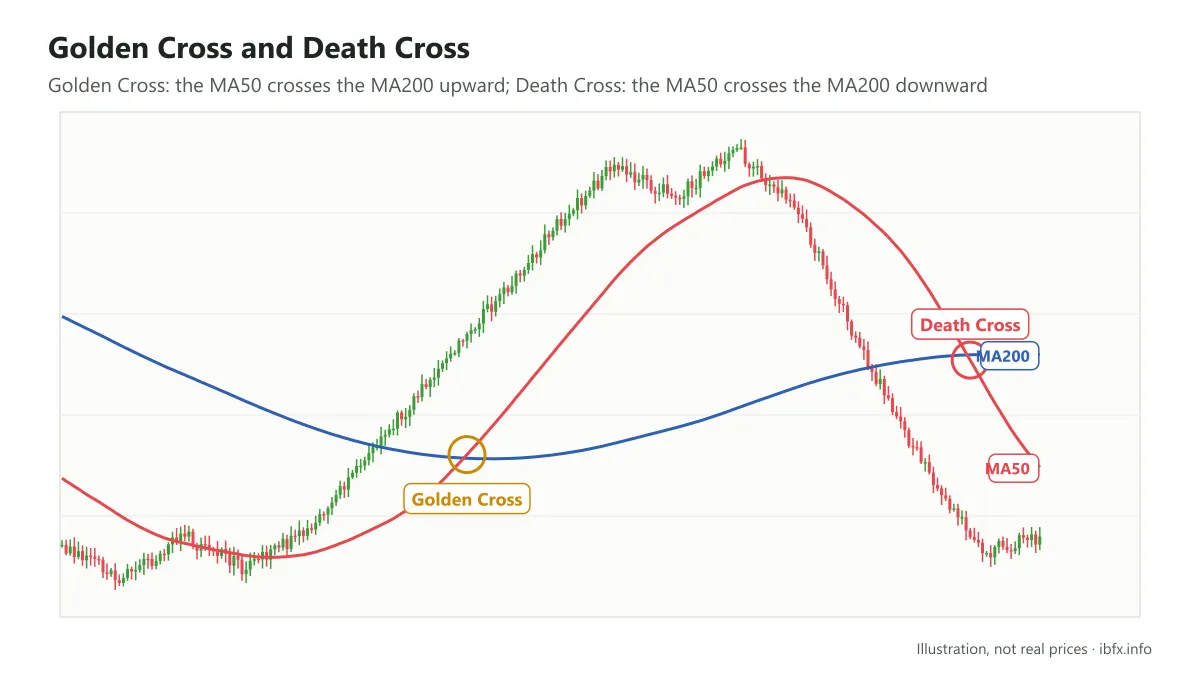
The term Golden Cross first appeared in the stock market, where most investors make money when prices rise, which is why the upward crossing is called the “golden” cross, and the downward crossing the “death” cross, since a falling market is what a stock investor does not want.
In forex trading, on the other hand, a trader can trade both directions, up and down (and both directions carry risk).
When a Golden Cross happens, a trend trader looks for a long-term Buy, because the Golden Cross suggests a long-term uptrend rather than a small move up in the short term.
The other way round, a Death Cross appearing is a signal for a trader to consider closing an earlier Buy position, or to look for a long-term Sell.
How is the Golden Cross used?
First, the settings used on the MA indicator.
Traditionally, the Golden Cross is worked out with the simple moving averages SMA 50 and SMA 200 on the daily chart; many traders also use the EMA.
In practice, either the EMA or the SMA will do. Both are used to work out the trend, and the biggest difference is that the EMA reacts faster than the SMA, so a Golden Cross on the EMA shows up earlier but also brings more noisy signals. Which one you pick depends on the trader’s taste and habit, as long as you use it consistently.
Why exactly the 50 and 200 periods?
They are not compulsory. The heart of the Golden Cross is the idea that a short-term average rises above a long-term average, showing that recent prices are strengthening against the long-term trend that came before. That said, 50 and 200 are the 2 most-watched periods, so their signal usually draws the attention of more people.
Second, the timeframe for trading the Golden Cross
The Golden Cross can appear on many different timeframes, from M15 and M30 through H1, H4 and D1… but its role as a long-term trend filter works best on D1. On a smaller timeframe the crossing signal is a great deal noisier.
Third, which assets the Golden Cross can be used on
The Golden Cross is used in many markets, such as stocks, crypto, foreign exchange and commodities, but how well it works differs by market and by period, and there is no assurance for every asset.
Fourth, how do you actually trade the Golden Cross?
Now that you know what the Golden Cross is, you may think all you have to do is Buy when the MA50 crosses the MA200 upward and Sell when the MA50 crosses the MA200 downward.
It is not that simple. Look at the price chart below:
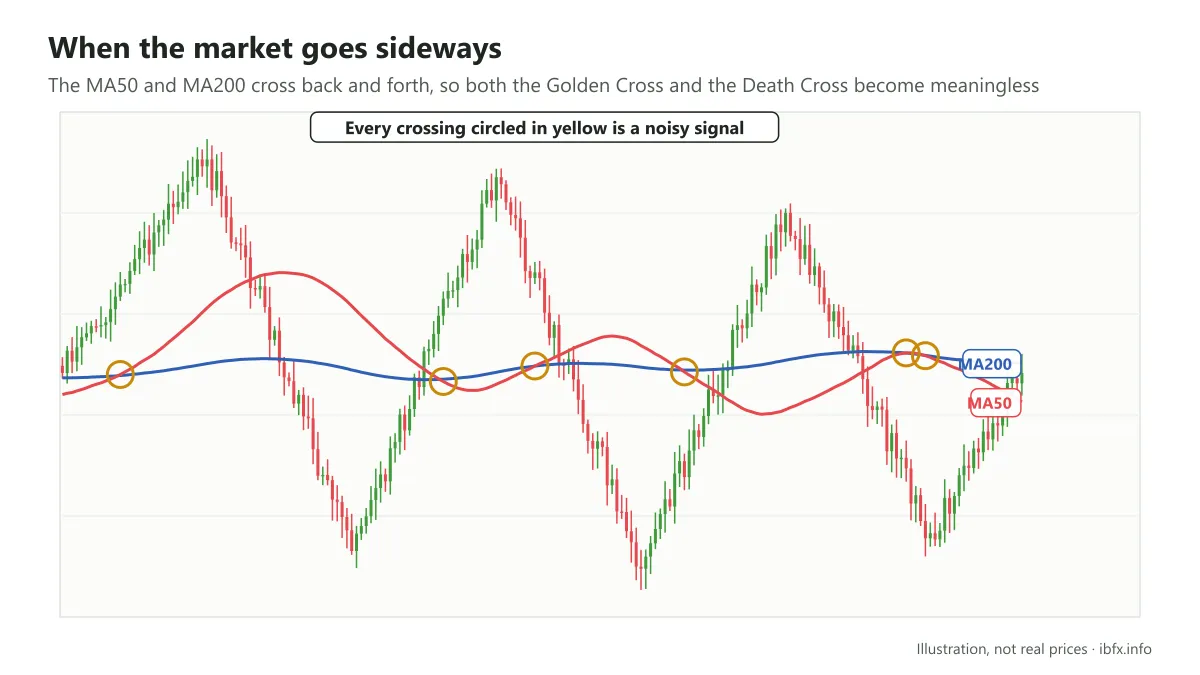
When the market goes sideways, the 2 MA lines cross back and forth again and again, so both the Golden Cross and the Death Cross become meaningless.
A long-term trading strategy with the Golden Cross
Because the Golden Cross works as a long-term trend filter, the most suitable way to use it is to trade with the trend. That means:
- After a Golden Cross appears (the MA50 crossing the MA200 from below) → the trader only considers Buy trades.
- After a Death Cross appears (the MA50 crossing the MA200 from above) → the trader only considers Sell trades.
As said, you should not buy the moment a Golden Cross appears or sell the moment a Death Cross happens; you should start looking for a trading signal once the crossing has taken place and the gap between the 2 MA lines begins to widen clearly.
After a Golden Cross or a Death Cross happens, we have 2 ways to trade:
- If an entry signal appears on the D1 timeframe (the timeframe where the Golden Cross or the Death Cross showed up) → enter on that timeframe.
- If not, look for an entry signal on a smaller timeframe such as H4 or H1.
Trading the pullback on D1
With the first way, we wait for a pullback toward the MA50, together with an overbought or oversold signal from an oscillator such as Stochastic, and enter when there is a sign that price has finished the pullback and is going on with the long-term trend. A reversal candlestick pattern appearing at the pullback is also a good confirmation.
Example:
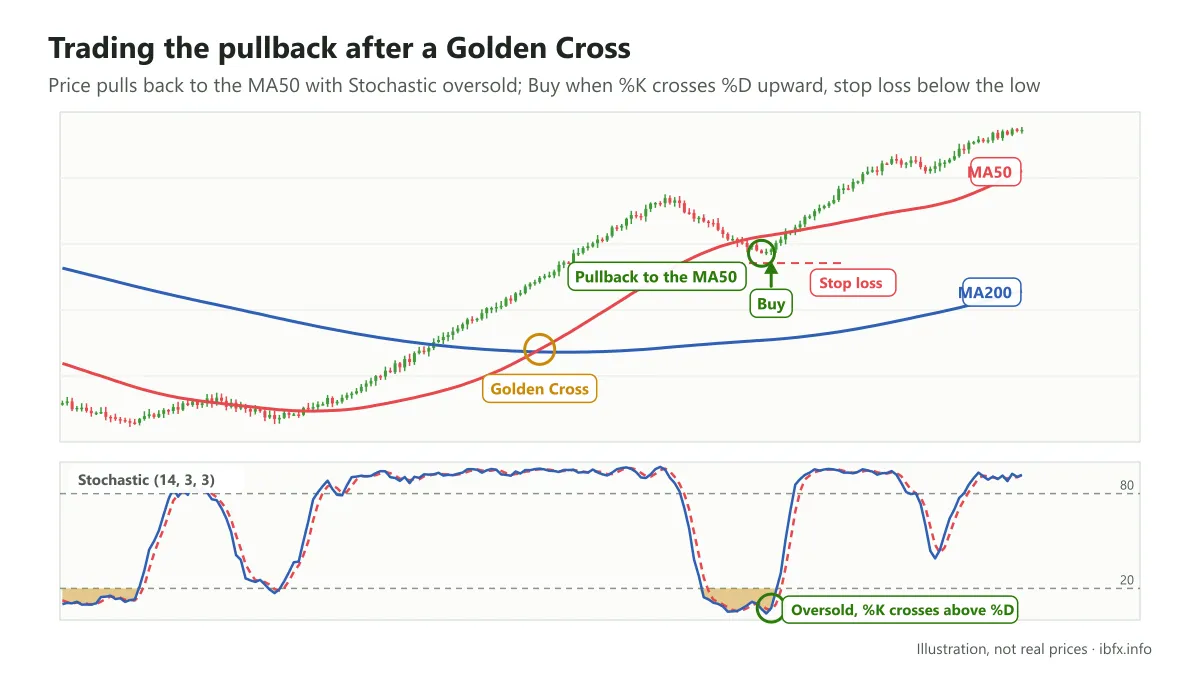
In this strategy we picked Stochastic because its overbought and oversold signals on D1 appear more often than those of the RSI, which suits looking for an entry inside a large trend.
After the Golden Cross appeared, price pulled back to the MA50; as price touched the MA50, Stochastic also fell into the oversold zone. Wait for the %K line to cross %D from below and then enter. Place the stop loss below the MA50 line or below the low of the pullback.
Example:
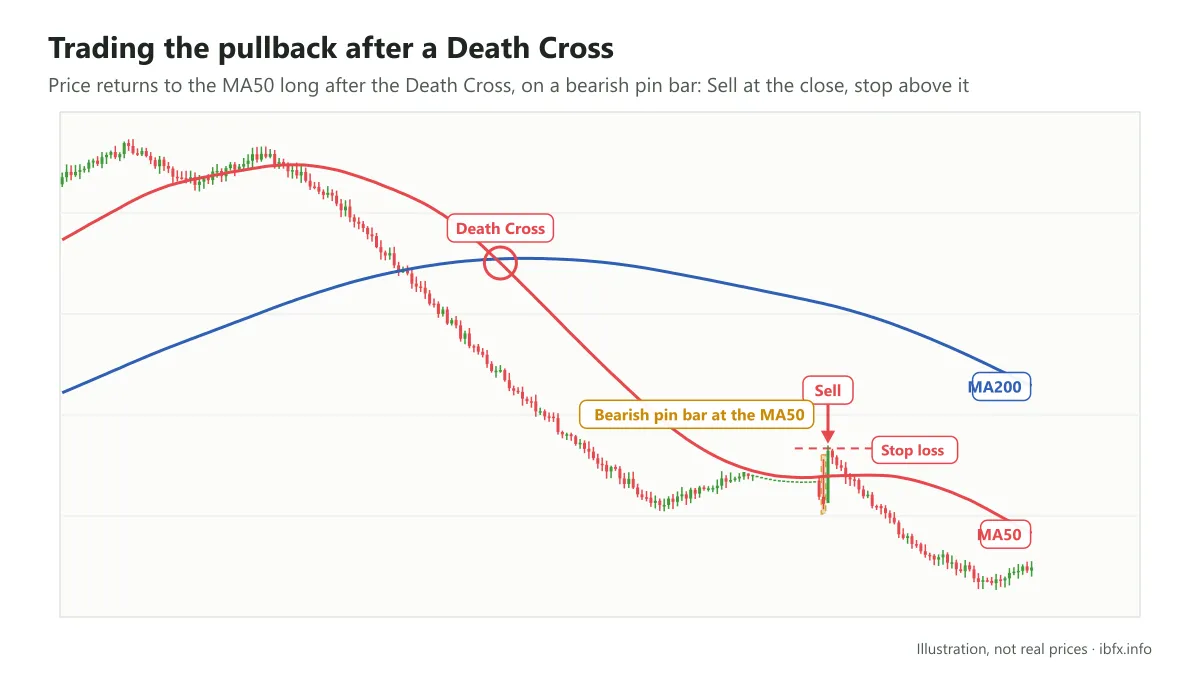
After the Death Cross happened, it was quite a long time before price pulled back to the MA50. In this case price touched the MA50 with a Bearish Reversal Pin bar; enter a Sell when that candle closes, and place the stop loss above the highest price of the Pin bar.
Multi-timeframe trading
With the second way, after a Golden Cross or a Death Cross happens you move to a smaller timeframe to look for an entry signal, usually based on chart patterns:
- If the Golden Cross happens on D1 → look for a price pattern that tends to break upward on a smaller timeframe such as H4 or H1.
- If the Death Cross happens on D1 → look for a price pattern that tends to break downward on a smaller timeframe such as H4 or H1.
Example:
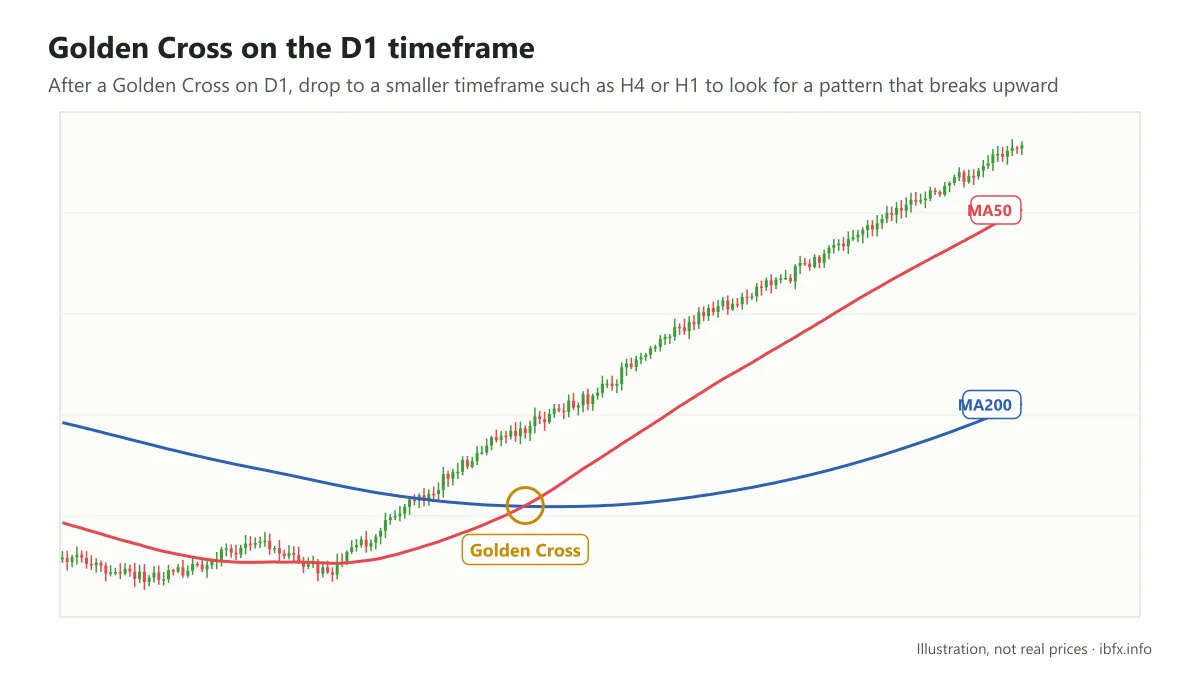
A Golden Cross appears on the D1 timeframe.
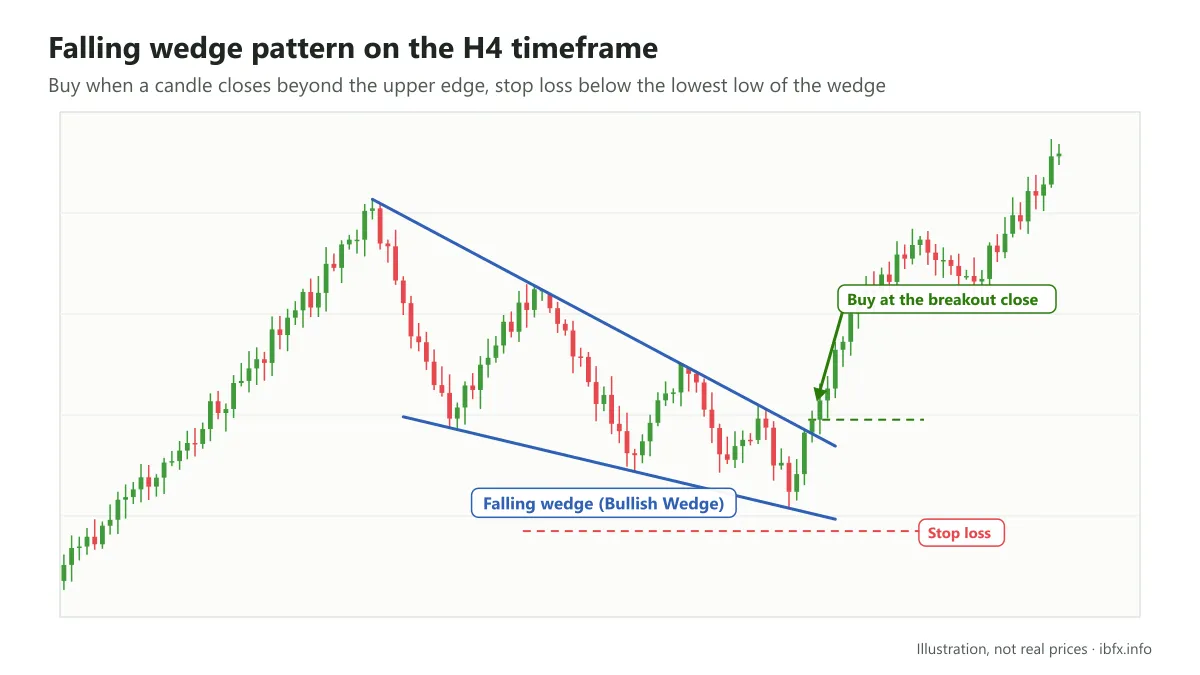
At the same time, a falling wedge forms on the H4 timeframe, a pattern that usually breaks to the upside.
Enter a Buy when price breaks the upper edge of the wedge (the entry price being the closing price of the breakout candle) and place the stop loss below the lowest price of the wedge.
As for taking profit, with a Golden Cross strategy many traders do not set a fixed take profit target, because that can cap the profit when the trend runs on. They use a trailing stop instead, moving the stop loss along with price to hold on to the profit already there, and close the trade when a reliable reversal signal appears.
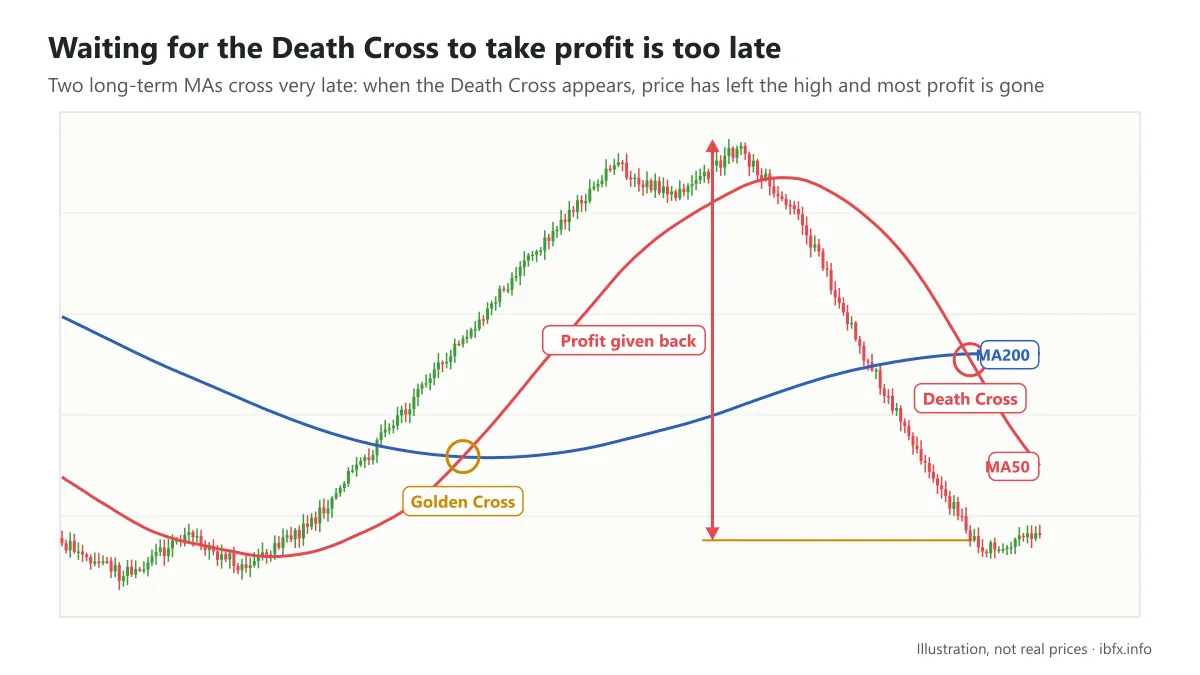
Why not use the opposite crossing as the take profit signal, that is, wait for the MA50 to cross the MA200 downward (for a trade taken on a Golden Cross) or for the MA50 to cross the MA200 upward (for a trade taken on a Death Cross) before closing the trade? Because the crossing signal between 2 long-term moving averages lags a great deal, and by then a large part of the profit may already be gone.
Example:
In our view, the pullback strategy on D1 has the drawback that the pullback can come when the trend has already been running for quite a while, so it is easy to miss most of the move; multi-timeframe trading, on the other hand, gives more chances to enter earlier.
So with a Golden Cross or a Death Cross, many traders give priority to multi-timeframe analysis and trading first, and only then to the pullback strategy.
Conclusion
A Golden Cross strategy is not too hard to carry out, but it mainly suits Position traders and Swing traders who hold a trade for many days. When you hold a trade over several days, you have to allow for the swap, which can cut the profit considerably or add to the loss.
The biggest limitation of this strategy is its lag and the great many false signals it gives while the market is sideways, while there is no way to know in advance whether the market is about to go sideways. So always place a stop loss, manage your money tightly, and practice on a demo account before you use it with real money.