On this page
When you look for trading strategies built on indicators, or on any other tool or method of analysis, most of what you find are medium or long term strategies; strategies made specifically for day traders are rare.
Plenty of people try to force those long term strategies into day trading or scalping by keeping every part of the setup and only changing the timeframe, and they usually do not get the result they hoped for. Each trading style only suits strategies that were designed for that style, that fit the trader’s personality, the return they are aiming for and how much risk they can accept. So there are 2 things a new trader needs to keep in mind:
- First, work out your trading style and build your own system and strategy to fit that style, using the knowledge you have picked up.
- Second, when you borrow someone else’s strategy, test it, get it wrong, and adjust it until it fits your overall trading system and becomes a strategy of your own that works.
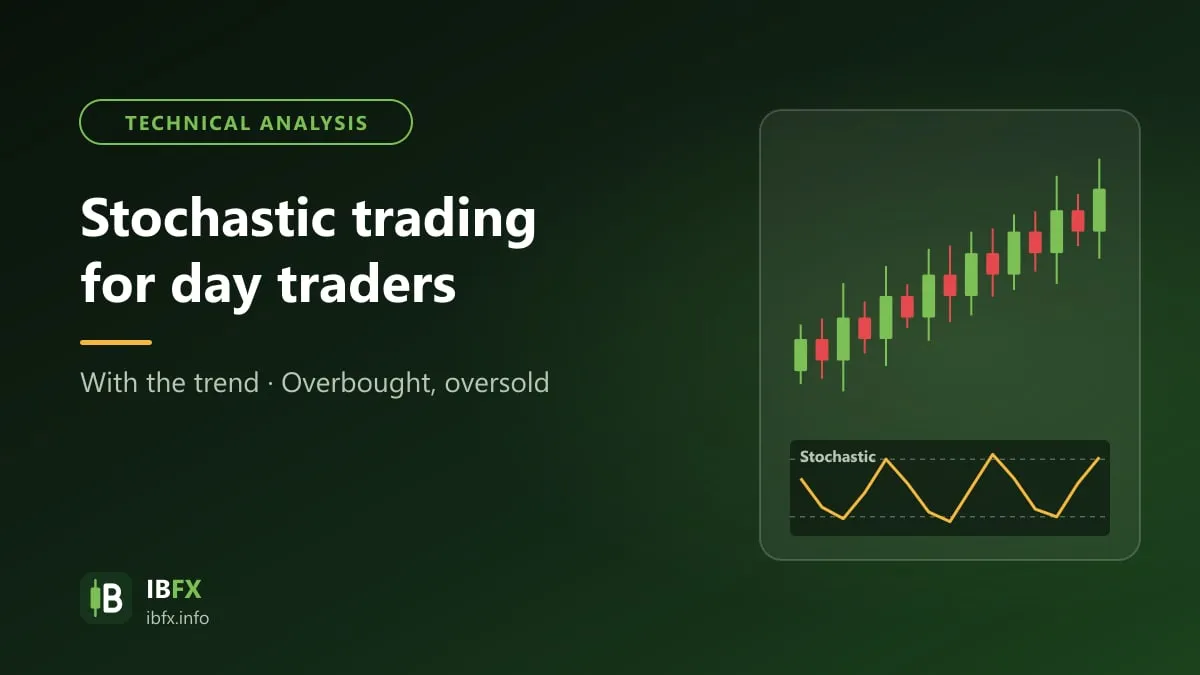
In this article we introduce one specific strategy for day traders: a strategy that uses the Stochastic indicator. Let’s take a look.
But before we get into the strategy and how to trade it, you need to understand the indicator you are going to use, or you can skip this part if you already know it.
What is the Stochastic indicator? The formula
Stochastic is a momentum indicator: it tells you whether the current strength of the trend is strong or weak, and it also helps a trader work out overbought or oversold conditions inside that trend.
Stochastic was developed by George C. Lane in the late 1950s, and the reason it is still around today is that the signals it produces still have value in a trader’s work.
Another indicator in the same family, working in a similar way to Stochastic, is RSI; but in day trading strategies many traders prefer Stochastic, because it compares the closing price with the recent high–low range and so reacts faster to short swings.
The Stochastic indicator has 2 parts: the %D line and the %K line
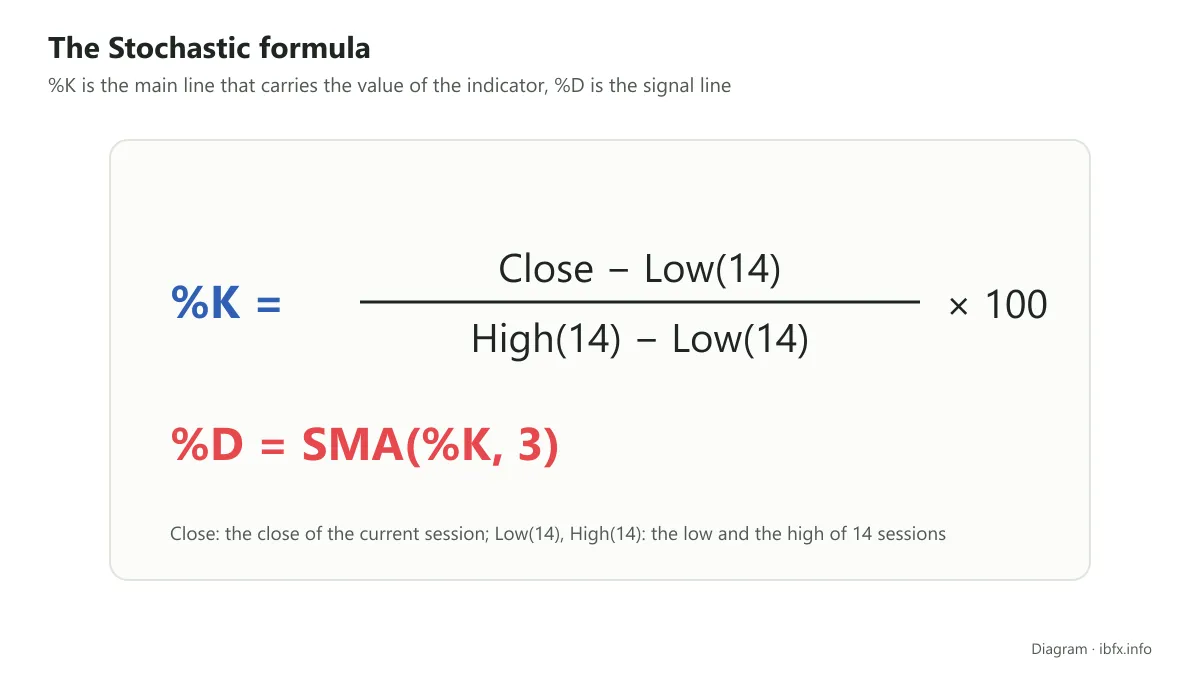
Where:
- Close: the closing price of the current trading session (the 14th session)
- Low (14): the lowest price of the 14 trading sessions
- High (14): the highest price of the 14 trading sessions
- SMA (%K, 3): the simple moving average of %K over a period of 3.
The %K line is the Main line, which carries the values of the indicator. The %D line is the Signal line.
What trading signals does Stochastic give?
This indicator gives as many as 3 different kinds of signal. Each one may be the best fit for a particular strategy, or a trader can combine them. But first, what are those 3 kinds of signal?
Overbought and oversold signals
When Stochastic moves into the overbought zone (above the 80 line) and starts to leave it, that is, when Stochastic crosses the 80 line from above, that is a sign the market may pull back down → consider a Sell.
When Stochastic drops into the oversold zone (below the 20 line) and starts to leave it, meaning this indicator crosses the 20 line from below, that is a sign the market may pull back up → consider a Buy.
Divergence and convergence signals
Divergence: in an uptrend price still makes a new higher high but Stochastic makes a new lower high, showing that the momentum of the trend is fading and the market may turn down → consider a Sell.
Convergence: the other way round, in a downtrend price still makes a new lower low but Stochastic makes a higher low, showing that the strength of the downtrend has faded and the market may turn up → consider a Buy.
Crossover signals between the 2 lines %K and %D
The %K line crosses above the %D line → short term momentum turns up → consider a Buy.
The %K line crosses below the %D line → short term momentum turns down → consider a Sell.
To understand these kinds of signal in detail, as well as what Stochastic means, you can read the article: What is the Stochastic indicator? How to trade Stochastic
A Stochastic trading strategy for day traders
First of all, you have to be clear about the day trading style: are you really following it, and does it really suit you? This question matters a great deal.
Day trading is a short term style, trading within the day: the trader uses small moves to try to make money, and every position is closed the same day, nothing is held overnight.
And a strategy run in the day trading style has to have a setup that matches those features.
The setup of the Stochastic strategy
-
Analysis tool used: the Stochastic indicator and nothing else
-
Trading timeframe: M15 (15 minutes)
-
The settings of the Stochastic indicator:
-
The %K line: period 14
-
The %D line: period 3, simple moving average (SMA) method
This is a strategy that trades with the rhythm of the higher timeframe, which means you have to work out the direction of momentum on the higher timeframe (D1) before you move down to the M15 timeframe to enter.
Note: on M15 the spread is a sizeable share of the stop loss, so trade currency pairs with a low spread, stay out around major news releases, and risk only a small part of the account (1%, for example) on each trade.
The steps of the strategy:
Applied to a BUY trade
Step 1: Check the trading conditions on the D1 timeframe
- The Stochastic indicator is below the 20 line, or is moving into the oversold zone
- The %K line crosses above the %D line
The first condition shows the market has fallen into an oversold state → an upward pullback is possible.
The second condition: when %K crosses above %D, the market is giving a signal that it is turning from down to up.
The first condition can be looser, though: Stochastic does not have to be below the 20 line, and at the present moment it may already be above that level, as long as it has not gone past the 50 level.
Step 2: Set the trading conditions on the M15 timeframe
On the M15 timeframe, wait for Stochastic to drop below the 20 line and for the %K line to cross above the %D line.
The conditions in this step are exactly the same as in step 1, only they are read on the M15 timeframe.
Normally, if those 2 conditions happen, we could enter a Buy right away; but as you know, the market can stay inside the overbought or oversold zone for a very long time before it pulls back, and if it drags on, our short term trades turn against us. So, to really work out whether Stochastic is leaving the oversold zone, this strategy needs one more condition.
Step 3: The condition that confirms the market is really pulling back up
It is simple: wait for Stochastic, specifically the %K line (because the %D line follows close behind), to cross above the 20 level. At that point the indicator has left the oversold zone and price may rise.
Step 4: Add a Swing Low as a condition confirming that price will rise.
Once the Stochastic conditions have been met, we need one more confirming signal from price itself, and that is the Swing Low; finding the Swing Low gives the trade a better entry.
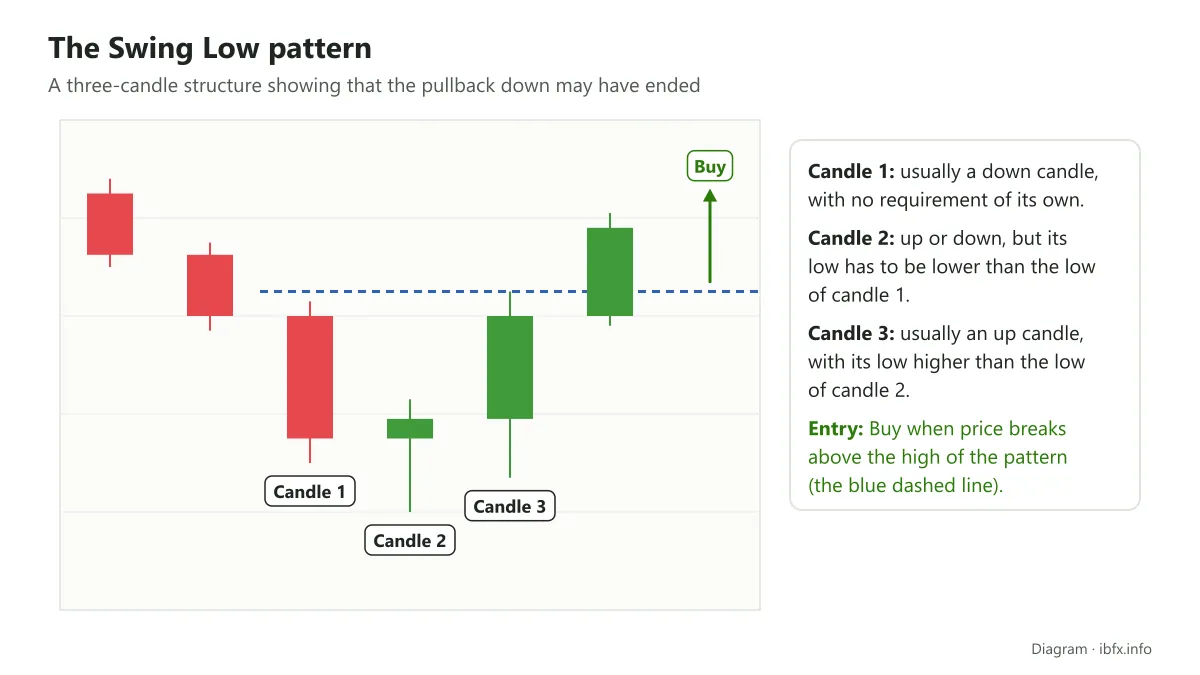
A Swing Low forms when the market finishes a downward pullback and goes back to the uptrend.
A typical Swing Low has a structure of 3 candles:
- The first candle is usually a down candle, and there is no specific requirement for this candle.
- The second candle can be up or down, but its lowest price has to be lower than the lowest price of candle 1.
- The third candle is usually an up candle, with the lowest price of this candle higher than the lowest price of candle 2.
Step 5: Work out when to enter
Once the Swing Low has formed, wait for price to break out above the highest price of the Swing Low and enter a Buy right away.
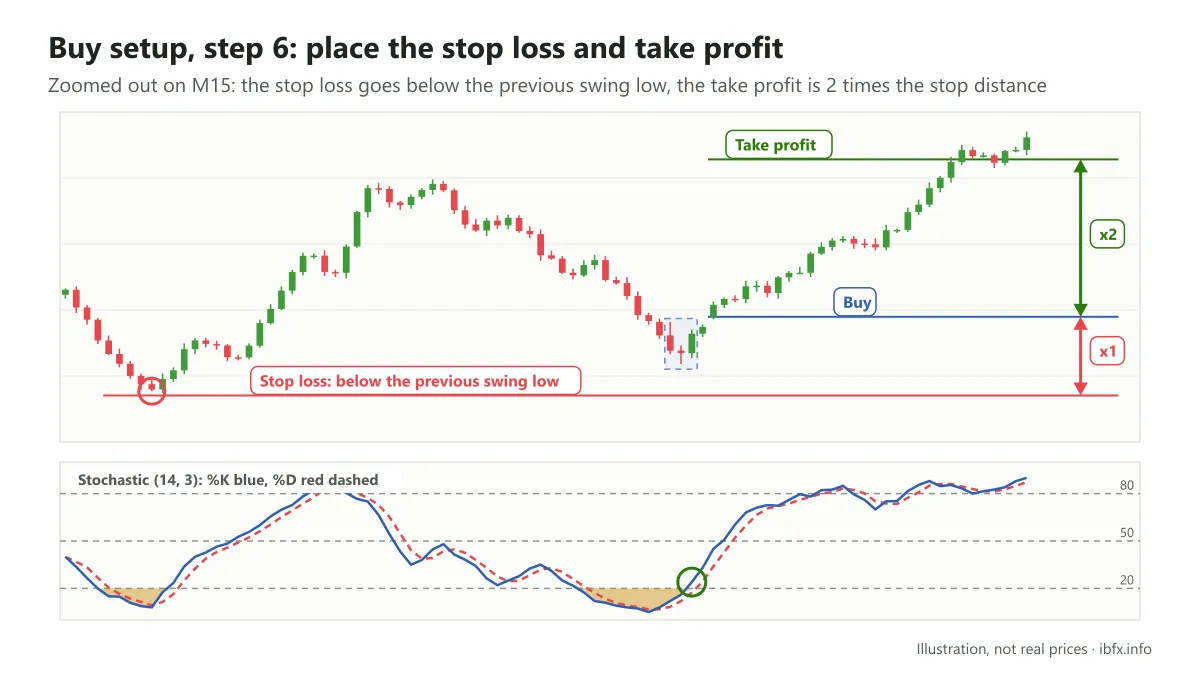
Step 6: Place the stop loss and take profit
The stop loss goes just below the nearest Swing Low before it.
With this strategy you can set the take profit target at 2 times the stop loss. Because this is day trading, if price has still not reached the target or the stop by the end of the day, consider closing the trade, in line with the rule of not holding a position overnight.
The strategy in short
Even though there are as many as 6 steps, everything happens very quickly while you are trading on the price chart. We can boil those 6 steps down to these main points:
- First, on the D1 timeframe Stochastic has to be below the 20 level, or it may already be above it as long as it has not gone past the 50 level, and the %K line crosses above the %D line.
- Second, on the M15 timeframe Stochastic has to be below the 20 level, the %K line crosses above the %D line, and you wait for the %K line to cross above the 20 level.
- Third, wait for the Swing Low pattern to appear
- Fourth, enter a Buy when the highest price of the Swing Low is broken, place the stop loss just below the nearest Swing Low before it, take profit target = 2 times the stop loss.
For a SELL trade you do the same thing the other way round, specifically
- First, on the D1 timeframe Stochastic has to be above the 80 level, or it may already be below it as long as it has not gone past the 50 level, and the %K line crosses below the %D line.
- Second, on the M15 timeframe Stochastic has to be above the 80 level, the %K line crosses below the %D line, and you wait for the %K line to cross below the 80 level.
- Third, wait for the Swing High pattern to appear
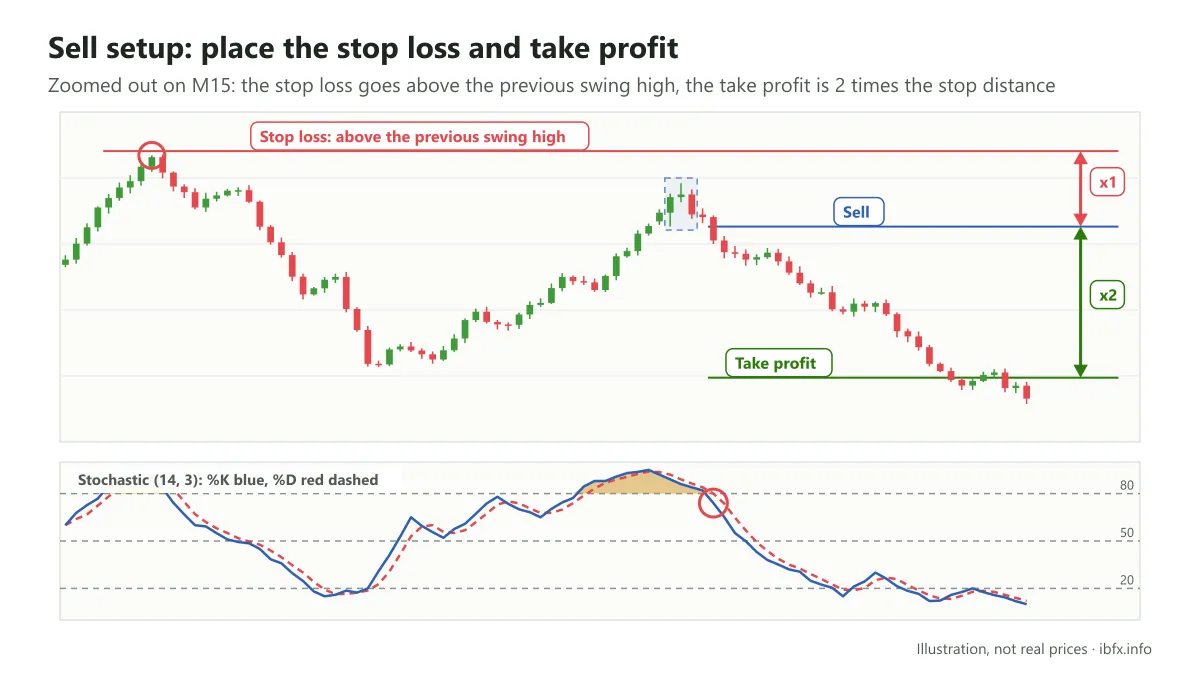
- Fourth, enter a Sell when the lowest price of the Swing High is broken, place the stop loss just above the nearest Swing High before it, take profit target = 2 times the stop loss.
A worked example of the Stochastic strategy for day traders
Example 1: a Buy trade
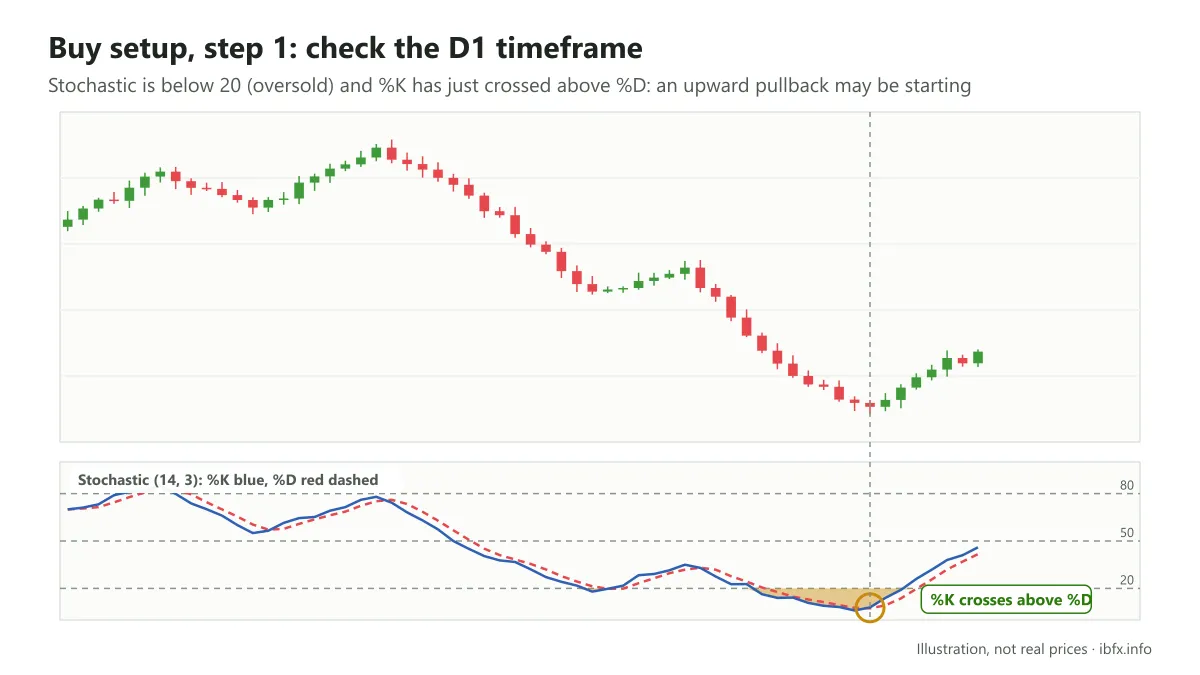
On the D1 timeframe Stochastic is below the 20 level → the market has fallen into the oversold zone, and at the same time the %K line has crossed above the %D line → a signal that the market may be starting an upward pullback.
Next, move to the M15 timeframe to look for a trading opportunity.
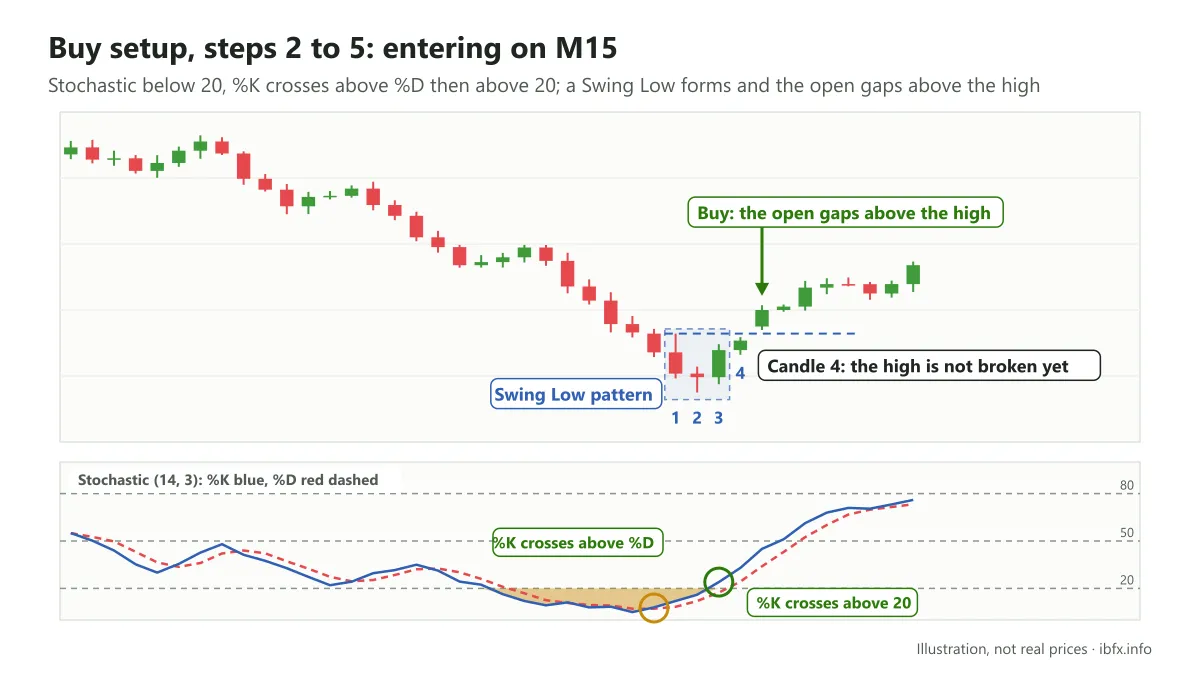
On the M15 timeframe Stochastic is below the 20 level as well → the market has fallen into the oversold zone, and at the same time the %K line has crossed above the %D line → a signal that the market may be starting an upward pullback.
By the time %K crosses above the 20 level, a Swing Low pattern has also formed on the price chart; at that point, though, the candle that follows has still not broken the highest price of the pattern (it has only broken the highest price of the 3rd candle). Keep waiting for the signal of price breaking out above the highest price of the Swing Low pattern before you enter.
At the start of the next trading session the market gaps up and the opening price of that session breaks the Swing Low pattern, so you can enter around that opening price (note that when there is a gap, the fill price can differ from what you expected).
To place the stop loss and take profit you need to zoom out on the M15 price chart to work out where the nearest Swing Low is.
Example 2: a Sell trade
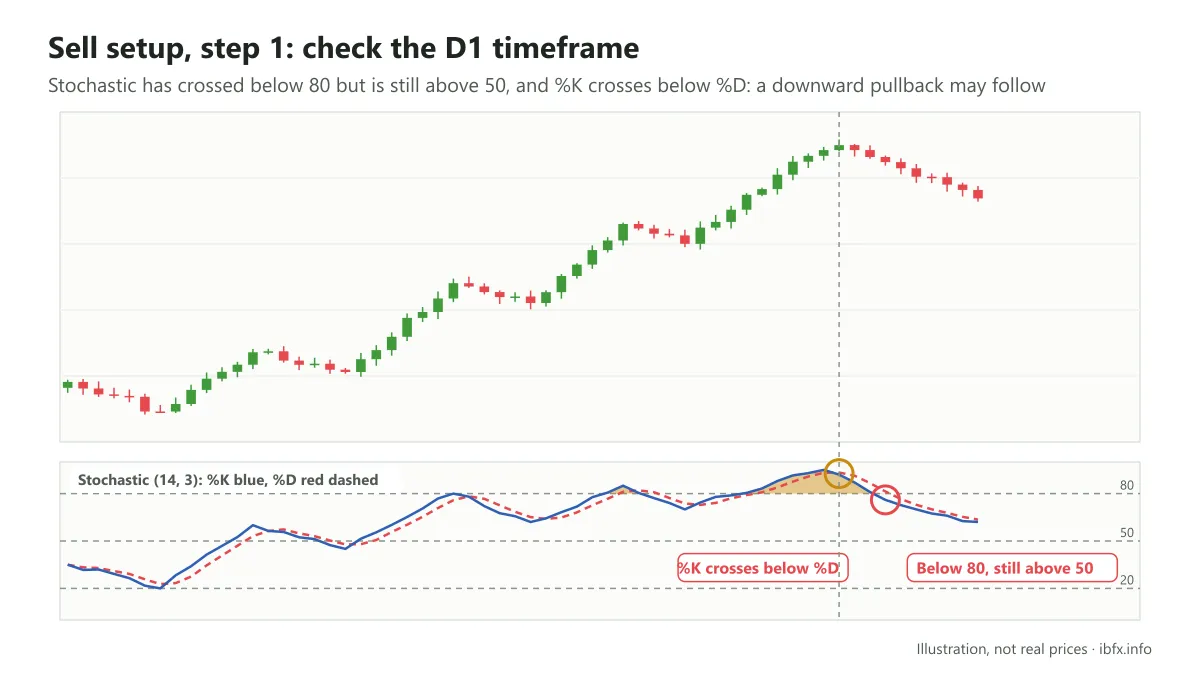
On the D1 timeframe, although Stochastic is no longer above the 80 level and has crossed below 80, it has not yet crossed below the 50 level. And the %K line has crossed below the %D line → a sign that the market is pulling back down.
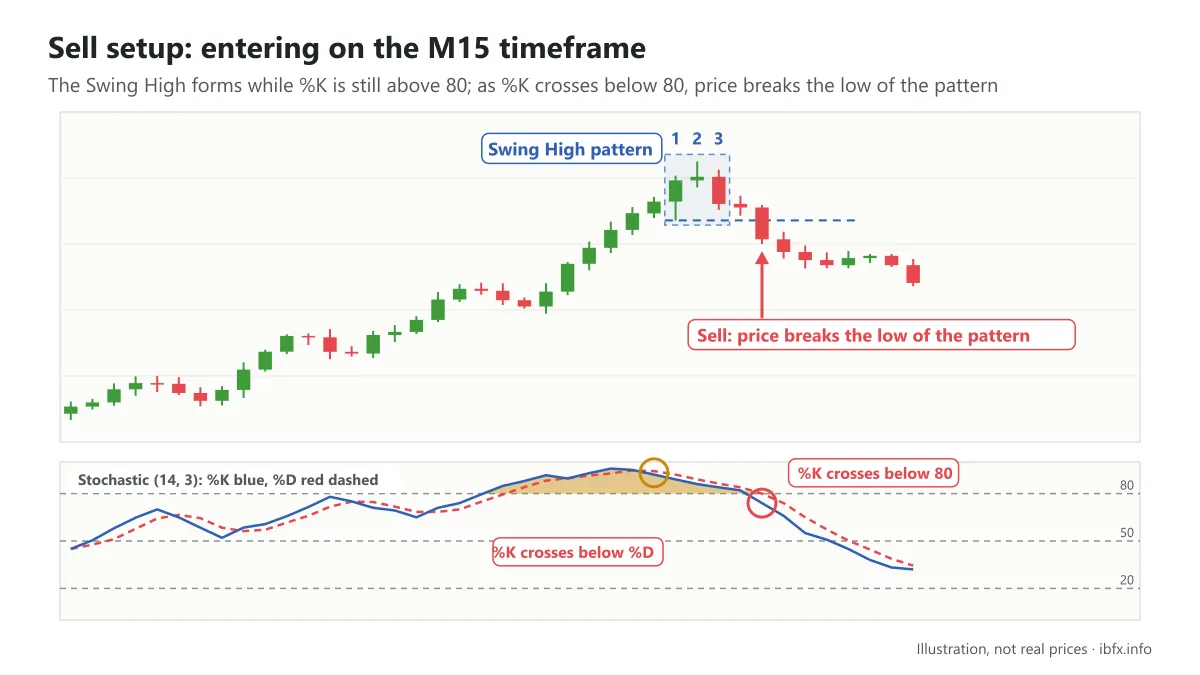
On the M15 timeframe Stochastic is still above the 80 level — unlike the D1 timeframe above, which has crossed below 80 — and the %K line crosses below the %D line.
At that point, although the Swing High pattern has formed on the price chart, %K has still not crossed below the 80 level, so keep waiting for the signal from Stochastic.
As soon as the %K line crosses below the 80 level, price also breaks the lowest price of the Swing High → enter a Sell right away.
In the same way, zoom out on the chart to place the stop loss and take profit.
Conclusion
If you are following the day trading style and want a strategy with clear rules, you can test the one suggested above.
It certainly will not be right in every market condition, and it needs to be checked again on past data and on a demo account before you use it with real money. This strategy can also be treated as a detailed guide for building your own strategy based on the Stochastic indicator.