On this page
The Hammer candlestick pattern is probably one of the candle patterns most traders know, in particular traders who follow the Price Action school, because it is very easy to recognize and often appears at the end of a downtrend, a warning that price may be about to reverse. So what does a Hammer candle mean, and how do you trade it? Read on.
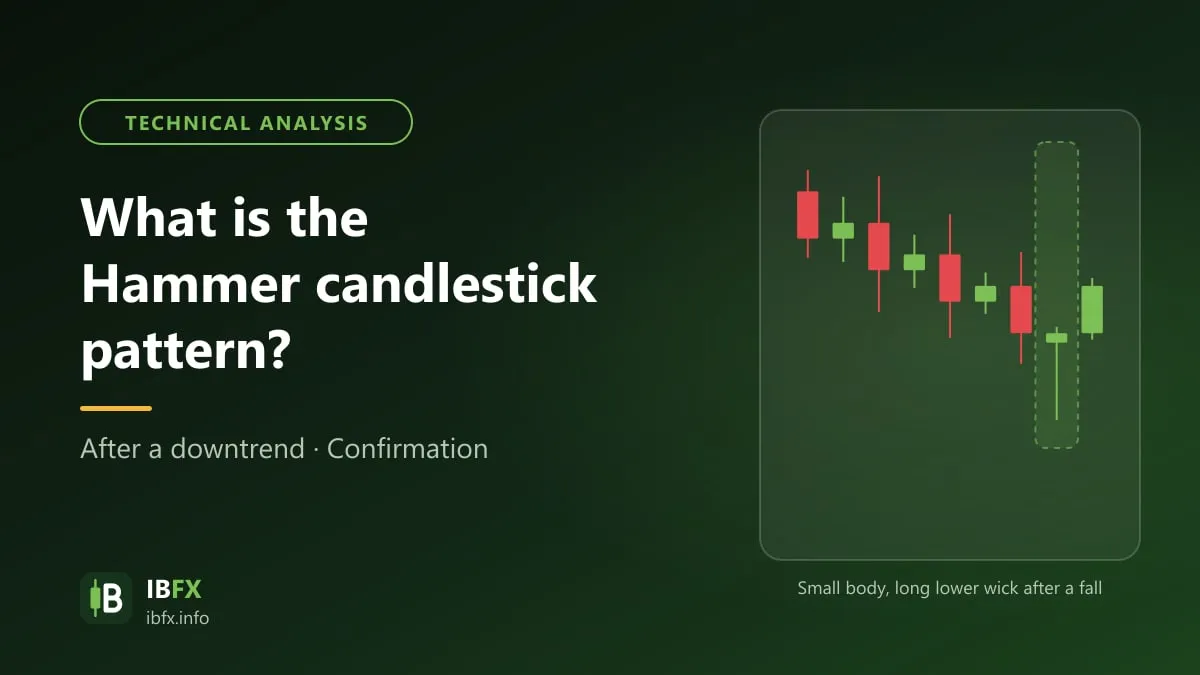
What marks out the Hammer candle
The body is small and sits in the upper part of the candle.
The lower wick is long, at least 2 to 3 times the body; the upper wick is very short or absent.
It appears after a fall in price. The color of the body does not matter much (a green body is usually seen as slightly more positive).
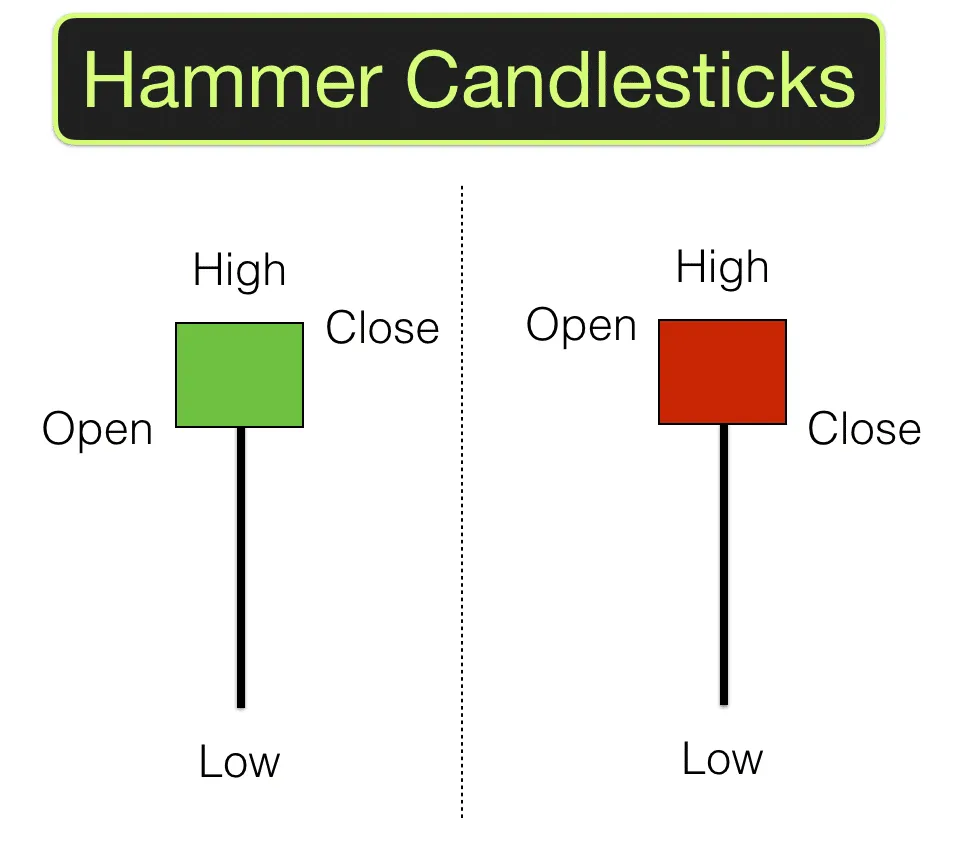
Why the Hammer candle takes that shape:
In terms of market psychology, a hammer candle appearing at the end of a downtrend shows that when the session opened, sellers were still in control and kept pushing price lower. Later on, though, buyers stepped in hard, pushed price back up and closed near the high of the session. What is left is a small body up at the top and a long lower wick, which looks like a hammer.

So a Hammer candle at the end of a downtrend shows the market rejecting the lower prices, a sign that selling pressure may be easing and that price may reverse upward.
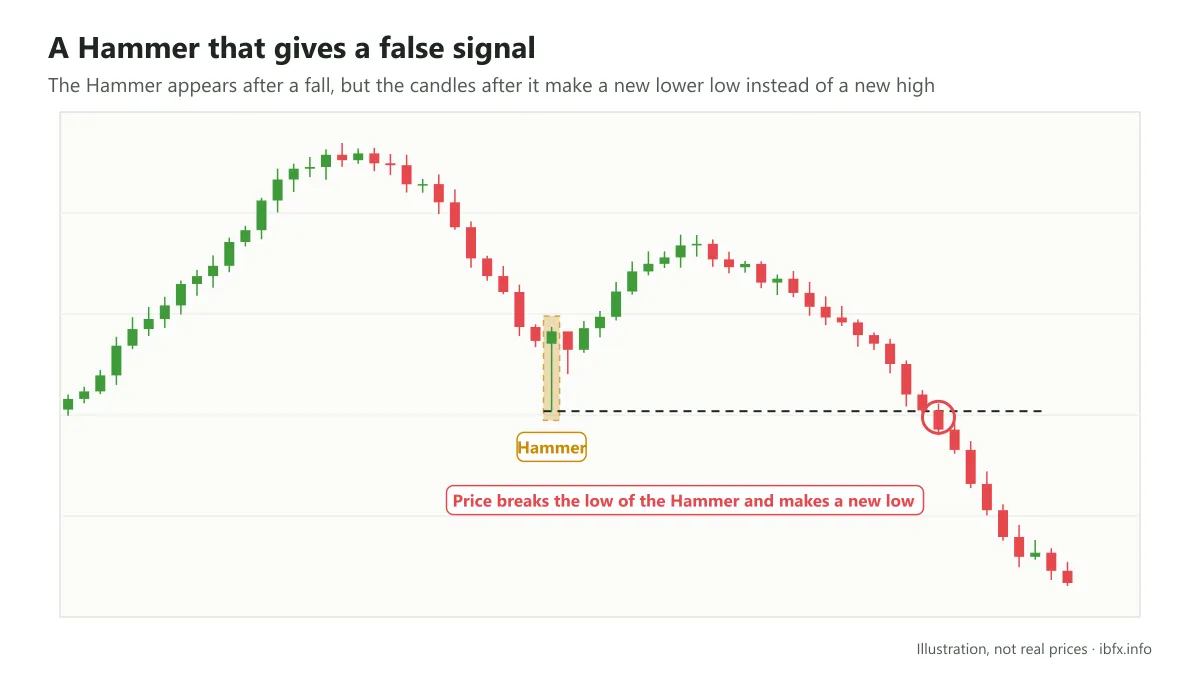
Seeing a Hammer, though, does not mean you BUY straight away, especially when the market has no clear trend. Standing on its own, a Hammer can give a false signal, in particular when the candles after it make new lower lows. The safer way is to wait for a confirming candle: the next candle closes above the high (or the body) of the Hammer.
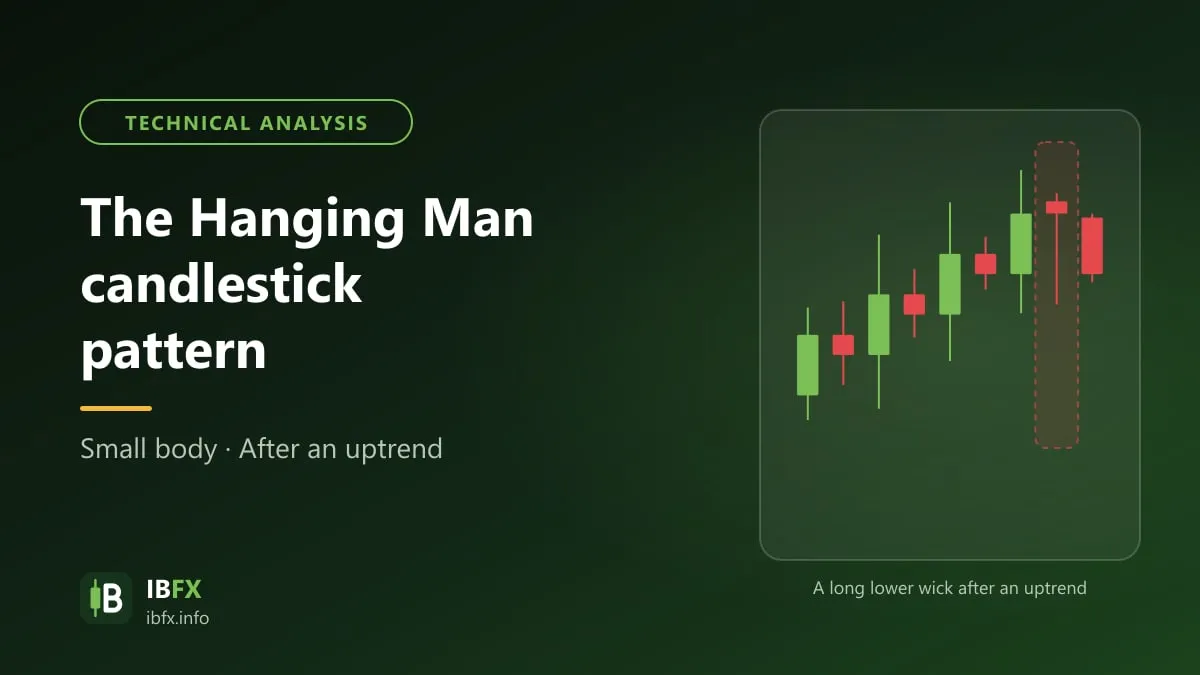
Note: a candle of the same shape that appears after a rise in price is called a Hanging Man and means the opposite. The Hammer is also one form of a bullish reversal Pin Bar.
How to find an entry with the Hammer candlestick pattern
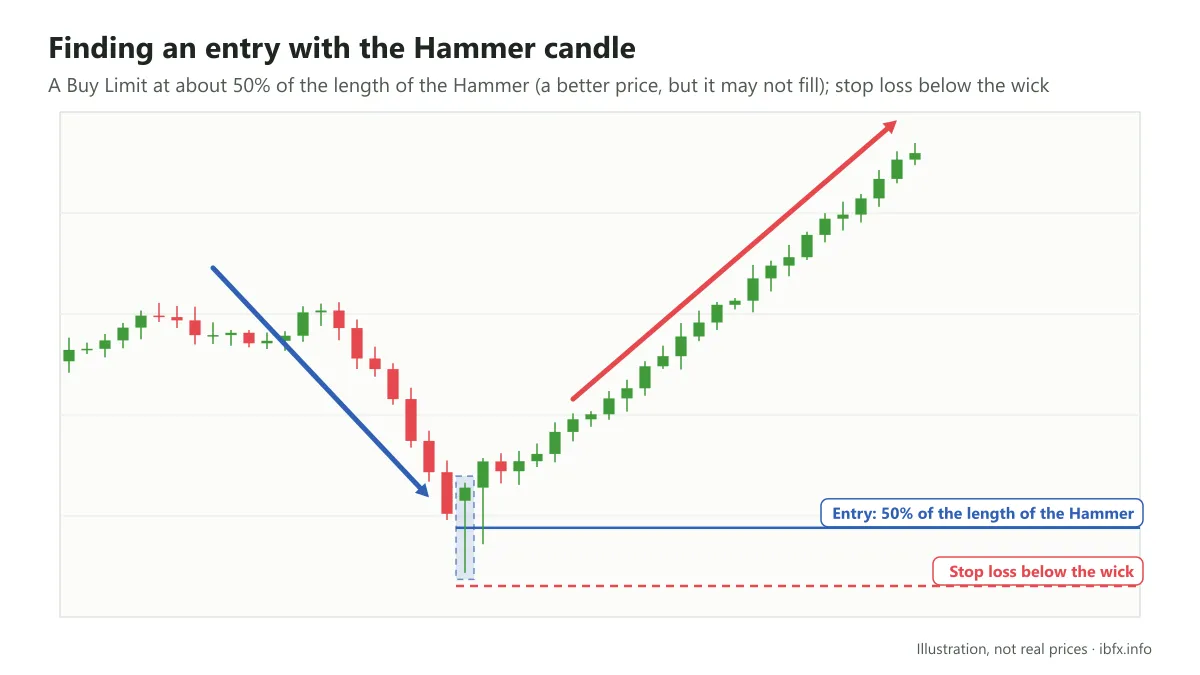
The picture above is an example on the H1 timeframe: after a sharp fall and the forming of one Hammer candle, price reversed upward. One way to enter is to place a Buy Limit pending order at about 50% of the length of the Hammer candle (a better price, but it may never fill), or to enter after a confirming candle. The stop loss goes a small distance below the wick so it is not swept when the market swings about, and you work out your position size from the stop loss distance.
As said above, the Hammer candle usually appears at the end of a downtrend, but there are still Hammers that give a false signal. To make the signal more reliable, besides the Hammer candle itself you should look at other factors such as the trend on the higher timeframe and important support zones. The larger the timeframe (H1 and up, H4 or D1), the more a Hammer candle is usually worth. You also need to remember this: whichever timeframe you work on, set your stop loss and take profit by that same timeframe.
An example of the Hammer candlestick pattern, and what it shows
Example 1: a Hammer at the end of a fall
After a long fall on the D1 chart, one Hammer candle appeared, and price then rose steadily, making higher highs; on the daily chart a Hammer signal is usually more reliable. Even so, a Hammer does not come out that way every time.
Because what a Hammer means depends a great deal on where it sits on the chart, traders usually put the Hammer together with other tools such as Fibonacci, pivot points or support and resistance zones to find a suitable entry and take profit.
Example 2: when the Hammer gives a false signal:
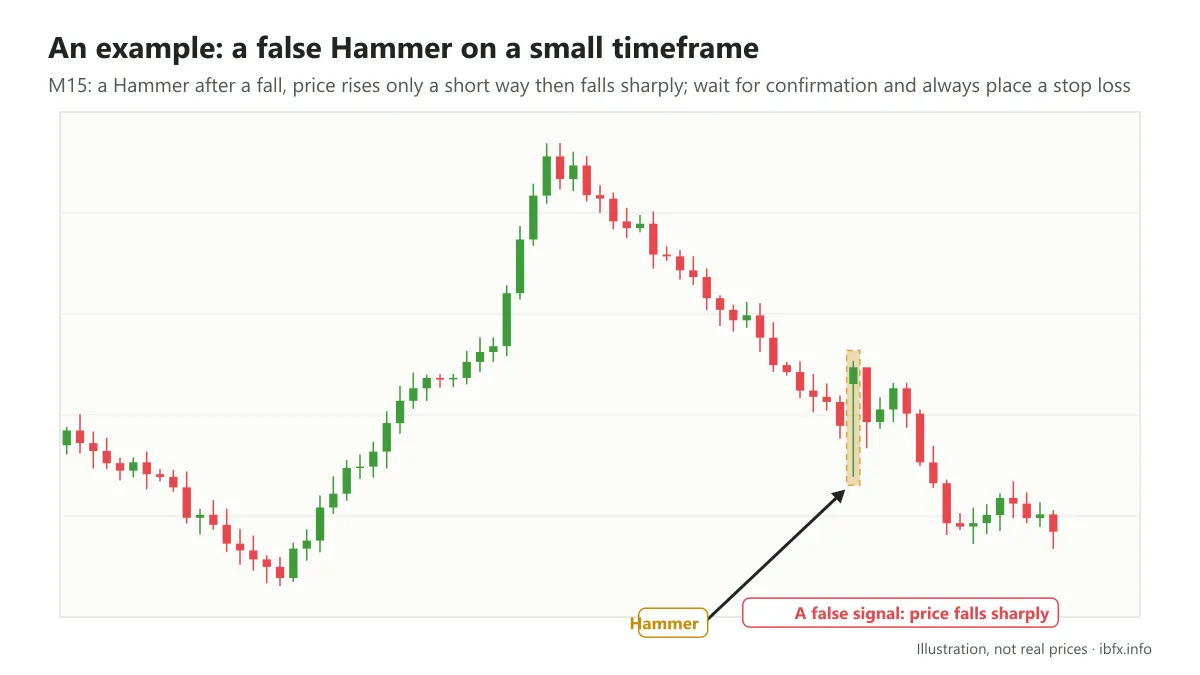
This is an M15 chart, where one Hammer appeared after a fall. Price rose only a short way, though, before turning around and falling sharply. This is a false Hammer signal, and it is also why you need to wait for confirmation, put other factors alongside it and always place a stop loss.