On this page
Volume Spread Analysis (VSA) is a method of analysis that is often seen as hard for a beginner to get into. Unlike the technical methods that work mainly from price, or fundamental analysis that works from the news, VSA concentrates on the relationship between price and volume in order to judge supply and demand in the market.
In this article we introduce the most basic parts of VSA and the 2 most important applications of this rather particular method of analysis. Read on.
What is VSA (Volume Spread Analysis)?
Volume Spread Analysis (VSA) is a method of analyzing price movement through the relationship between supply and demand, and from that forming a view of where the market may go next. The only tools it really needs are the price chart and volume. Note that VSA grew up on the stock market, where volume figures are centralized; in spot forex, volume on MT4 is only the tick volume of each individual broker, so the results need to be read with care.
VSA holds that the cause of price movement is an imbalance between supply and demand in the market, and that this imbalance comes from what the professional investors, the “big players” in the market, are doing; in the words of the man who developed the method, they are the “professional operators”, or “smart money”.
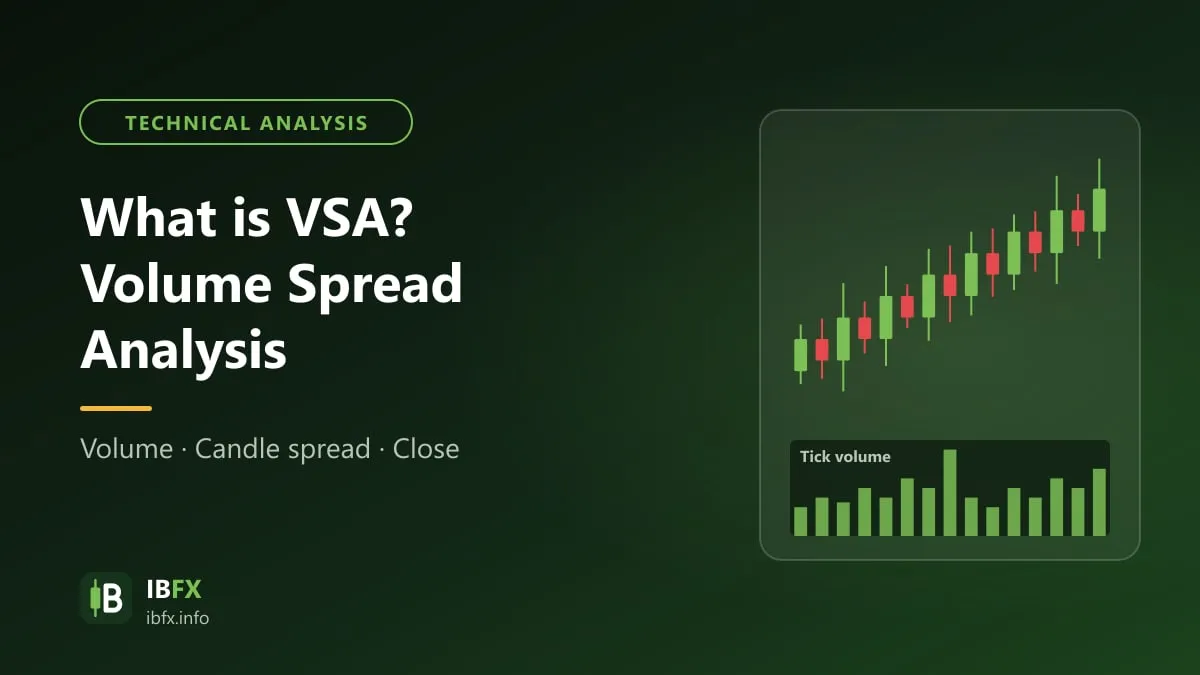
What these “big players” do shows up clearly on the chart, and VSA works out the supply and demand relationship through those moves, based on the interplay of 3 variables on the chart:
- Volume: the volume of a single price bar, or the volume of a single trading period
- Spread: the range of the trading period (from the high down to the low)
- Close: the closing price of the trading period
The history of the VSA method
The man who developed the VSA method of analysis, and who also built analysis software based on it, was a talented stock market investor: Tom Williams.
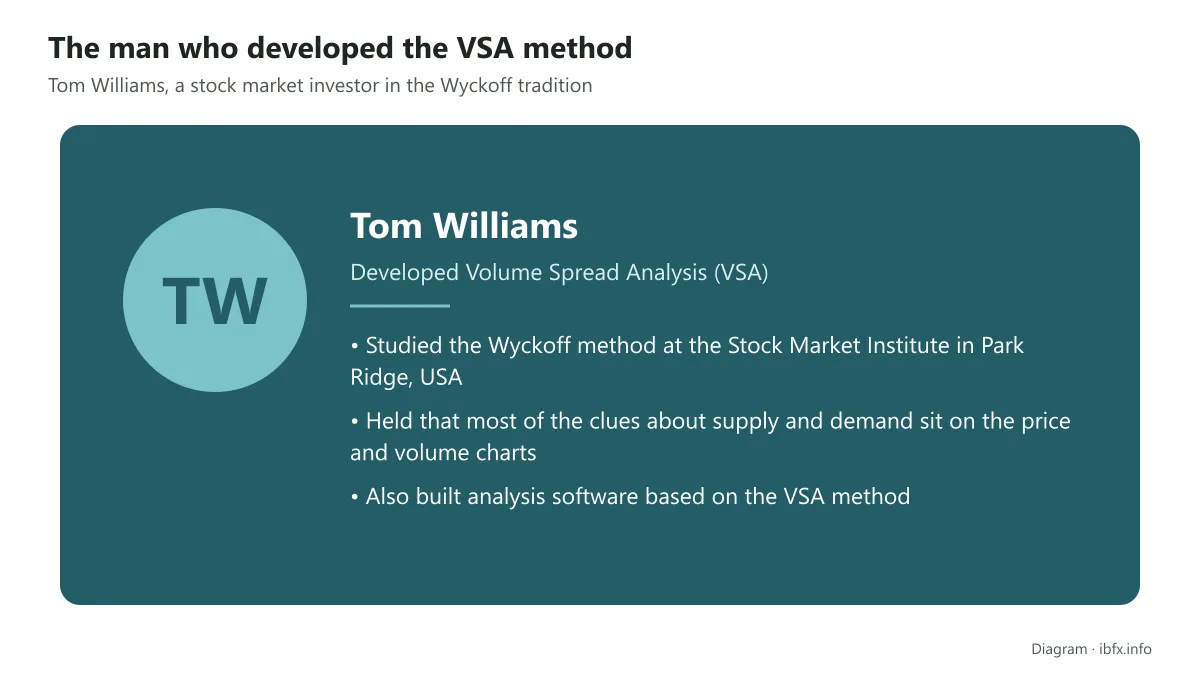
After studying the Wyckoff method at the Stock Market Institute in Park Ridge, USA, he came to the view that most of the clues about supply and demand are there on the price and volume charts, if a trader knows how to read them.
Over the years that followed, building on the Wyckoff method, Tom went on to develop the importance of the price spread and its relationship with trading volume and the closing price. In 1993 he made his work public in book form, in the manuscript that was later reworked and published as Master the Markets, and he developed a computer trading program using the Wyckoff Volume Spread Analysis method as we know it today.
In his methodology Tom argued: “The market does not move at random, as many traders think; they do not really understand how the market moves, so they trade wrongly, with the herd.”
And: “If you can read the supply and demand relationship from the price chart, you will have an edge over a crowd that does not understand the market, and you can trade in harmony with the smart money.”
The parts of the VSA method
The 3 parts, which are also the 3 main variables of the VSA method of analysis, are:
Volume: trading volume
Many amateur investors do not give trading volume the weight it deserves. Some indicators do build volume into price movement, but that approach has limits of its own. For instance, an indicator will often say the market is going to rise on high trading volume, yet price can still fall or move sideways on that same volume. That shows there are other factors at work on the price chart.
There are 2 levels of volume a trader needs to watch when using the VSA method:
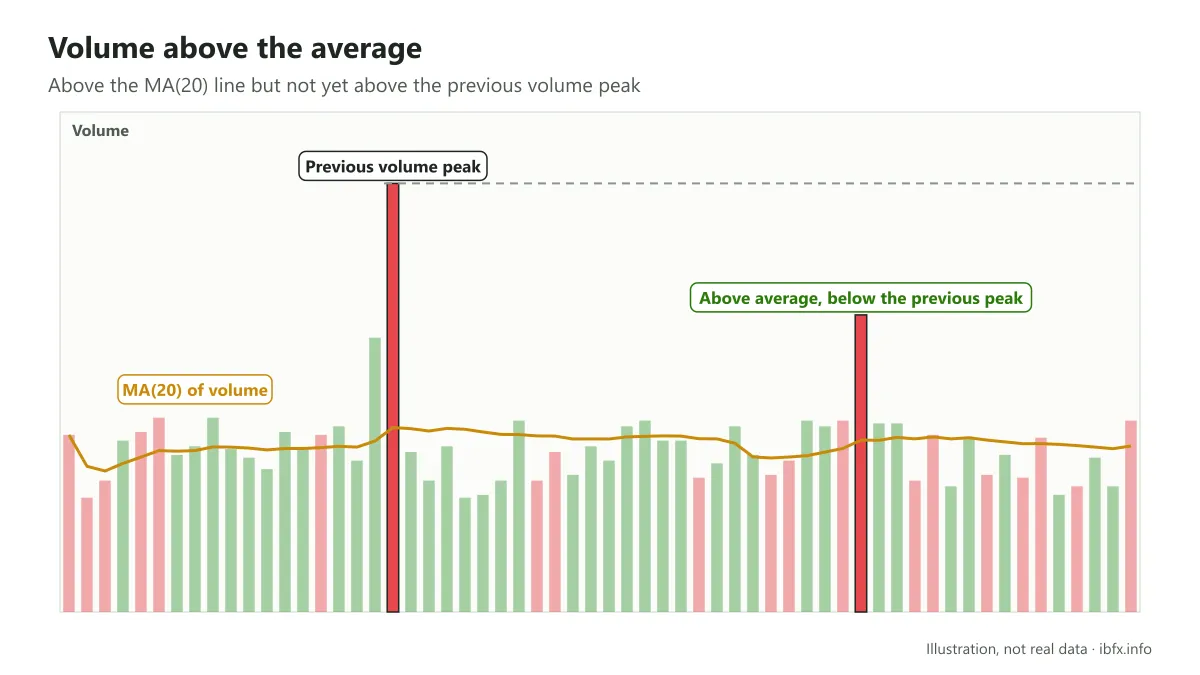
- Volume above the average: a level of volume higher than average volume but still lower than the peak before it. The average level of volume is usually taken as the MA(20) of volume.
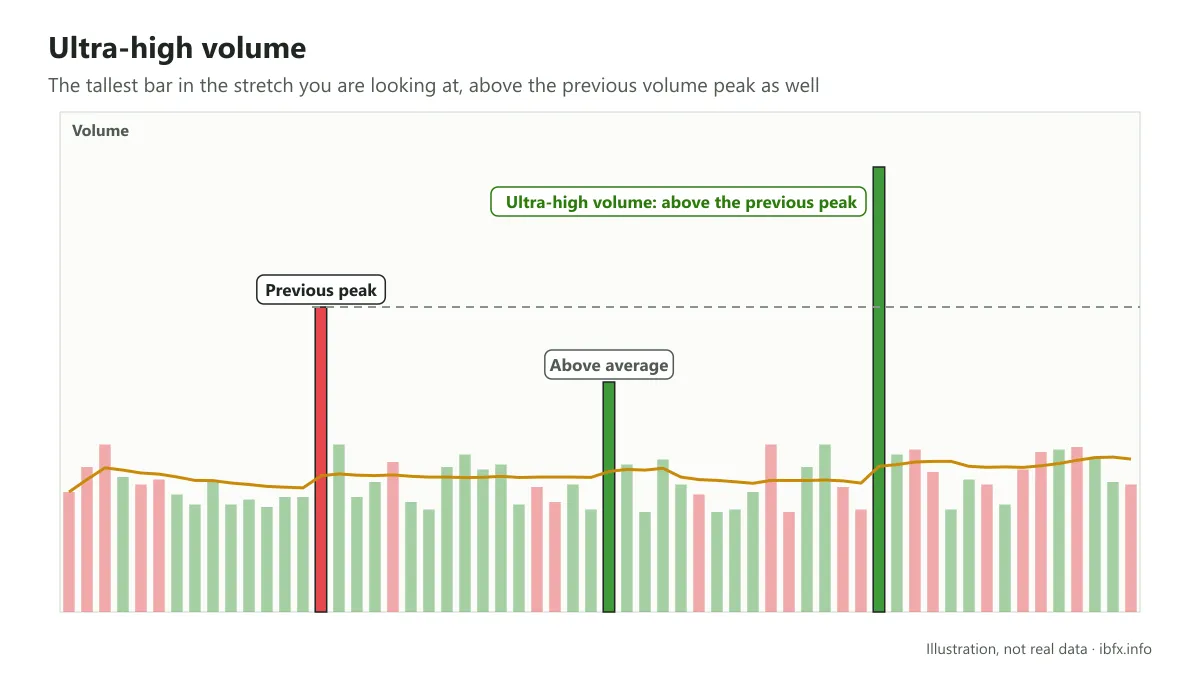
- Ultra-high volume: the highest peak in the stretch you are looking at, higher than the peak before it.
Spread: the price range
This is the range of price movement in the trading period, worked out as the distance between the high and the low of the candle (wicks included), not the body alone.
Keep in mind: spread here is not the difference between the Bid price and the Ask price that you may know from elsewhere.
Close: the closing price
Tom Williams held that the closing price is the single most important piece of information in the VSA method of analysis. The closing price can sit near the top, in the middle or near the bottom of the candle’s range, and that position tells you which side came out on top at the end of the period.
How to trade with the VSA method
There is a great deal around the VSA method, and many angles and many ways of trading with it, but within the space of this article we will only introduce the 2 main applications of VSA: SOW (Sign Of Weakness) and SOS (Sign Of Strength).
Before going into those 2 trading applications, you may want to look back at the article on the Wyckoff method and its 3 laws to get a clearer picture of the 4 phases of the price cycle in the Wyckoff method.
Sign Of Weakness
A Sign Of Weakness happens when demand slowly runs dry after a long rise in price. There are fewer buyers, the buy side starts taking profit, and supply rises as more sellers come into the market.
Sign Of Weakness: supply > demand.
Of the 4 phases of the price cycle — accumulation, markup, distribution and markdown — SOW appears in the markdown phase: when supply is greater than demand, after the distribution and redistribution phases.
- The spread and volume patterns of SOW
There are quite a few spread and volume patterns to look at when analyzing SOW, but in this article we will only cover the 3 most important and most commonly analyzed ones: UpThrust, Buying Climax and No Demand Bar.
UpThrust
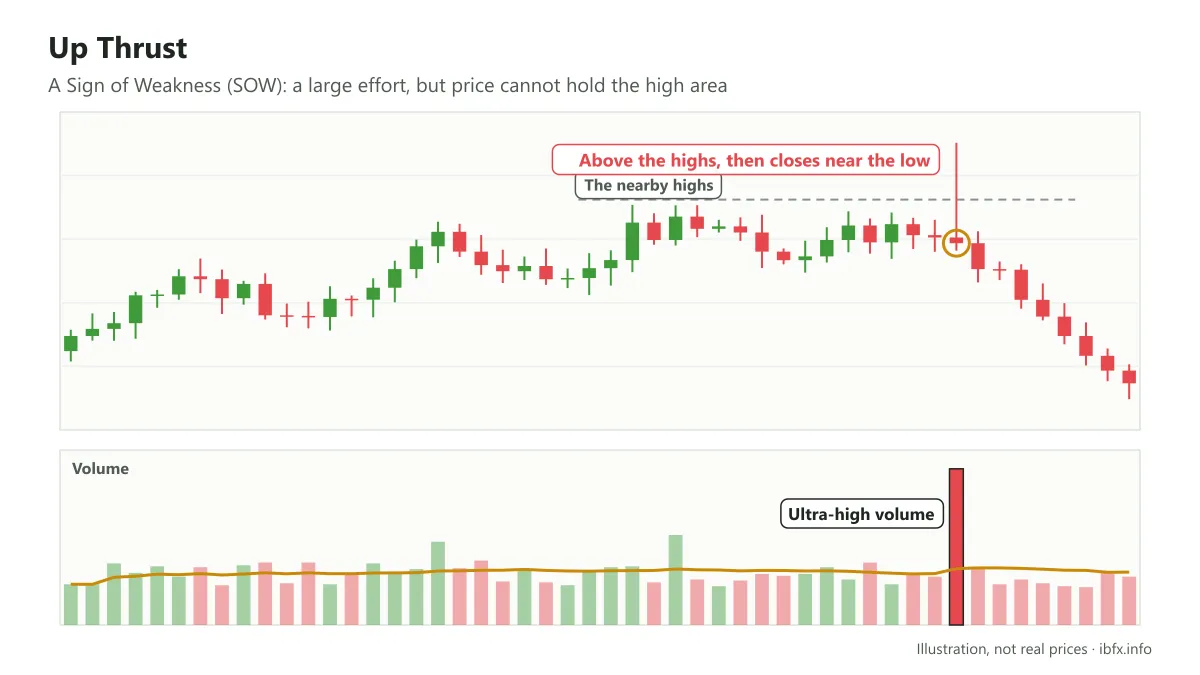
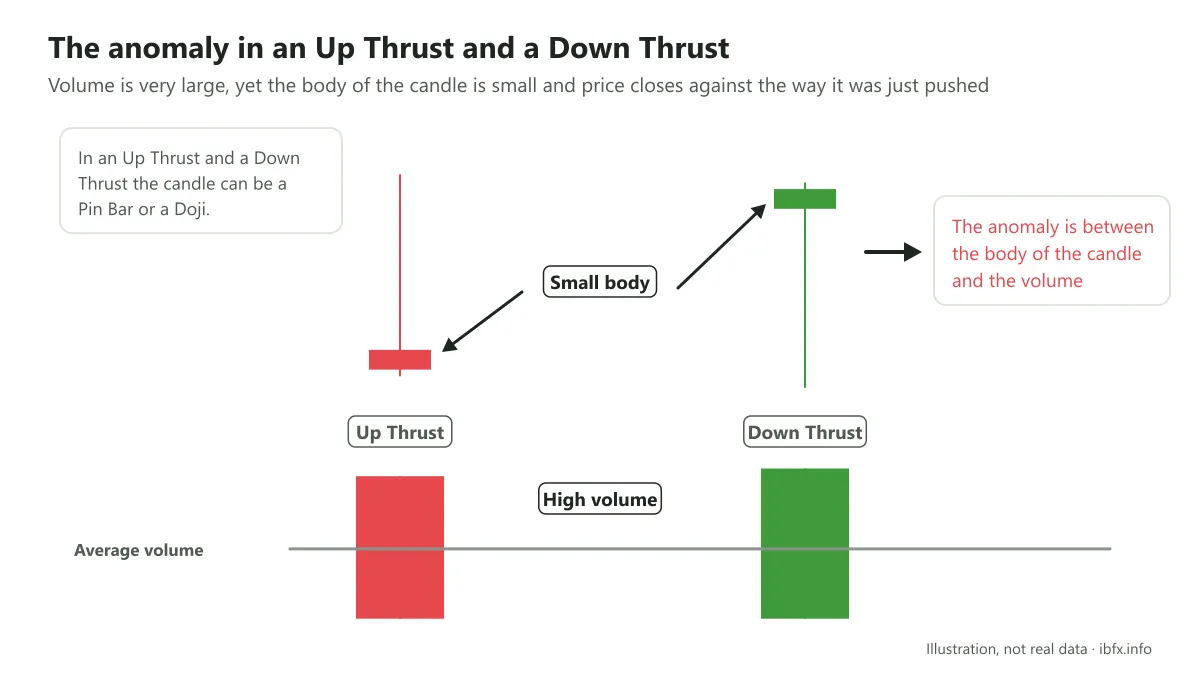
This pattern is usually a candle that is pushed above the nearby highs and then closes near its own low (it looks like a bearish reversal Pin Bar), on ultra-high volume or volume above the average.
The VSA method holds that large volume is a large “effort”, but the result is that price cannot hold the high area and closes near its low. That mismatch between effort and result shows that large supply has appeared up at the high prices, and price may fall in the period ahead.
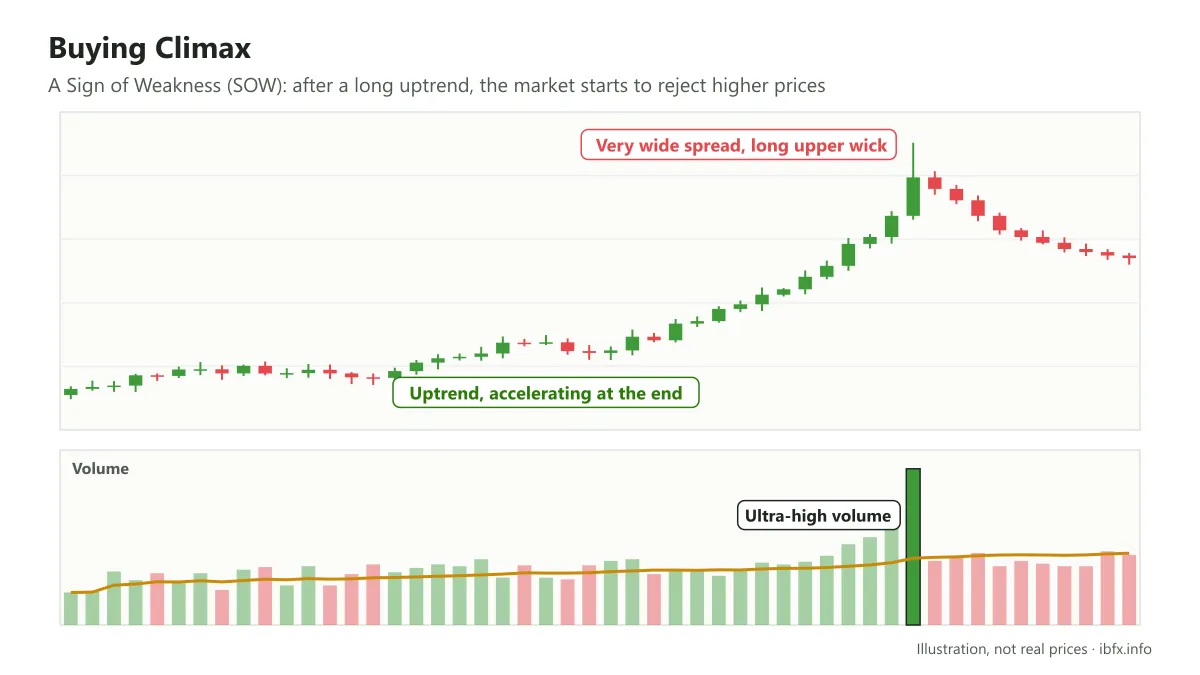
Buying Climax
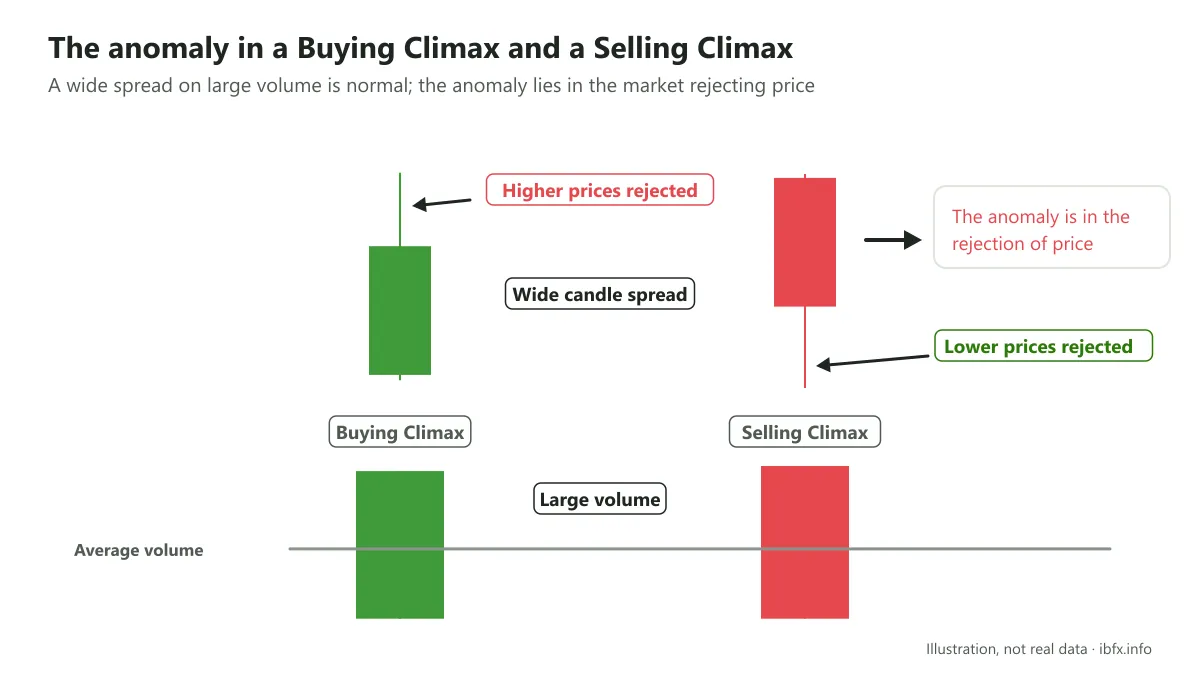
The Buying Climax pattern consists of a bullish candle with the following features:
- A very wide candle range (spread)
- Price pushes to a new high, above the highs before it
- A noticeably long upper wick, with the closing price not up at the top, showing the market is starting to reject higher prices
And ultra-high volume, or volume above the average.
This pattern usually only comes good when the trend before it was clear, in this case an uptrend that had been in place for quite a while before the Buying Climax appeared. On top of that, this uptrend accelerates toward the end on extremely large volume.
No Demand Bar
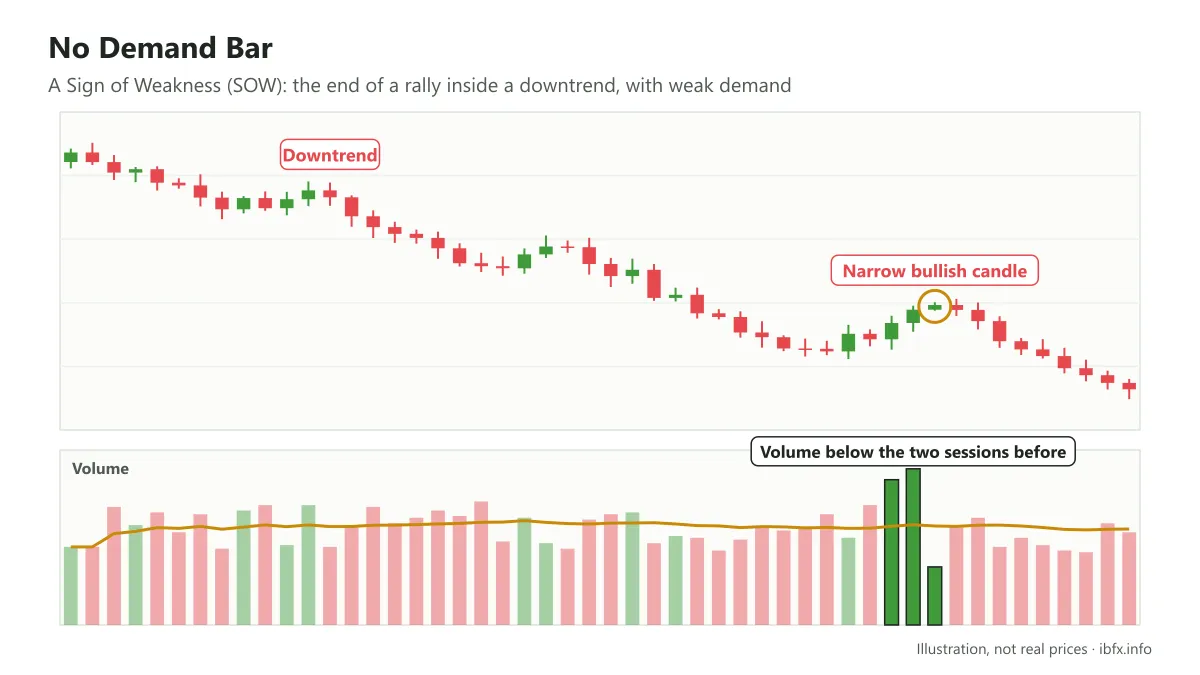
No Demand here means demand is weakening, price is struggling to rise any further and may fall.
The No Demand Bar pattern consists of 1 bullish candle with a narrow range (spread) and trading volume lower than at least the 2 periods before it. This pattern usually appears in a downtrend and signals that the trend will carry on. A No Demand Bar often turns up at the end of a rally.
Sign Of Strength
The other way round from SOW, SOS happens when supply runs dry after a long fall in price and buyers start to come into the market, so demand rises.
Sign Of Strength: demand > supply
Of the 4 phases of the price cycle — accumulation, markup, distribution and markdown — SOS appears in the markup phase: when demand is greater than supply, after the accumulation and re-accumulation phases.
- The spread and volume patterns of SOS
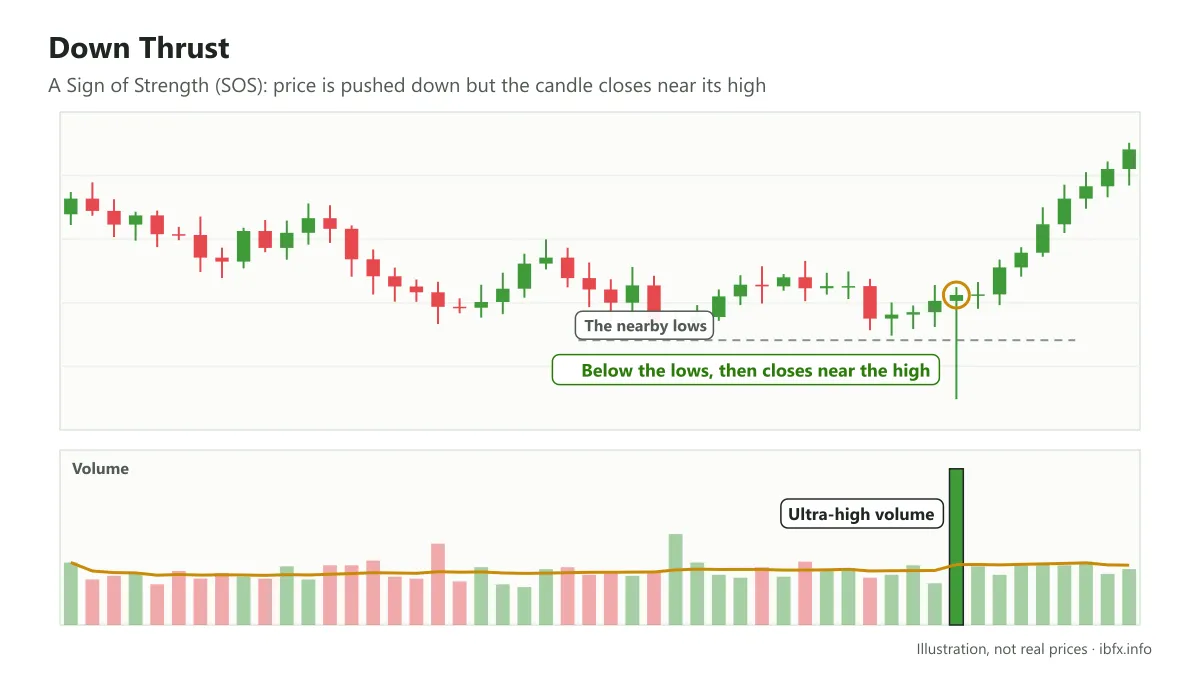
Down Thrust
The other way round from Up Thrust, the Down Thrust pattern consists of a bullish reversal Pin Bar and ultra-high volume, or volume above the average.
Selling Climax
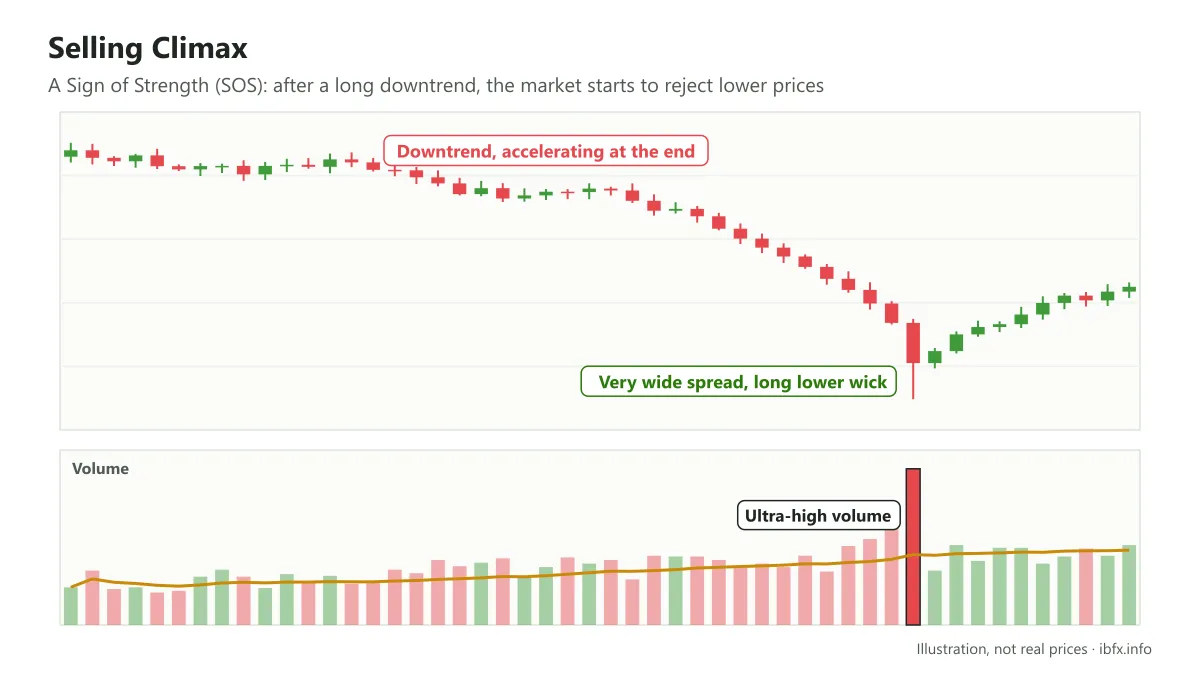
The Selling Climax pattern consists of a bearish candle with a very wide range (spread), with price going below the nearest low before it but with a noticeably long lower wick and a closing price that is not down at the bottom, showing the market is starting to reject lower prices. Plus, of course, ultra-high volume or volume above the average.
Just like the Buying Climax pattern, a Selling Climax has to appear after a clear downtrend, and that trend should accelerate toward the end on extremely large volume.
No Supply Bar
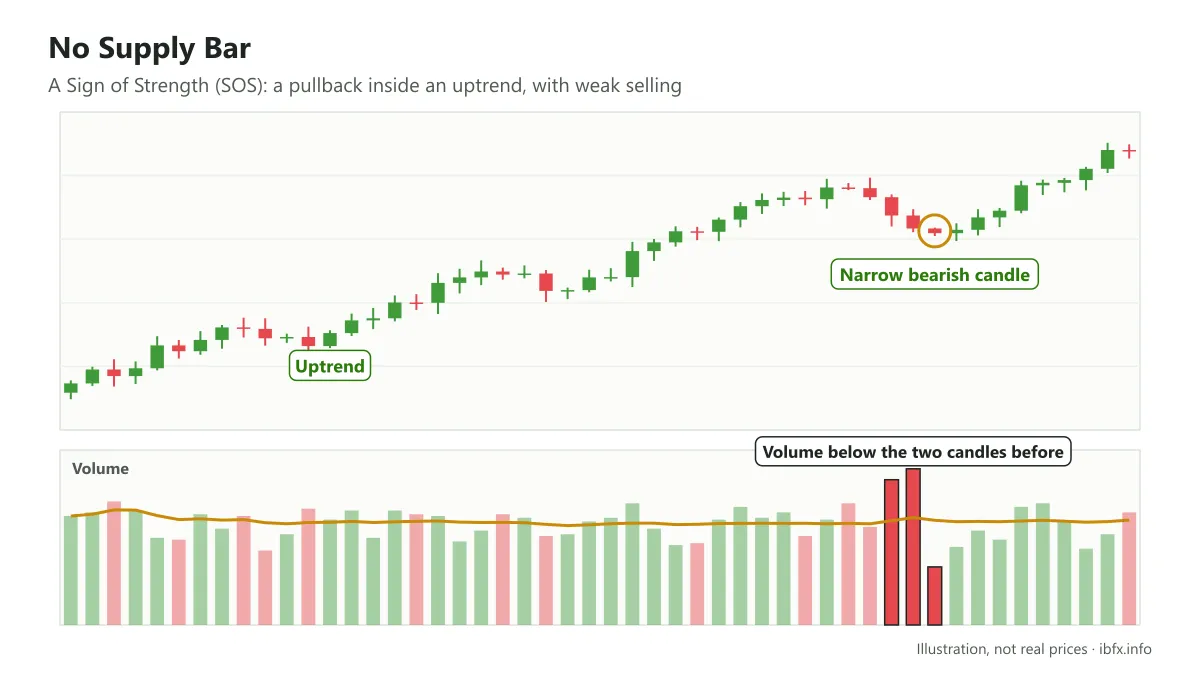
The No Supply Bar pattern consists of 1 bearish candle with a narrow range (spread) and volume lower than at least the 2 candles before it. This pattern usually appears in an uptrend, signaling that selling is weak and the uptrend may carry on; it is not a reversal signal.
How the VSA method of analysis works
Across all 6 spread and volume patterns of the 2 main applications of VSA set out above, we can see clearly the relationship between the range of the candle (spread), the position of the closing price and the volume of that candle.
When price moves normally, we have “confirmation” between the range of the candle and volume; when there is an “anomaly”, VSA holds that the market is out of balance between supply and demand, and price may move toward whichever side is stronger.
- Confirmation: when volume matches the range of the candle; in other words, a candle with a wide range comes with large volume, and a candle with a narrow range comes with small volume.
- Anomaly: when that confirmation does not happen: a wide range on small volume, or very large volume with price barely moving or closing against the direction of the move. An anomaly shows the supply and demand relationship is out of balance, producing a Sign Of Strength (SOS) or a Sign Of Weakness (SOW).
Reading the anomaly in the SOS and SOW patterns
UpThrust (SOW) and Down Thrust (SOS): the anomaly is very clear in these 2 patterns: very large volume (ultra-high or above the average) but price closes against the direction it was pushed in (an UpThrust closes near its low, a Down Thrust closes near its high).
Buying Climax (SOW) and Selling Climax (SOS): at first glance these 2 patterns look like no anomaly at all, because the range of the candle is wide and volume is high. The anomaly, though, comes from the market rejecting price after a long trend.
In the Buying Climax pattern, the candle has a noticeably long upper wick: even on very large volume, price cannot hold the highest area. According to VSA, that shows large money selling out to the people chasing price at the end of the uptrend.
In the same way, in the Selling Climax pattern the candle has a noticeably long lower wick: even on very large volume, price does not close at the lowest area. According to VSA, that shows large money buying from those selling out in a panic.
No Demand Bar (SOW) and No Supply Bar (SOS): there is no anomaly between range and volume in these 2 candle patterns, because the range is narrow and volume is low. But because supply (No Supply) or demand (No Demand) has clearly weakened in the context of the trend, price may move along with that imbalance, rising when there is no supply or falling when there is no demand.
The strengths and the limits of the VSA method
Strengths
The heart of VSA is studying the relationship between the range of the candle, the closing price and volume, in order to get at the supply and demand behind price movement, rather than just looking at the shape of price.
VSA concentrates on following the tracks of professional traders and large institutions (the smart money). They trade in large size, so what they do usually leaves tracks on the price and volume charts. Read those tracks and a trader can avoid chasing price at the top or selling out at the bottom along with the crowd.
Limits
- It is still subjective: looking at the same candle, different people may judge volume “high” or “low” and the range “wide” or “narrow” differently; it takes a great deal of practice.
- It depends on the quality of the volume data: VSA grew up on the stock market, where volume is centralized. In spot forex, volume on MT4 is only the tick volume of each individual broker, so VSA signals are less reliable and need to be read with care.
- It does not give a specific entry or stop loss: VSA mainly helps you judge the supply and demand context; a trader still needs to bring in the trend, support and resistance, and money management.
- Small timeframes carry a lot of noise: VSA signals usually mean more on the higher timeframes.
Like technical analysis or fundamental analysis, VSA is not a method that is “better than all the rest”, but an added way of looking at things. Plenty of traders combine VSA with other tools to get a further angle on supply and demand.
Conclusion
What is set out above is not everything there is to the VSA method, but it is the most basic ground for you to start getting into it.
VSA has a great many more volume and spread patterns and other multi-candle variations. If you want to go deeper, you can read Master the Markets by Tom Williams, and do practice on a demo account and always place a stop loss when you apply it.