On this page
Identifying the market trend is the first step in most trading strategies, in every kind of market, because the trend is one of the most important factors.
There are many methods and analysis tools that help a trader identify the market trend, so why is it that the results of using them are not what you hoped for?
Experienced traders read the trend wrongly at times too, but they usually know how to limit the damage; new traders, on the other hand, very often run into trouble at the very step of identifying the trend. So how do pro traders “catch the trend” in the forex market?
Why do traders still read the trend wrongly even with the best trend indicators?
There are 2 problems new traders often run into when they identify the market trend, and those problems make them lose often even though they use indicators.
First, you still lose even though you identified the trend correctly
Have you ever been in a situation where you believed you had identified the direction of the market correctly, but your trade was still stopped out very early, or you had to close it early to limit the loss?
There are probably quite a few cases like that.
Suppose that, with the signal your indicators gave, you predicted the market would rise. Once you had found a good entry, you took the trade and set your stop loss and your target take profit. But when price had gone up a stretch and had “almost” touched the take profit, it suddenly reversed.
There are 2 cases that can happen:
- You are afraid the market will really reverse and you do not want to lose more than you planned, so you close the trade early to limit the loss.
- You are confident in your trading system so you hold the trade, but unluckily it gets stopped out.
Right after that, though, price goes back to the main trend and rises strongly, not only touching the take profit but carrying on higher.
Maddening!
So what is the cause?
In fact the trend you predicted, that the market would rise, was right, but that was the general long-term trend, while your trading strategy is very likely a short-term one. So your stop loss sat too close for the swings that can happen over the long term.
Second, you take in information about the trend the wrong way
There are also many people who do not identify the market trend themselves but use the news and other people’s analysis, and apply that trend straight to their own trading.
For example, you read an expert’s analysis of the gold market from 2 hours ago. In it, the expert says the gold market will fall. You treat that as useful information about the next trend in the gold market and simply wait for a good chance to take a Sell. The result, though, is that your trade gets stopped out. Yet with the same information about the trend, someone else also takes a Sell, and their trade has not been stopped out and is in profit.
So what is the cause in this case?
The analyst predicted a falling trend in the gold market, and he did his analysis on the D1 time frame, which means the falling trend is the long-term trend.
You took the information in but applied it wrongly: you trade on the M15 time frame, and on that time frame the price of gold is rising, simply because it is an upward correction inside a whole long-term downtrend. Taking a Sell right there on M15 (with a short stop loss) while price was bouncing led to a loss because you had not grasped the nature of a trend in the foreign exchange market properly.
How do you fix those 2 problems?
Those are the 2 problems we run into again and again when we read the market trend. So how do we fix them?
If you look closely at the 2 cases set out above, you will easily see what they have in common.
It is this: the timeframe, the time frame you trade on
A trend means nothing at all if we do not attach it to a particular time frame.
You identify that the market is in a downtrend on the D1 time frame, but on M15 it is in an uptrend right now. And on the M5 time frame price moves up and down constantly and may well be going sideways.
So before you conclude anything about the trend, you need to know which time frame you are going to trade on.
At this point many people will ask: which time frame do you use to identify the market trend most accurately?
First of all, you have to understand that the time frame is not what decides the result of reading the market trend. If your reading skills are good and you use your analysis tools well, you will identify the market trend accurately. Choosing a suitable time frame is how you then trade well on the trend you have read.
As in the example above, you read the gold market as falling over the long term, and that trend shows clearly on D1, so you should Sell on the D1 time frame (with a stop loss that suits D1), or, if you trade on M15, you have to wait for the bounce on that time frame to end. Instead you sold on M15 exactly when the trend of that time frame was rising.
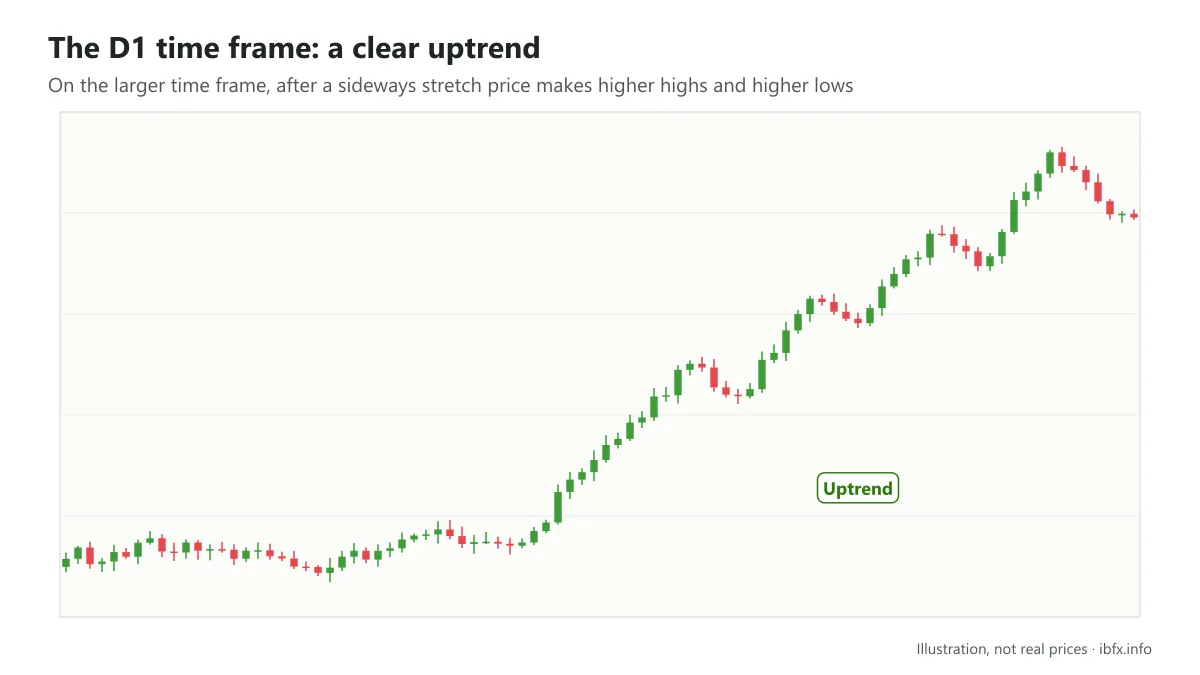
On D1, the current market trend is clearly rising.
But if you use the M15 time frame, things look different
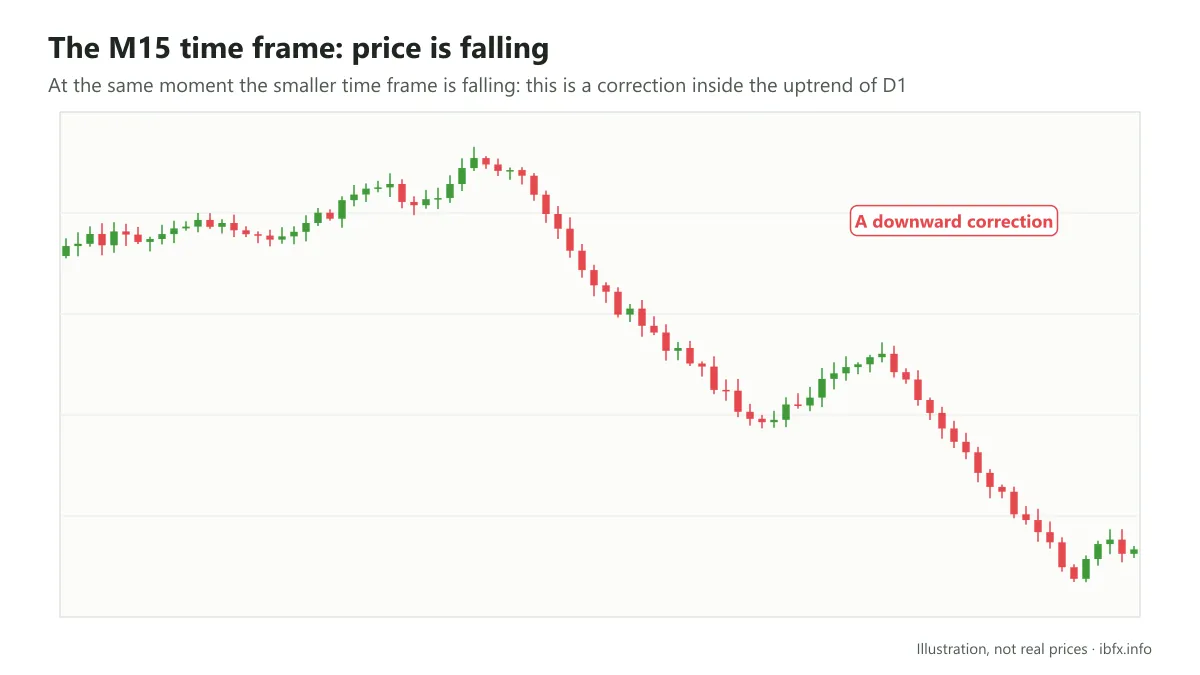
If you trade on D1, you have to find a chance to take a Buy, perhaps waiting until price touches support (marked by the trendline of the trend, for example) and then entering. If you trade on M15, on the other hand, your strategy will be to use the downward correction to make a profit over the short term.
As for how you choose a suitable time frame, that depends on your trading style.
If you are a scalping trader, you will trade on the M1 and M5 time frames. If you are a day trader, the time frames that suit you are M15, M30 and H1; if you are a swing trader, you will take your trades on H1, H4 or D1; and if you are a position trader, D1 and W1 will suit your style.
Once you have picked your trading time frame, take the trend on that time frame as your main basis for entering, use a larger time frame as context, and avoid jumping back and forth between too many time frames, because that gets confusing.
The top 4 common tools for identifying the trend
If you ask about tools for identifying the trend, we can list a whole string of familiar names such as MA, MACD, Bollinger Bands, ADX, Parabolic SAR, Ichimoku… (RSI is an oscillator, but some traders use it to judge the trend as well).
Each indicator has its own way of identifying the trend, each has strengths and weaknesses, and depending on the market conditions each will work well or not.
As they practice trading, a trader will learn which tool suits their own trading system best.
But with dozens of names like that, where should you start? Trial and error and sifting through them takes a great deal of time. That is why we are introducing you to 4 simple, common tools for “catching the trend”.
Price action (PA) for identifying the market trend
PA is not really an indicator but a method of analysis, based only on the behavior of price through the shape and the path of the candles, without using any indicator at all.
Price action analysis helps you see the structure of the market, the momentum of the trend and the psychology of the crowd clearly, so you can find potential trading opportunities. That is one of the important things this method gives you: it helps you understand the movement of the market directly instead of depending on an indicator.
To identify the market trend, PA traders work out the structure of the trend from the behavior of price:
- Uptrend: price makes a new high above the last and a new low above the last
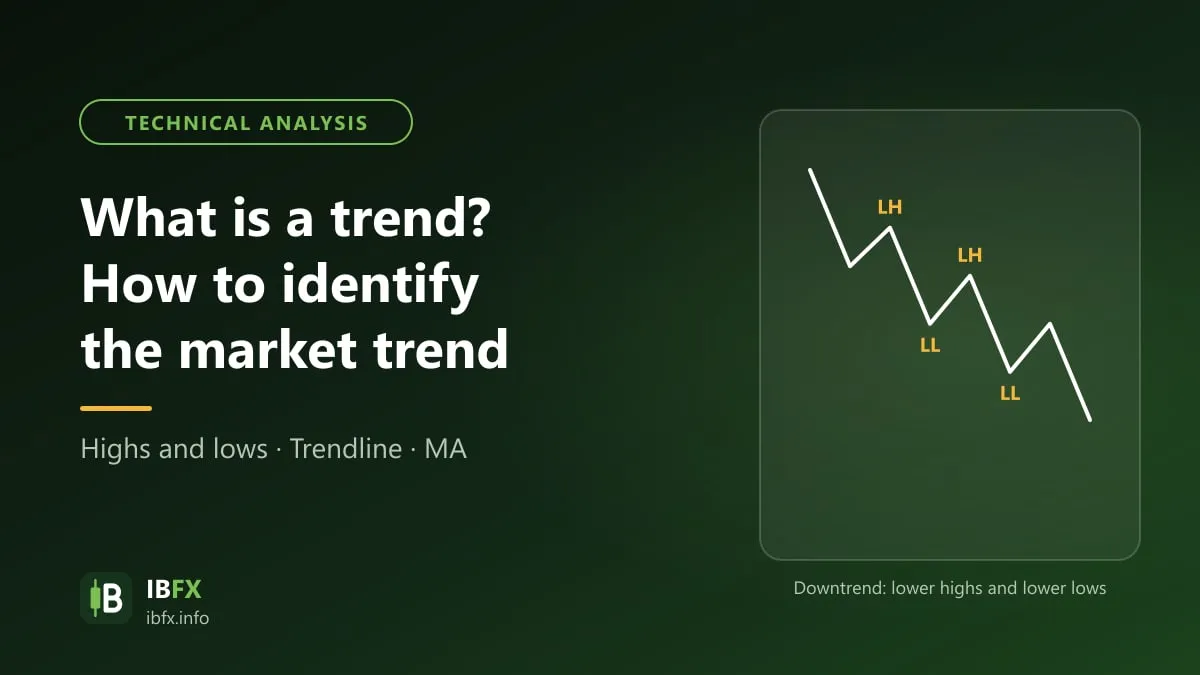
- Downtrend: price makes a new high below the last and a new low below the last
- Sideways market: price moves between highs and lows that are nearly equal
For example:
An uptrend
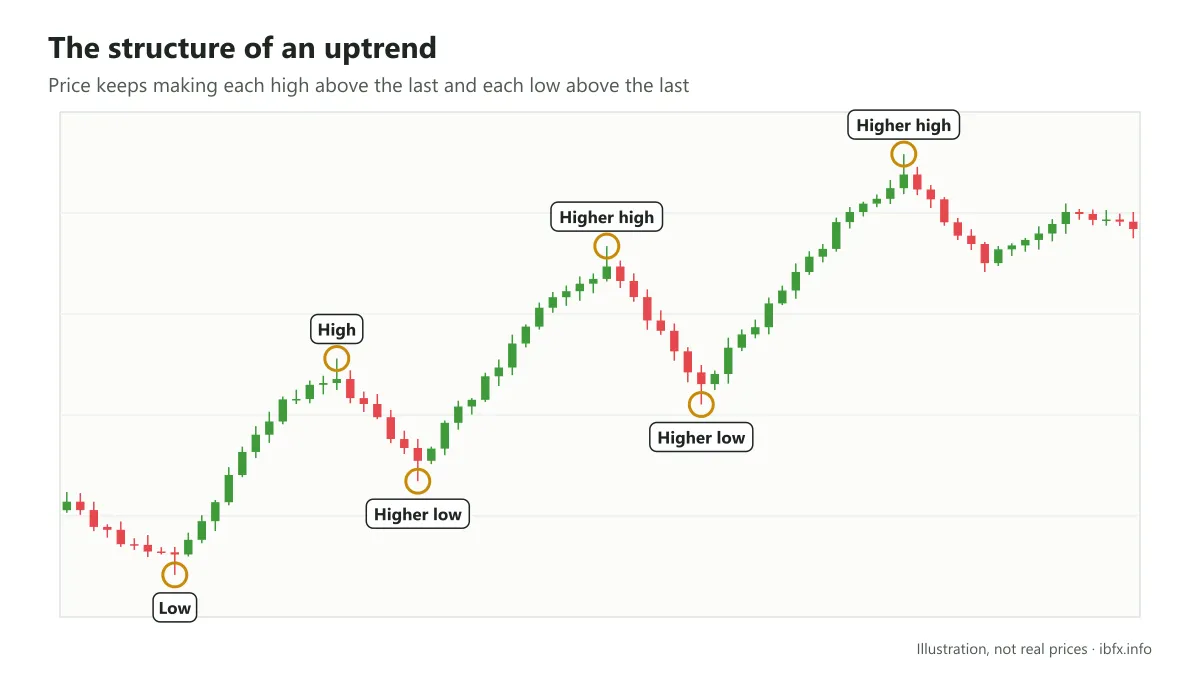
The structure of an uptrend forms when price keeps making highs above the last (higher highs) and lows above the last (higher lows).
A downtrend
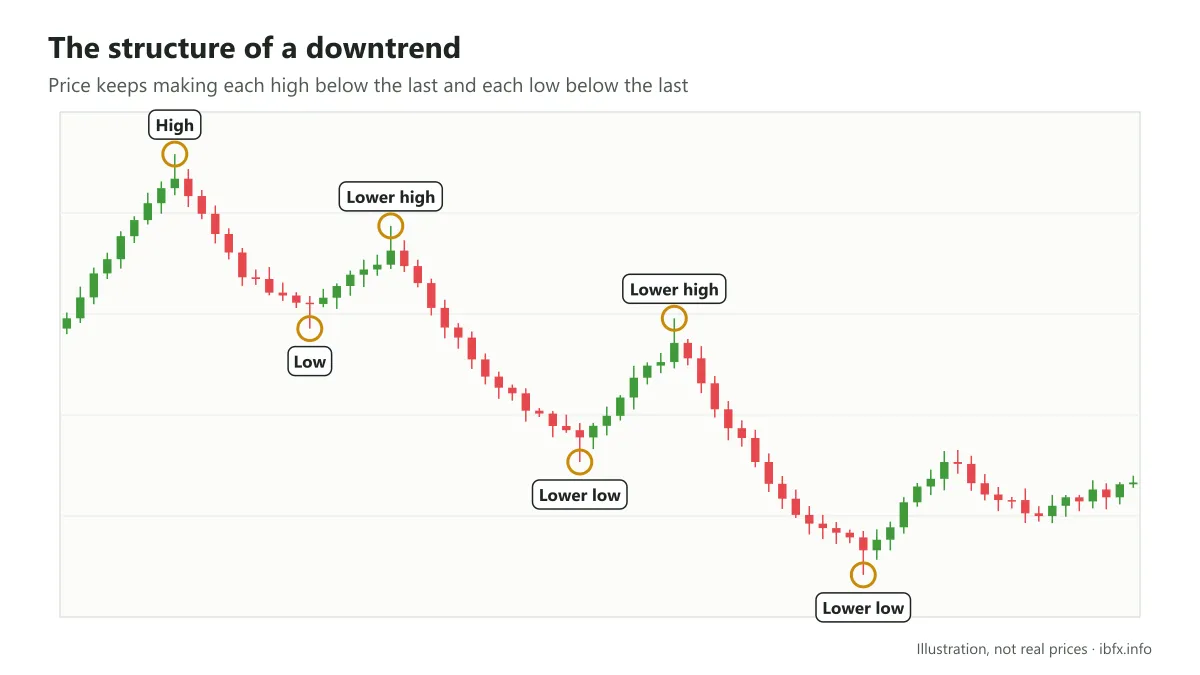
The market keeps making highs below the last (lower highs) and lows below the last (lower lows), which forms the structure of a downtrend.
A sideways market
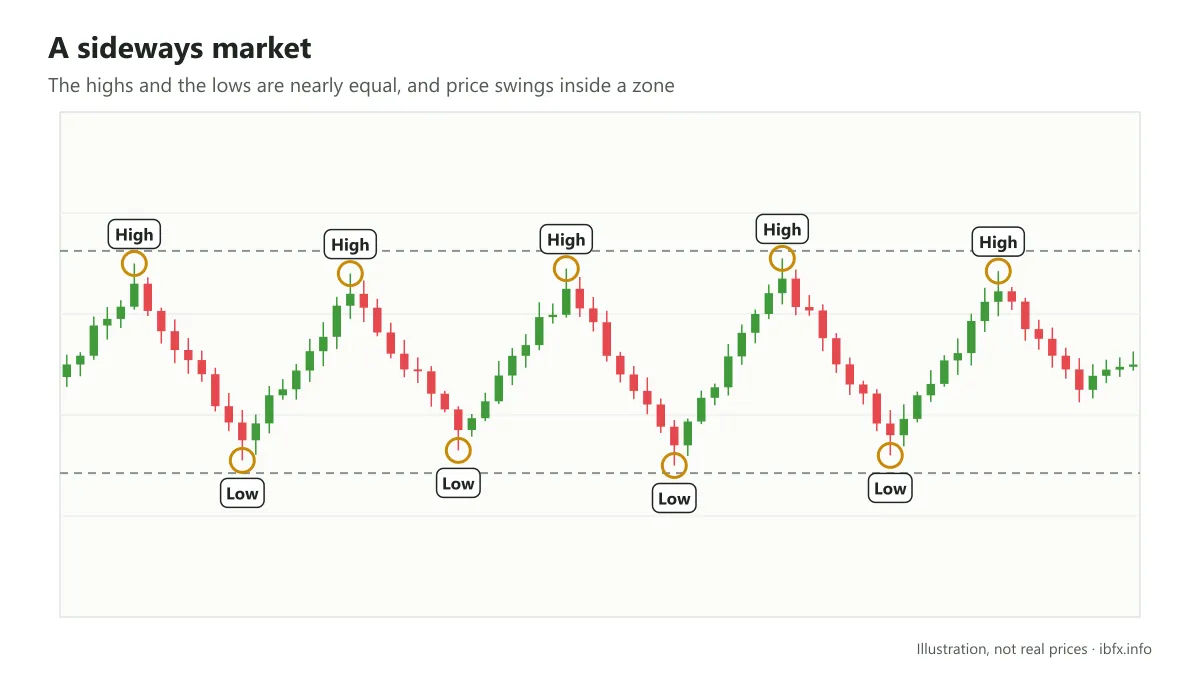
In trading, at least 2 highs and 2 lows that fit 1 of the 3 structures above are enough for us to identify the market trend. After that, read the momentum of the trend to judge whether it is likely to carry on or to reverse. Read more: what a trend is, and how to identify the market trend.
In practice, though, it is not always easy to work out the structure of the trend, above all when there are too many long, straggly wicks, which makes the highs and the lows harder to pin down.
And one tip for identifying the trend well with price action is to use a line chart instead of a Japanese candlestick chart when all you can see on the price chart is wicks.
A line chart is built by joining the closing price of every trading session on a given time frame. Because it leaves out the highest prices (High) and the lowest prices (Low), a line chart shows us only a smooth line, which makes the structure of the trend easier to work out than when there are too many wicks on a Japanese candlestick chart.
An example of a line chart:
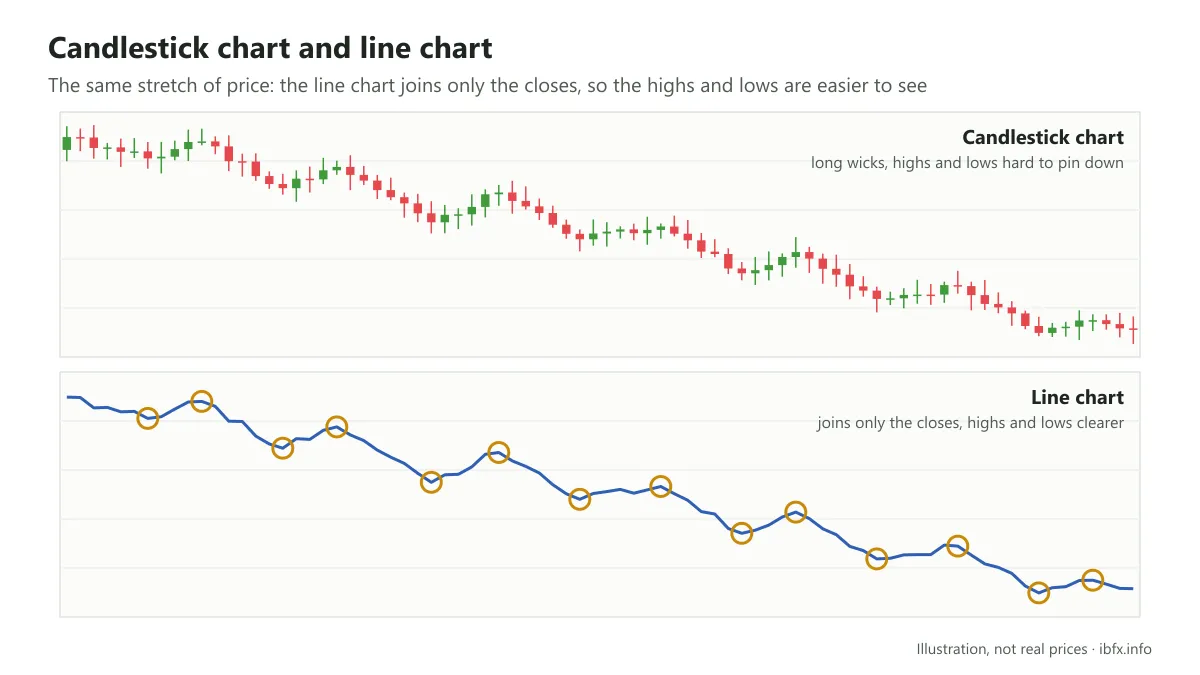
Leaving out the highest and the lowest prices of the trading session on a line chart only helps while you identify the trend, as said above, but it has a large effect on your trading decisions. So use a line chart only to identify the trend, and use a candlestick chart or a bar chart when you take the trade.
The trendline for identifying the trend
It is not an indicator either, but a trendline is not a method of analysis: it is a tool that supports analysis.
The trendline of a trend acts as an important support or resistance level, so once you have worked out the trendline of the trend, this tool will point a trader toward potential trading opportunities.
A trendline is drawn on the price chart by the trader, so this tool is very subjective. Even so, there are certain rules for drawing a trendline as accurately as possible:
- Find at least 2 turning points, which can be swing highs or swing lows
- Use the trendline tool in your trading platform to join them up
- The more swing highs or swing lows touch the trendline, the more the trendline is confirmed and the more traders pay attention to it, although any trendline can be broken.
So how do you identify the trend from a trendline?
It is extremely simple:
- If the trendline points up: the market is in an uptrend
- If the trendline points down: the market is in a downtrend
A trendline also lets a trader read the momentum of the trend: the steeper the trendline, the stronger the trend, and the flatter the trendline, the weaker the trend. A trendline that is too steep is usually hard to keep up, though, and gets broken early.
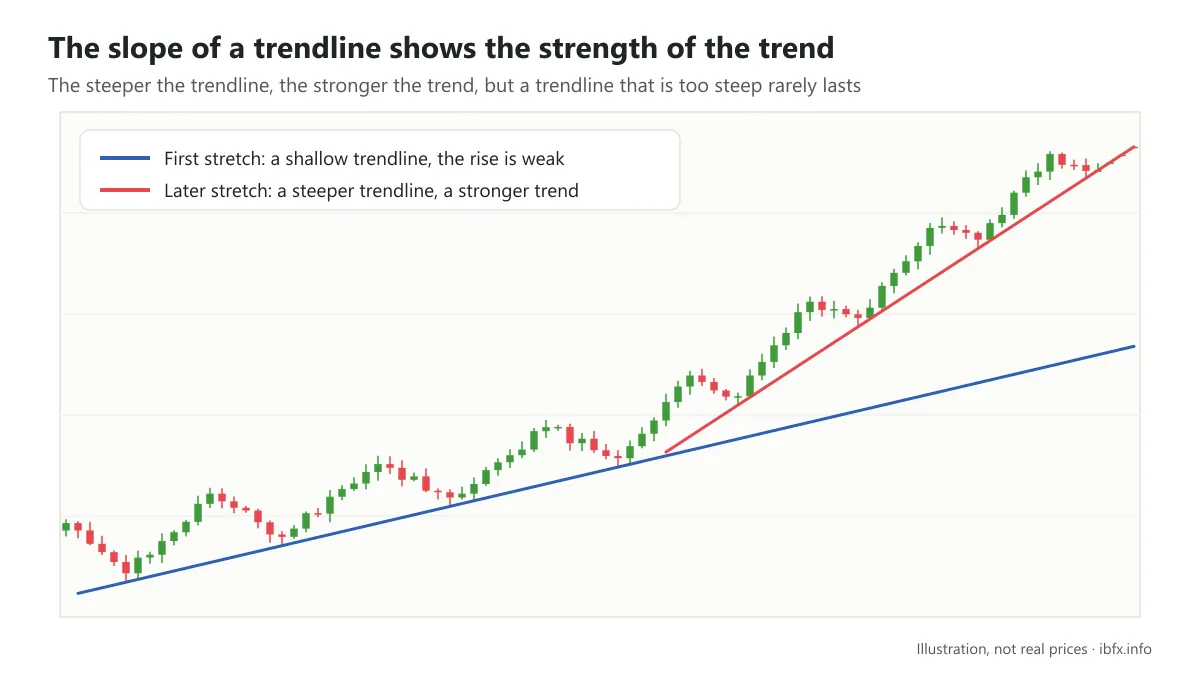
With a trendline sloping up, the current market trend is rising. In the first stretch, though, the low slope of the trendline shows that the strength of the uptrend is still weak; in the later stretch the trendline is quite steep, which shows the trend is very strong.
Price channels for identifying the trend
A channel and a trendline are really the same thing, but a channel is better than a trendline in that it gives a trader more useful information: with a trendline you work out the market trend and the moment to enter, while with a channel you also work out a good moment to exit.
So if the only aim is to identify the market trend, a trader will prefer a trendline because it is simple, but if you need the full picture for trading, a channel is the better choice.
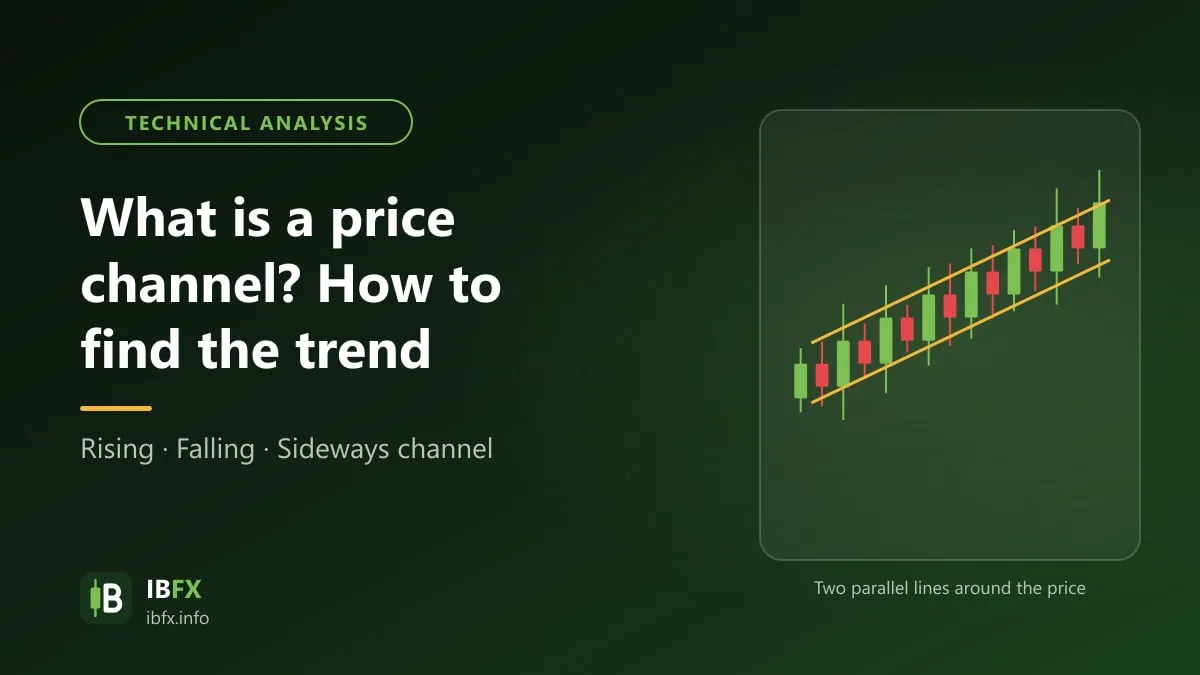
To draw a price channel, you only need to draw a trendline and then draw one more line parallel to it, running through the first high or the first low of the trend.
Of the 2 trend lines of a price channel, the upper one acts as resistance and the lower one acts as support. If you take a Buy at support, then when price rises and touches resistance that is a suitable moment to exit, and the other way round.
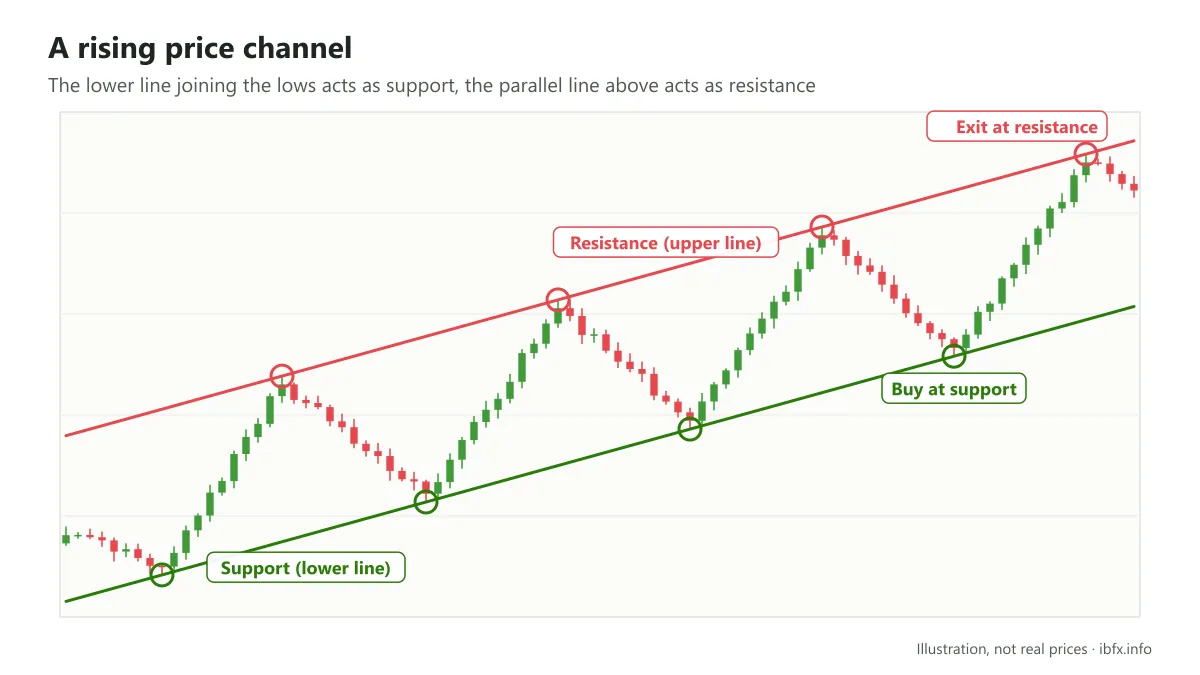
The MA, a true trend indicator
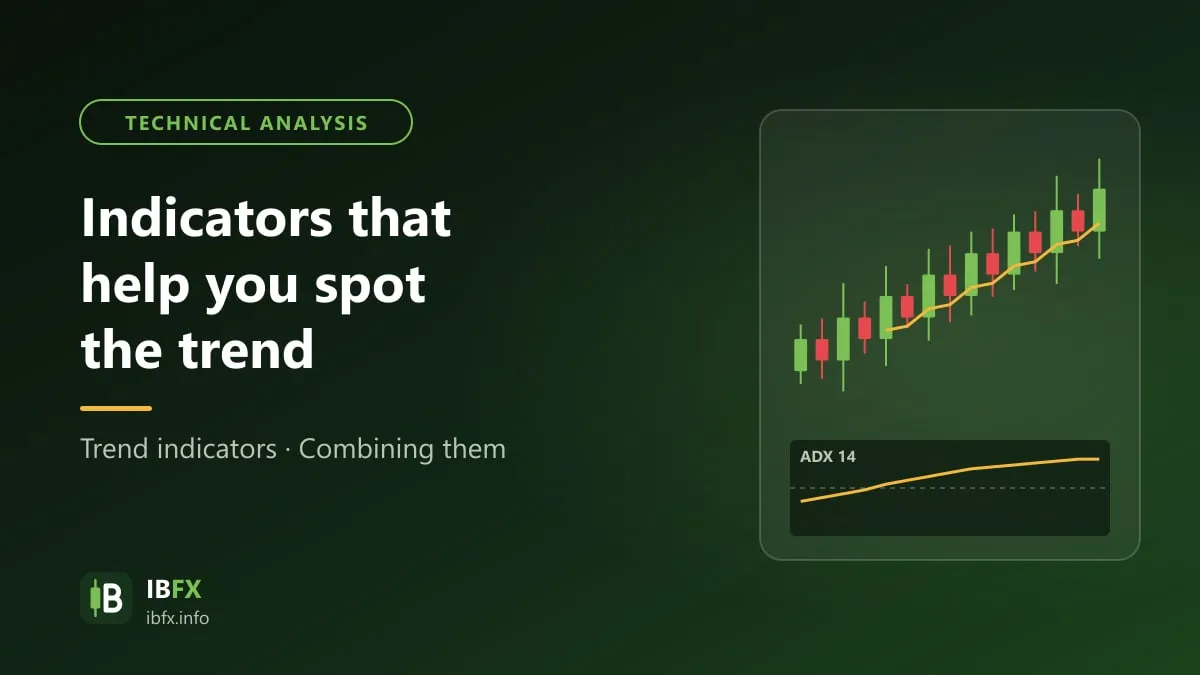
Among the tools named in this top 4, the moving average (MA) is the one that really is a trend indicator.
Among trend indicators, the MA is the simplest, the easiest to use and the most popular. Because it is so simple, the MA is one of the few indicators many price action traders keep on their chart. Read more: what the EMA is.
The MA does not only identify the trend and the momentum of the trend, it also gives entry and exit signals. Because the MA is a lagging indicator, though, the signals it produces lag behind the movement of price, so traders usually use this trend indicator only to identify the trend and the strength of the trend. Within that:
- A moving average with a longer period is used to identify the long-term trend
- A moving average with a short period is used to identify the strength of the trend
To identify the long-term trend, the most commonly used moving average is the MA 200:
- If most of the prices sit above the MA200, the market is in a long-term uptrend
- If most of the prices sit below the MA200, the market is in a long-term downtrend
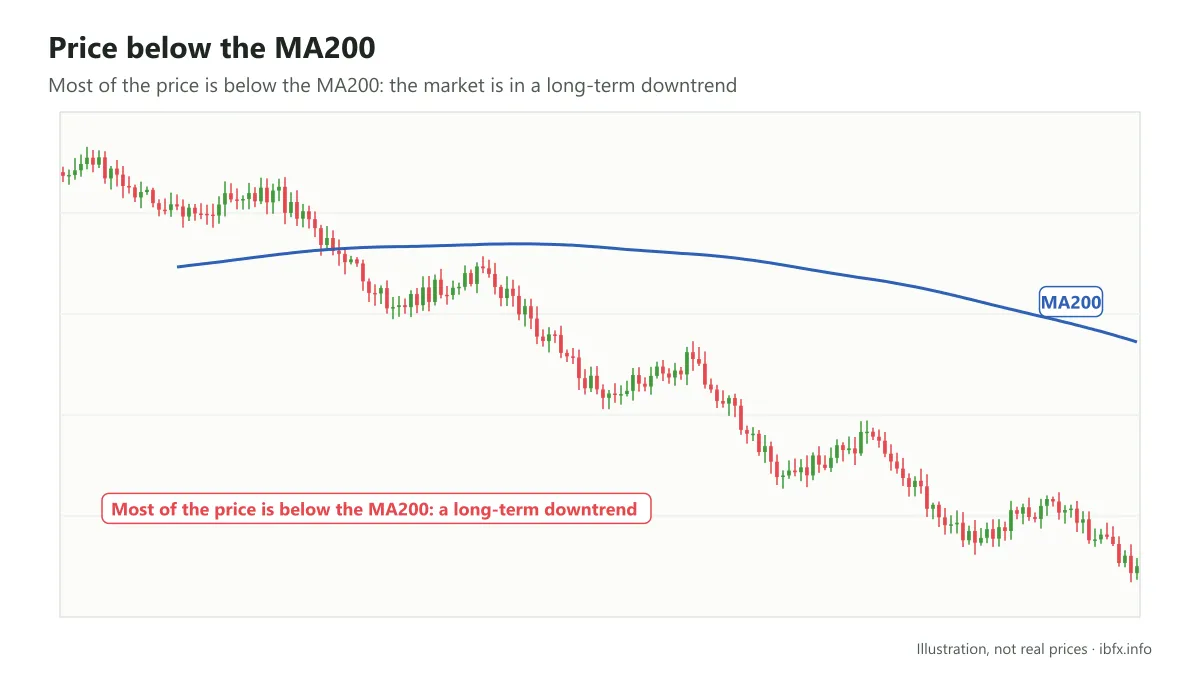
To identify the strength of the trend, you can use moving averages with a short period such as the MA20 or the MA50.
- If the market is in an uptrend and most of the prices sit above the MA20/MA50, the strength of the uptrend counts as strong. The shorter the period of the moving average that price holds above (the MA20 rather than the MA50, for example), the stronger the trend.
- If the market is in a downtrend and most of the prices sit below the MA20/MA50, the strength of the downtrend counts as strong
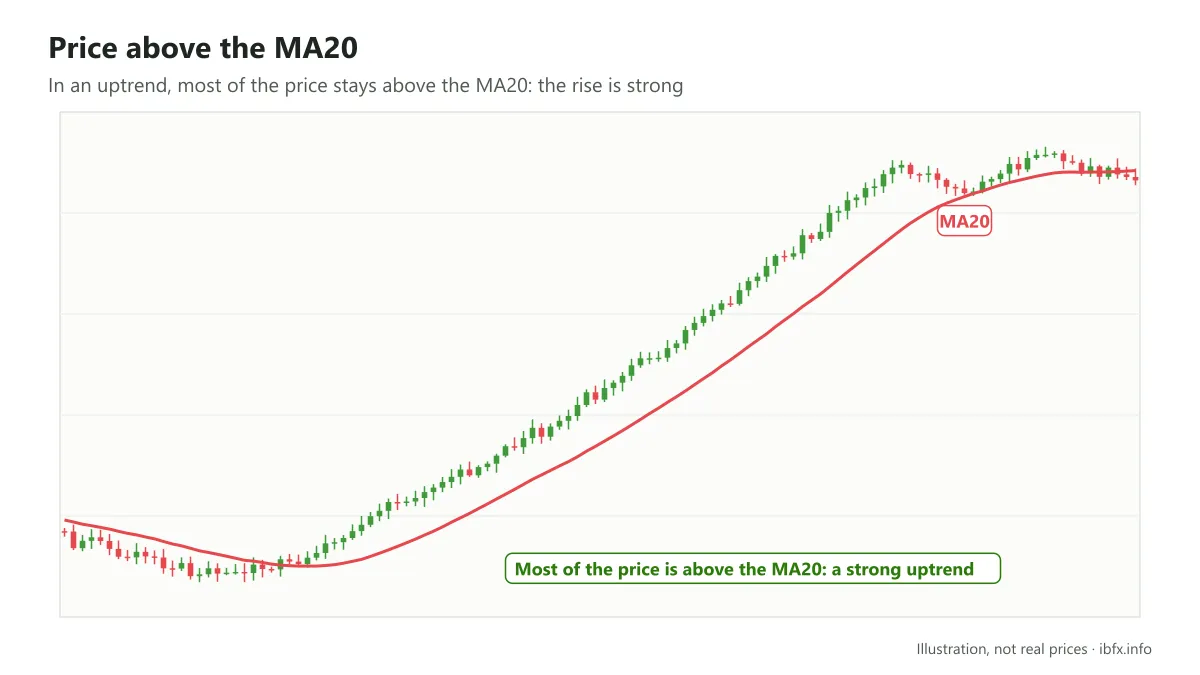
Although it is a trend indicator, the moving average only works well when the market has a clear uptrend or downtrend; if the market is going sideways, you are better off not thinking about this indicator at all.
How to identify and trade the trend “the way a pro trader does”
Do not think that pro traders use complicated analysis tools; for professional PA traders above all, simplicity comes first, but simplicity that works.
With the trend indicators introduced above, and with other trend indicators and analysis tools, there are a great many different ways to identify and trade the trend. Whichever tool you use, though, you have to settle the following 2 questions:
- First, what is the long-term trend?
- Second, what state is that trend in? In other words, what is the momentum or the strength of that trend?
Those are the 2 most important questions when you trade with the trend.
And as said above, there are a great many different ways for you to settle each of them; in this article we introduce one fairly common way of identifying and trading the trend, using only the tools introduced above.
Identifying the long-term trend
Among the tools above, the MA is the simple indicator for identifying the long-term trend, the MA 200 in particular.
- If most of the price sits above the MA200 → an uptrend
- If most of the price sits below the MA200 → a downtrend
Identifying the strength of the trend
A clear uptrend or downtrend can exist in 3 states:
A strong trend: in a strong uptrend, the buyers hold control and there is little or none of the pressure to sell. In a strong downtrend, the other way round, the sellers hold control and there is almost none of the pressure to buy.
To tell whether the market is in a strong trend, traders usually use a short-period moving average, the MA20 in particular.
- If most of the price sits above the MA20 → a strong uptrend
- If most of the price sits below the MA20 → a strong downtrend
And the sign of a strong trend is that price very rarely pulls back to this MA20, or does not pull back to it at all.
A steady trend: the strength of the trend is not too strong but not too weak either, and we will call it a steady trend for now. In a steady uptrend, selling pressure exists but the buyers still control the market; the selling pressure in a steady uptrend may come from some traders taking profit or from the bears looking for a way to turn the situation around. In a steady downtrend, the sellers still control the market when buying pressure appears.
To tell whether the market is in a steady trend, the MA50 is the level commonly used. In a steady trend, price will pull back to this MA50 a few times.
A weak trend: in a weak uptrend, both the buyers and the sellers are fighting for control of the market, but the buyers have somewhat the upper hand. In a weak downtrend, the other way round, the sellers are the slightly stronger side.
In a weak trend the pullbacks run deeper and tend to break out of the MA50, heading toward higher moving averages such as the MA100 or the MA200, while still keeping most of the prices above the MA200 (an uptrend) or below the MA200 (a downtrend).
Once you have read the market trend thoroughly, the next step is to set up a trading plan that works with the trend.
That is, with that trend and with the state the trend is in now, when do we enter and when do we exit?
Entry strategies when you trade with the trend
A strong trend: because price usually does not retrace, or retraces only shallowly, trading a pullback is very hard. So when the market trend is strong, you can run a breakout strategy or look for potential entries on smaller time frames.
In detail:
- In a strong uptrend, take a Buy when price breaks the most recent swing high before it (which is acting as resistance), with a stop loss below the most recent swing low.
- In a strong downtrend, take a Sell when price breaks the most recent swing low before it (which is acting as support), with a stop loss above the most recent swing high.
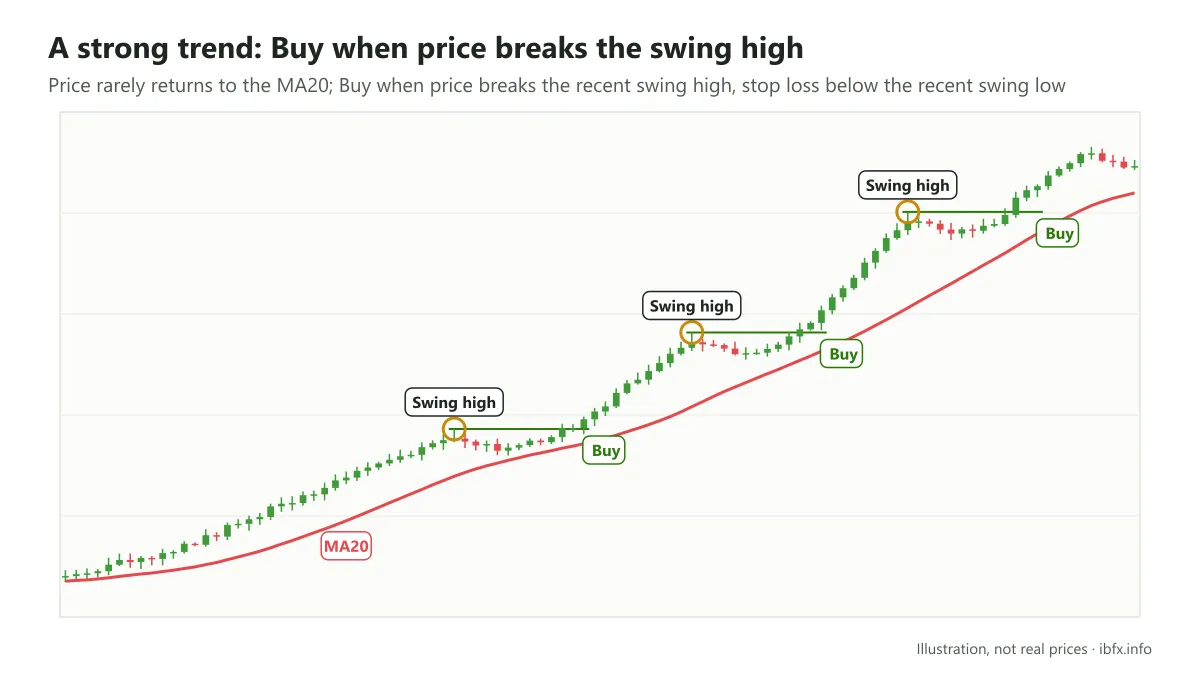
A steady trend: because the pullbacks are fairly ideal, you can trade the pullback by entering when price touches the MA50. A breakout strategy on the swing high/swing low levels, like the one for a strong trend, is not bad on a steady trend either, but is your mindset solid enough to sit through the retracement back to the MA50?
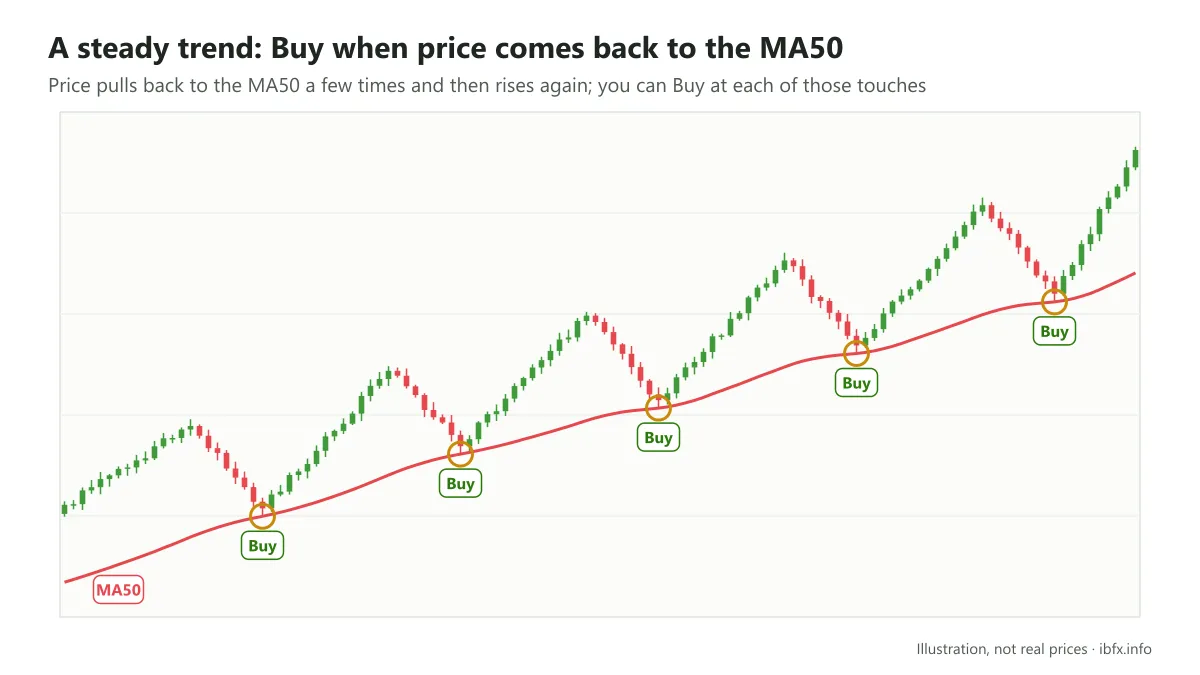
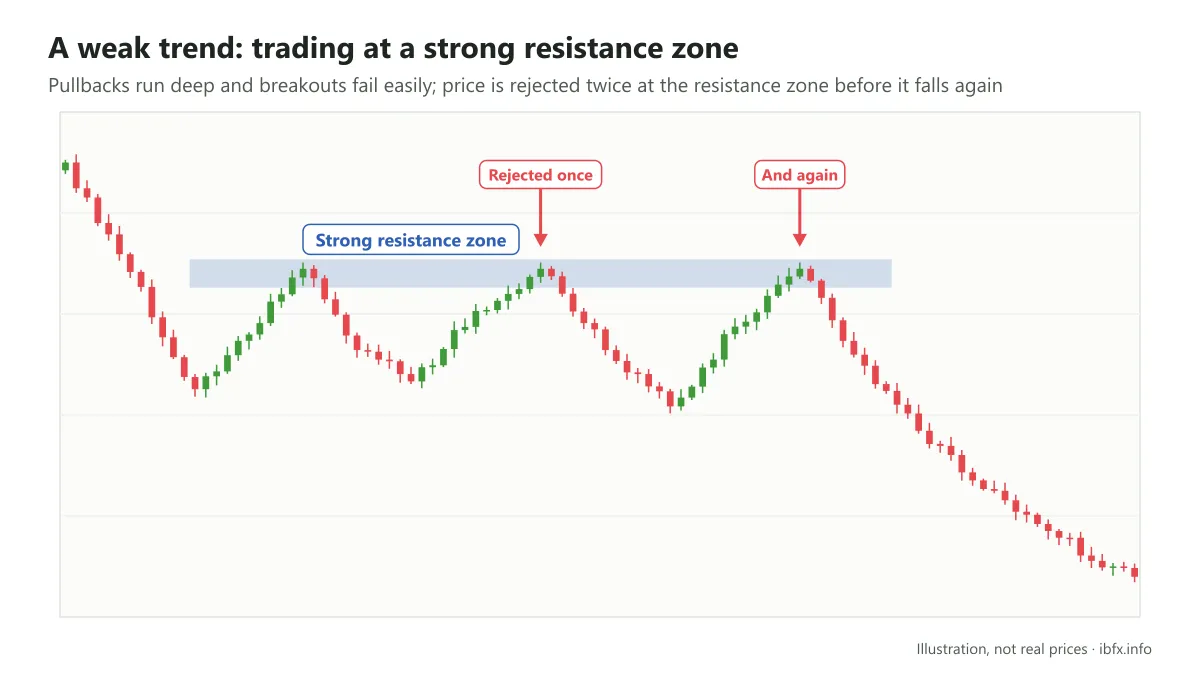
A weak trend: in a weak trend the pullbacks run quite deep, usually out past the MA50, and it is very hard to predict when that retracement will end. So a pullback entry strategy is very hard to carry out.
It is the same for a strategy of trading the break of a swing high/swing low, because in a weak trend, once price has broken out through a swing high (in an uptrend) it quickly comes back near the swing low before it, so breakout trading does not work well.
That is why, in a weak trend, the more suitable approach is to trade at strong support and resistance levels, or to stay out and wait for a clearer trend.
Exit strategies when you trade with the trend
Whichever exit technique you choose, remember that the reason to close a trade is that the condition which made you enter no longer holds.
Exiting with the structure of the trend
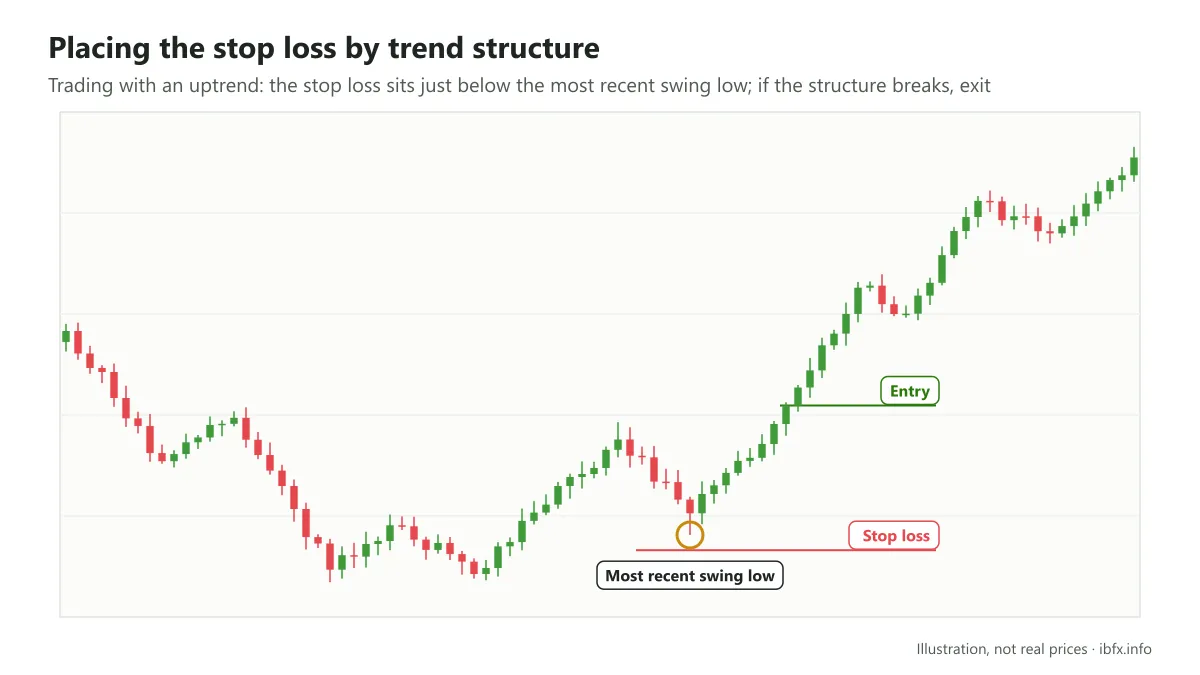
When the structure of the trend is broken, that is the moment your trend trading system stops being valid.
So if you trade with an uptrend the stop loss can sit just below the most recent swing low; the other way round, if you trade with a downtrend the stop loss sits just above the most recent swing high.
Exiting with the moving average
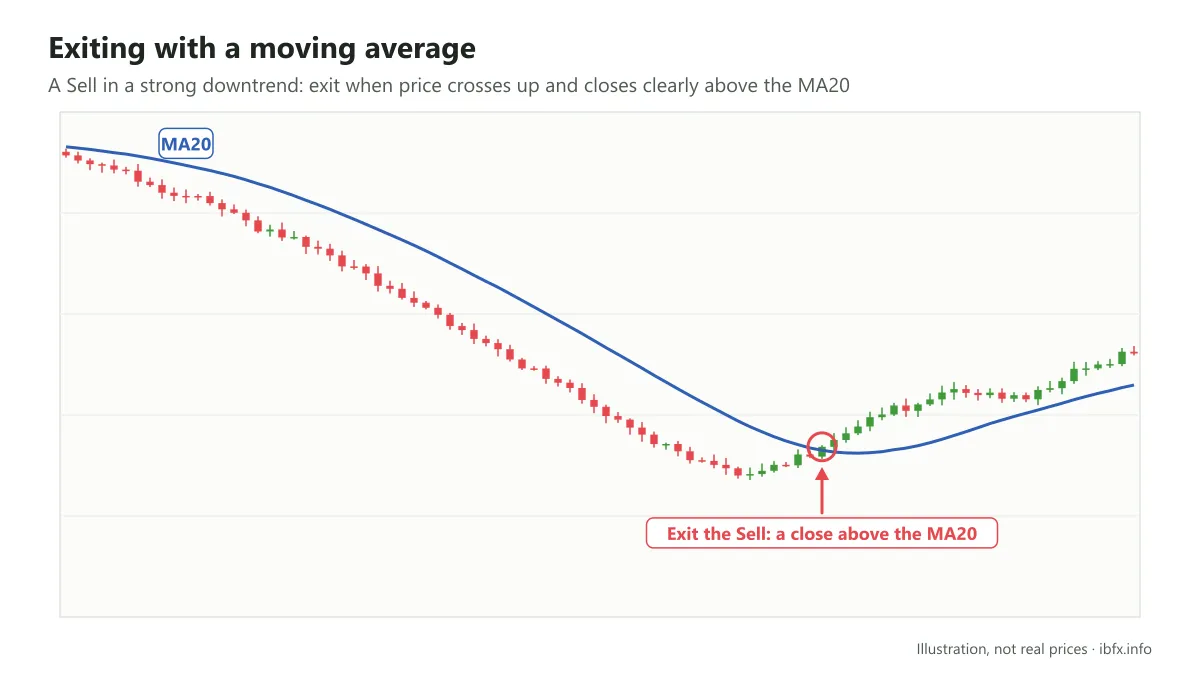
If you use the MA to identify the trend and to trade with the trend, then when the condition on this indicator no longer fits the current trend, that is the moment your trade should stop.
In detail:
- In a strong trend: exit when price crosses down and closes clearly below the MA20 (for a Buy), and exit when price crosses up and closes clearly above the MA20 (for a Sell)
- In a steady trend: exit when price crosses down and closes clearly below the MA50 (for a Buy), and exit when price crosses up and closes clearly above the MA50 (for a Sell)
Exiting with the trendline
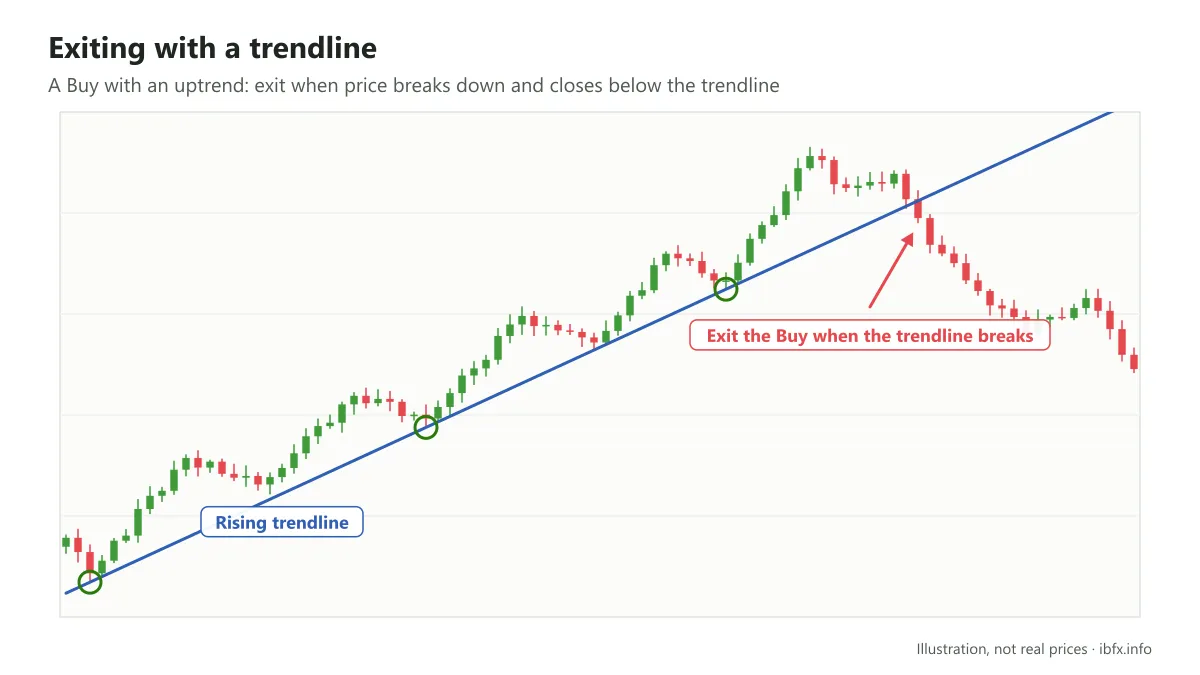
The moving average used in a trend trading strategy is treated as a support or resistance level, and a trendline is treated the same way. So the way you exit with a trendline works just like the way you exit with a moving average.
Conclusion
We hope this article helps you understand the market trend more deeply. Of course you cannot become a pro trader straight away, but for a new trader struggling to “catch the right trend”, the principles above are a good foundation to practice on. Always place a stop loss and test on a demo account before you trade for real.