On this page
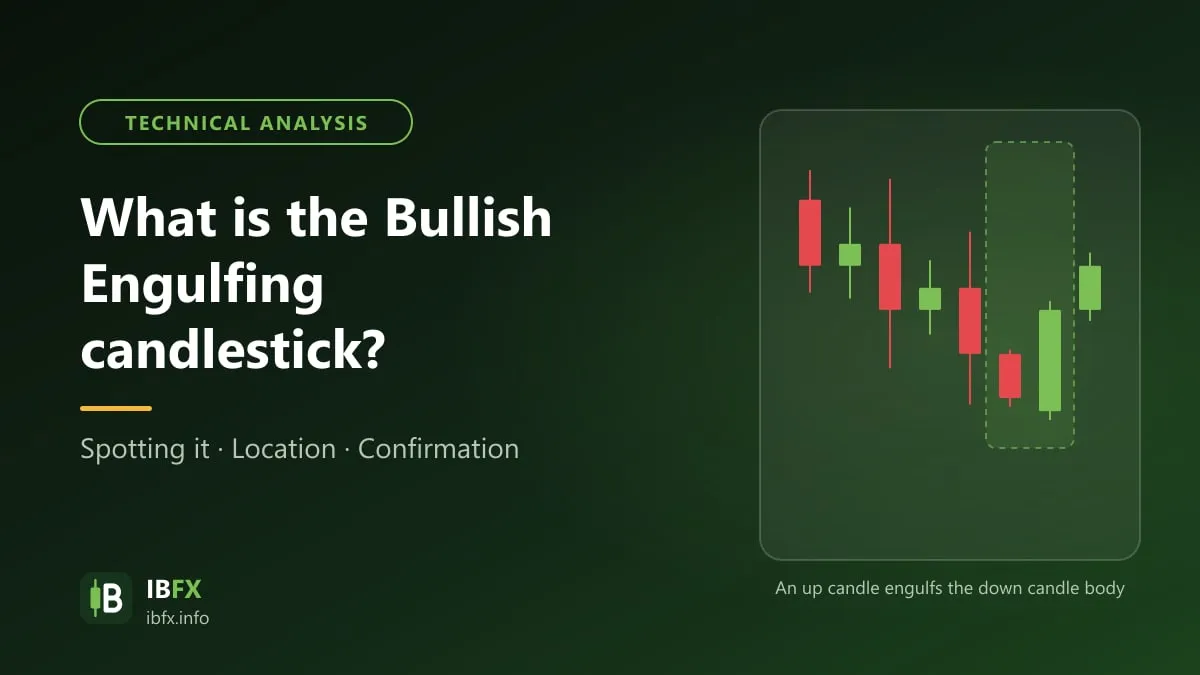
The bearish engulfing pattern, or Bearish Engulfing, together with the bullish engulfing pattern, Bullish Engulfing, makes a pair that traders are very fond of when they trade forex. In an earlier article we introduced the bullish engulfing pattern, Bullish Engulfing; in this one we will take you through the other half of the pair, the bearish engulfing pattern, Bearish Engulfing. Read on.
What is the bearish engulfing pattern (Bearish Engulfing)?
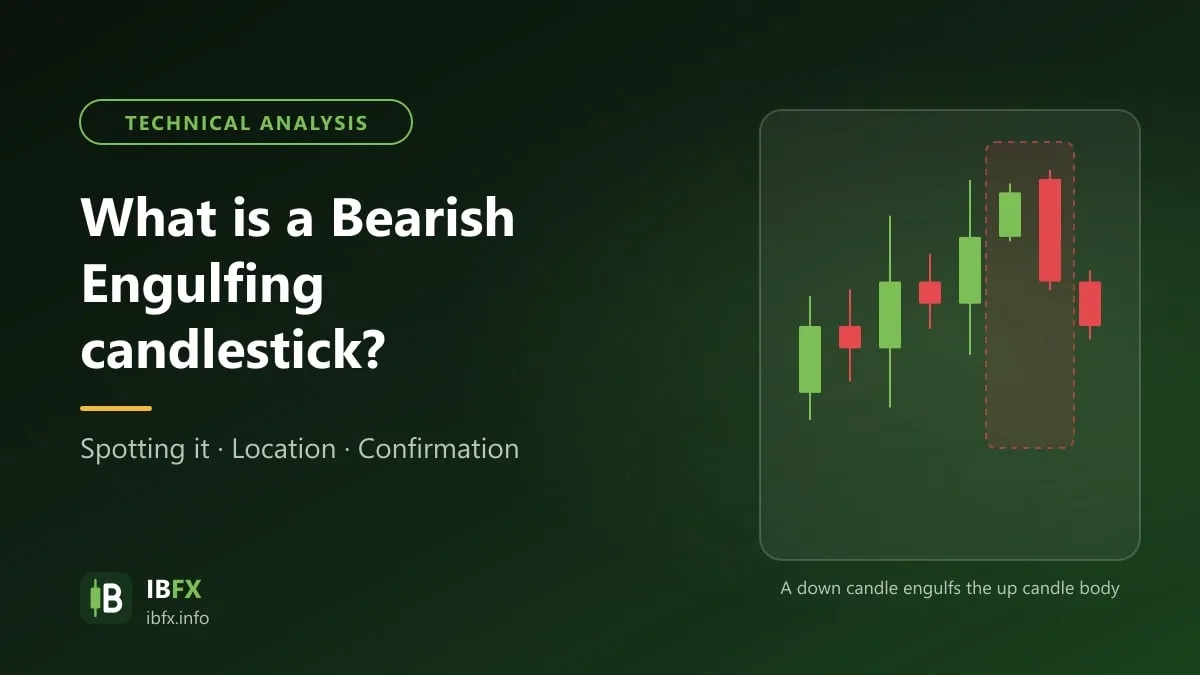
In much the same way as the bullish engulfing, the bearish engulfing appears after a rise in price. It is a group of 2 candles: a small green candle (a bullish candle) followed by a large red candle (a bearish candle) whose body covers the whole body of that green candle. You can see it more clearly in the example below:
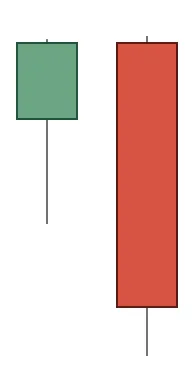
Looking at the pattern above, you can see why it is called a bearish engulfing pattern, can you not? The red candle behind has completely covered and swallowed up the green candle in front. Note as well that for the bearish engulfing pattern to be clear, the close of the second candle should sit below the open of the first candle.
In practice, what stands behind the Bearish Engulfing pattern is price action showing that selling overwhelmed buying during the session, wiping out the whole gain of the candle before it.
How to recognize the bearish engulfing pattern properly
The size of the small bullish candle in front can vary, but the most important thing is that its body has to be entirely engulfed by the next candle. When that first small candle is a doji it is usually seen as a clearer signal, reflecting the market’s lack of conviction before sellers take over.
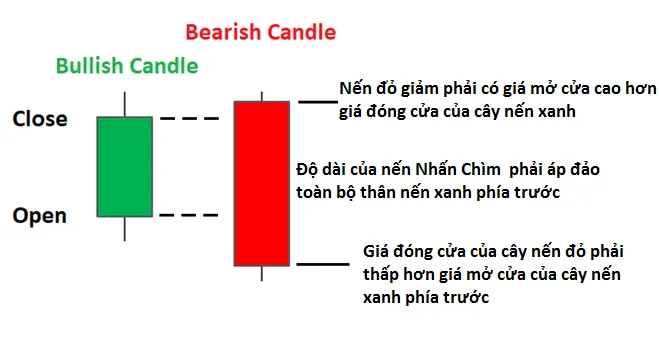
The screenshot shows the Vietnamese interface; the buttons and labels sit in the same places in the English version.
The second candle, for its part, has to be a long red candle which, by the original definition, has an OPEN higher than (or equal to) the CLOSE of the green candle before it. In forex the next candle usually opens right at the close of the one before it, so the main condition is that the red body engulfs the green body. The longer the following candle, the clearer the bearish signal.
Beyond that, the engulfing pattern usually forms as a group of 2 candles, but in some cases it is built out of 3 candles, as in this example:
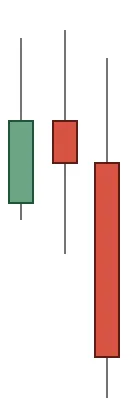
The three-candle pattern above shows why the bearish engulfing is watched by so many traders: the first small green candle (a bullish candle) is followed by two red candles (bearish ones), and the whole body of the green candle has been engulfed entirely inside the body of the red candle. The explanation for this is that buyers had grown too weak to push price up any further, which let sellers take complete control of the situation and drive price down.
Note carefully: the bearish engulfing pattern, Bearish Engulfing, is a signal that price may keep falling; how far and for how long it falls depends on the timeframe and on the market context.
The pattern is usually more reliable when the market is in a downtrend and is rallying back up, and then a bearish engulfing pattern forms.
At that point the bearish engulfing shows that the rally may have run its course and that price may carry on falling with the main trend.
How to set the entry and the stop loss on the Bearish Engulfing pattern
Setting the entry, the stop loss and the take profit on the bearish engulfing pattern, Bearish Engulfing, has a good deal in common with some of the reversal patterns we have introduced before.
Entry: to find an entry you can wait until price breaks below the low of the red candle in the engulfing pattern, so that you have more confirmation that price is falling before you enter.
Stop loss: a point above the highest wick of the pattern; better still, look at whether the candles alongside it make up a resistance zone, and if they do, put the stop a small distance above that resistance zone. Work out your position size from the stop loss distance so that each trade only risks a small part of the account.
Take profit: if the engulfing candle is the start of a long fall, you can use a trailing stop to hold on to the profit; or you can simply set the target at the nearest support levels.