On this page
- What is a reversal candlestick pattern?
- Why learn the reversal candlestick patterns by heart?
- How many reversal candlestick patterns are there?
- Bullish reversal candlestick patterns
- Bearish reversal candlestick patterns
- Other advanced reversal candlestick patterns to know
- A strategy for trading the reversal candlestick patterns
- Trading rules for the reversal candlestick patterns
The reversal candlestick pattern is one of the tools traders reach for most often to read the mood of the market.
Reversal candlestick patterns are an important part of technical analysis, and they give a trader more to go on about 2 things:
- The current trend may be about to end
- A sensible moment to consider entering or exiting a trade
If complicated indicators have worn you out, try to commit to memory the whole set of reversal candlestick patterns we set out below. These reversal candle patterns will help you read the buying and selling mood on the chart, and know when to be careful and when you can look for an opportunity.
What is a reversal candlestick pattern?
A reversal candlestick pattern is a set of candles put together to make a particular shape, and through that shape it hints to a trader that the trend may turn from up to down, or the other way round, from down to up.
Why learn the reversal candlestick patterns by heart?
In a market as volatile as forex, the direction of price is also a way of reflecting the trading mood at that moment. As Dow theory once pointed out, there is no market that rises forever, and no market that falls forever. So while price is on the move there will be a process of changing over from falling to rising, or from rising to falling, also known as a market trend reversal.
Of course these changes happen gradually, and they show up in many different forms. Every trader treats this as the key point at which to close a trade or open a new one. In practice there are a great many reversal patterns in use today. What a trader has to do is understand the common patterns correctly and use them in the right context, alongside risk management.
Things to keep in mind when you use reversal patterns:
- In this article we only pick the most common reversal patterns. Even so, no pattern is right all the time; always put it together with the context of the trend, the support and resistance areas, and place a stop loss.
- To get the most out of a pattern, you should put it together with indicators, trendlines, resistance and support levels, moving averages and so on.
- There are 2 kinds of reversal candle group: the bullish reversal and the bearish reversal. You should be clear about where the candle patterns sit, and work out the trend, before you use a pattern.
- Beyond the 3 forms of reversal pattern — the single-candle reversal, the double reversal (2 candles) and the 3-candle reversal — you should also pick up a few of the more advanced patterns we mention at the end of this article.
How many reversal candlestick patterns are there?
There are as many kinds of reversal candlestick pattern in the financial markets as there are stars in the sky!
That is putting it a bit strongly, but even a quick count runs to dozens of reversal candlestick patterns mentioned in the literature on Japanese candlesticks. Basically, though, there are two kinds of trend reversal pattern: bearish reversal candlestick patterns and bullish reversal candlestick patterns.
A bearish reversal candle group is used to show that an uptrend may be coming to an end, to be replaced by a downtrend about to form. A bullish reversal candle group carries the opposite meaning, pointing to a downtrend about to end, to be replaced by an uptrend about to form.
The bullish reversal candlestick patterns to know:
- Dragonfly Doji
- Bullish Engulfing
- Piercing Pattern
- Bullish Harami
- Hammer
- Inverted Hammer
- Morning Star
- Bullish Abandoned Baby
The bearish reversal candlestick patterns to know:
- Gravestone Doji
- Bearish Engulfing
- Shooting Star
- Evening Star
Bullish reversal candlestick patterns
Dragonfly Doji
The first candle in the reversal Doji family is the Dragonfly Doji. Since we are on the subject of this candle, let us look at the Doji first.
The Doji is one of the most common candles because of its distinctive shape, which is very easy to spot. With the body shrunk down and sitting in the middle, showing that the close and the open are equal, it looks rather like a cross. A Doji usually appears after a long move down or a long move up, or sometimes in a sideways market.
The reason for that is that, in terms of psychology, a Doji stands for the hesitation between buyers and sellers: when this candle forms, it shows the tug of war between the bullish side and the bearish side.
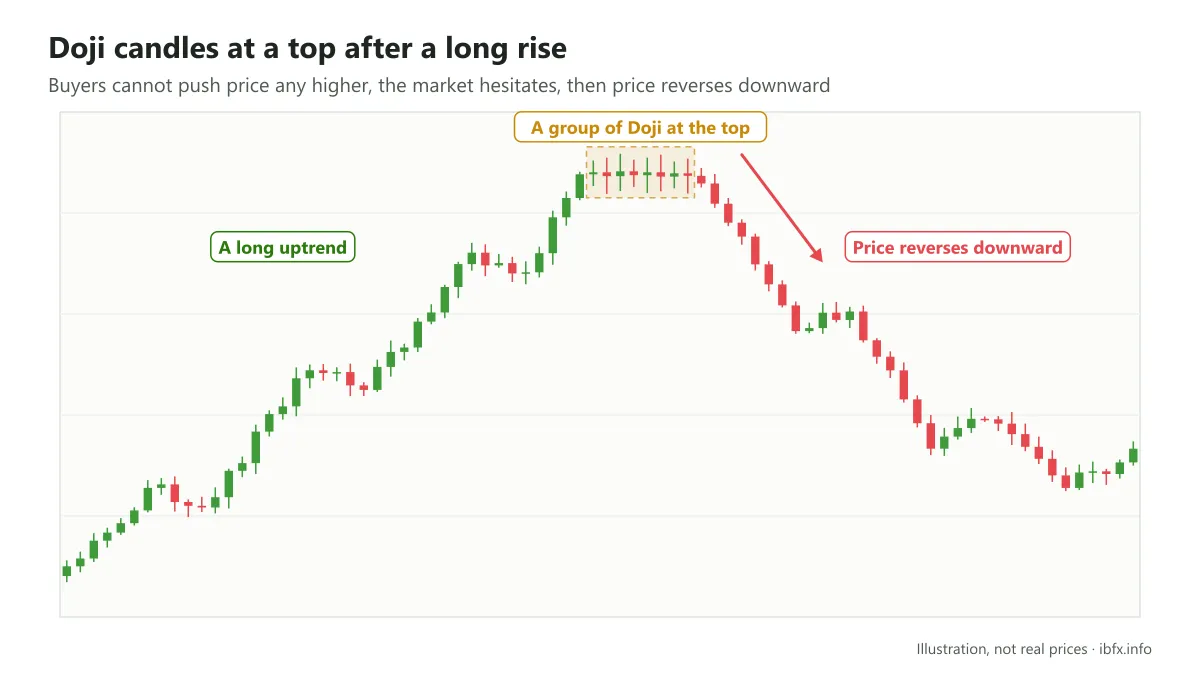
And that is also why a Doji does not only appear at the end of a downtrend but turns up in an uptrend as well. That is easy enough to understand: after a long uptrend or downtrend, the winning side starts to tire. That creates the hesitation, so when a Doji appears it shows that the market needs a rest. And it is also a sign that the market may look to set up a new trend.
Looking at the example above, you will see a reversal Doji, because it sits at the top, after a long rise in price. It shows that buyers seem unable to keep overwhelming sellers, so a reversal can easily happen, and in the end sellers came out on top, price began to fall, and a new trend formed.
Basically there are 4 main kinds of Doji: the standard Doji, the Gravestone Doji, the Dragonfly Doji and the long-legged Doji. Of these, the Gravestone and the Dragonfly carry the clearest reversal meaning; the standard Doji and the long-legged Doji lean more towards indecision, which is how the article on the Doji candlestick sorts them.
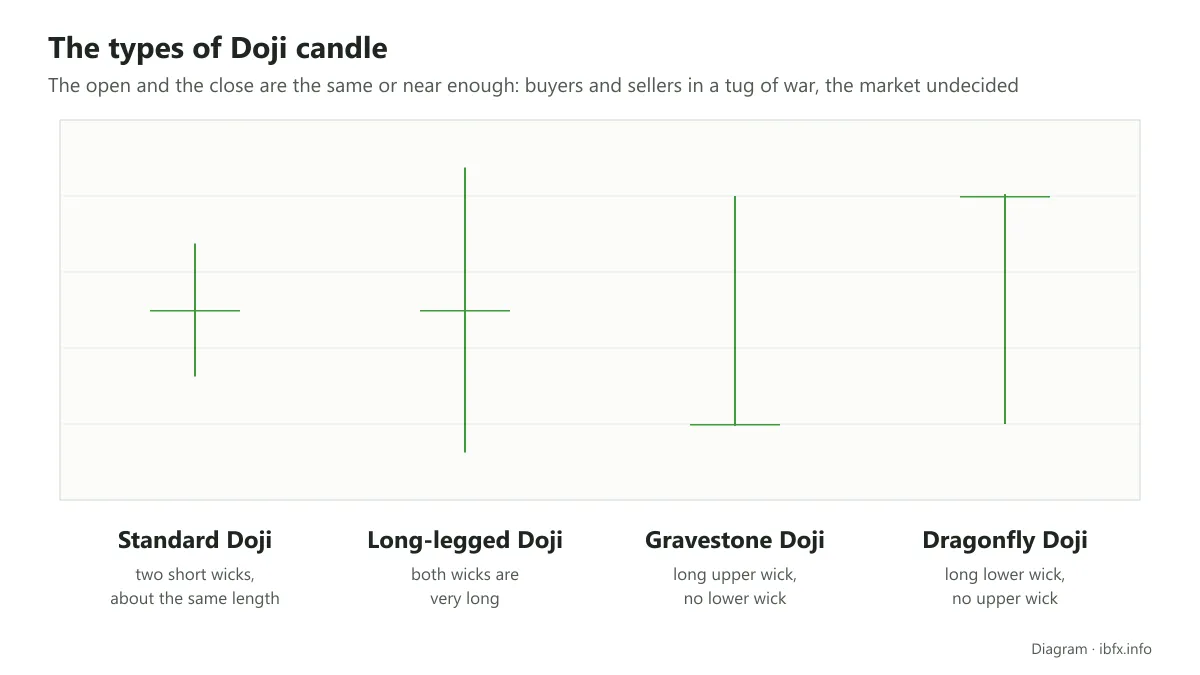
For a bullish reversal pattern, the Dragonfly Doji is the one of those 4 Doji shapes in the picture above that you should pay the most attention to.
What marks out the Dragonfly Doji
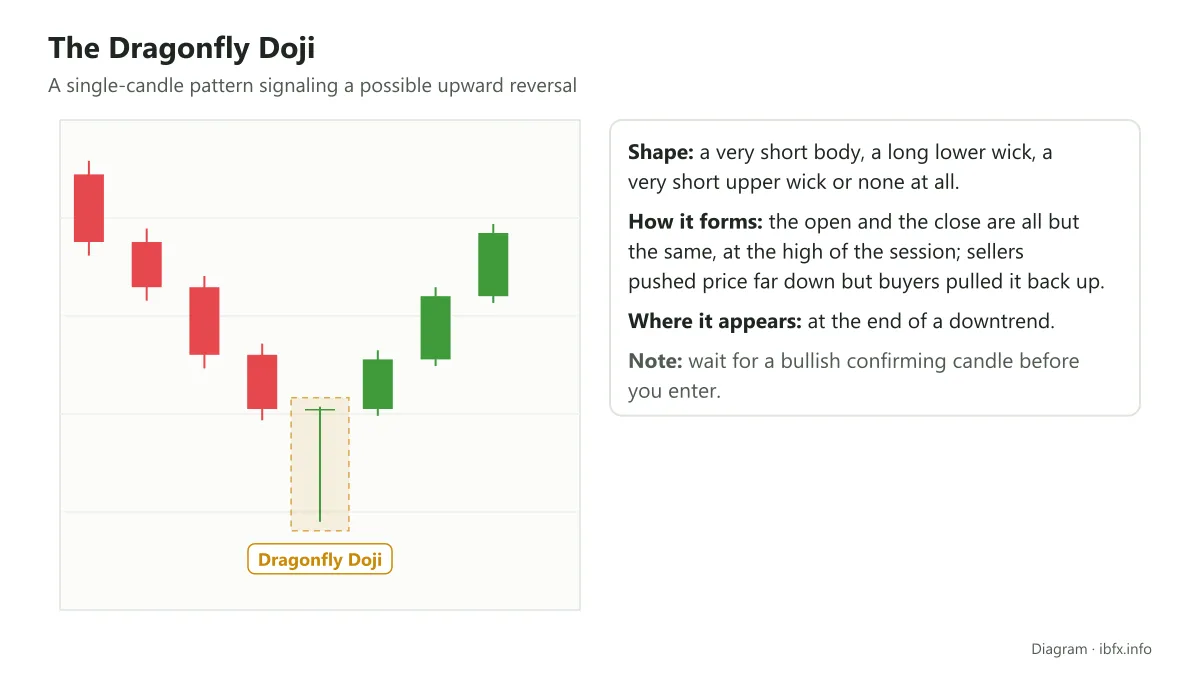
- Where it appears: at the end of a downtrend.
- A short body.
- A long lower wick, with no upper wick or a very short one.
The Dragonfly Doji is made when the open and the close come out the same and are also the high of the session. So when a Dragonfly Doji forms at the end of a downtrend, it shows a fight between buyers and sellers. Early on, sellers may well have had the upper hand, taking control and pushing price down very low. But by the end of the session buyers had worked price back up to take control of the situation, and the close came out as the high of the session as well.
Because sellers pushed down at first and seemed to have succeeded, but then buying pressure came in, the candle pulls its feet back up and leaves a lower wick as long as the body and tail of a dragonfly. The longer the lower wick, the clearer the rejection of the low prices; even so, you should wait for a confirming candle before you conclude that the trend is reversing.
Bullish Engulfing
Like the Dragonfly Doji, the Bullish Engulfing pattern also appears at the end of a downtrend. Do note that this candle pattern only carries a reversal meaning when it comes after a fall in price. In particular, when a Bullish Engulfing sits right in a support area, the signal counts for more.
Bullish Engulfing means the engulfing candle on the up side; the opposite of it is the bearish engulfing, which you can read about in the section further down.
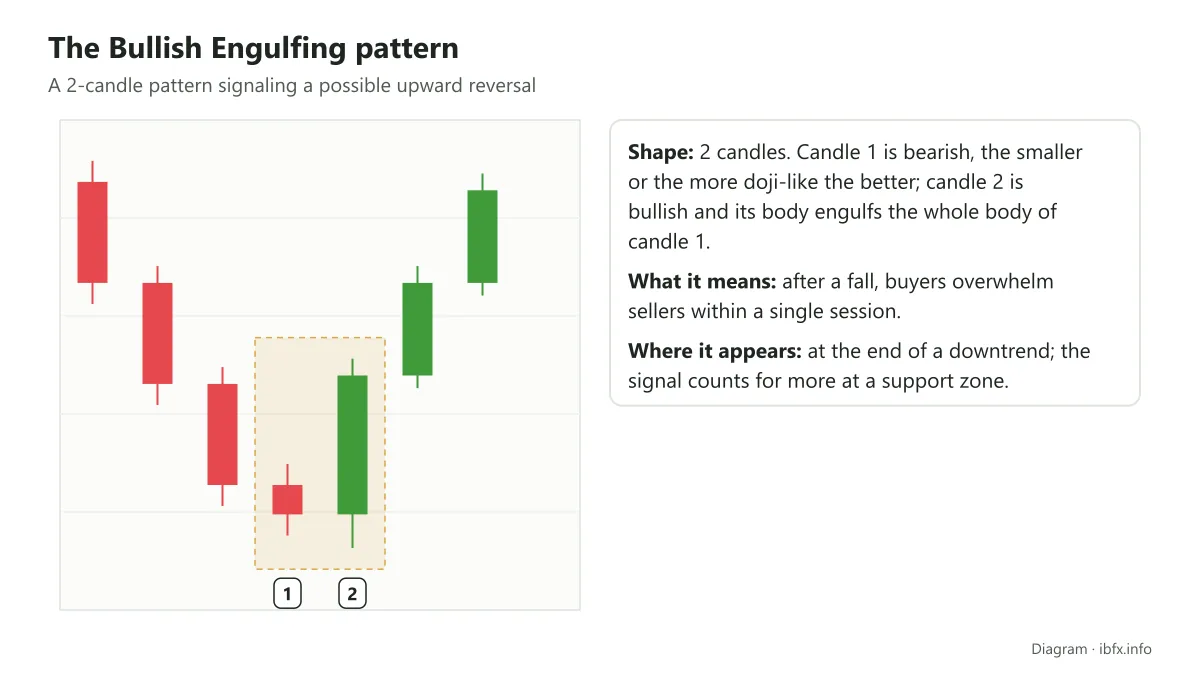
This is a 2-candle pattern rather than a single candle like the Doji. For it to form in the true sense of the word, one candle has to cover the whole of the other, and the second candle is usually a great deal longer than the first.
What marks out the Bullish Engulfing:
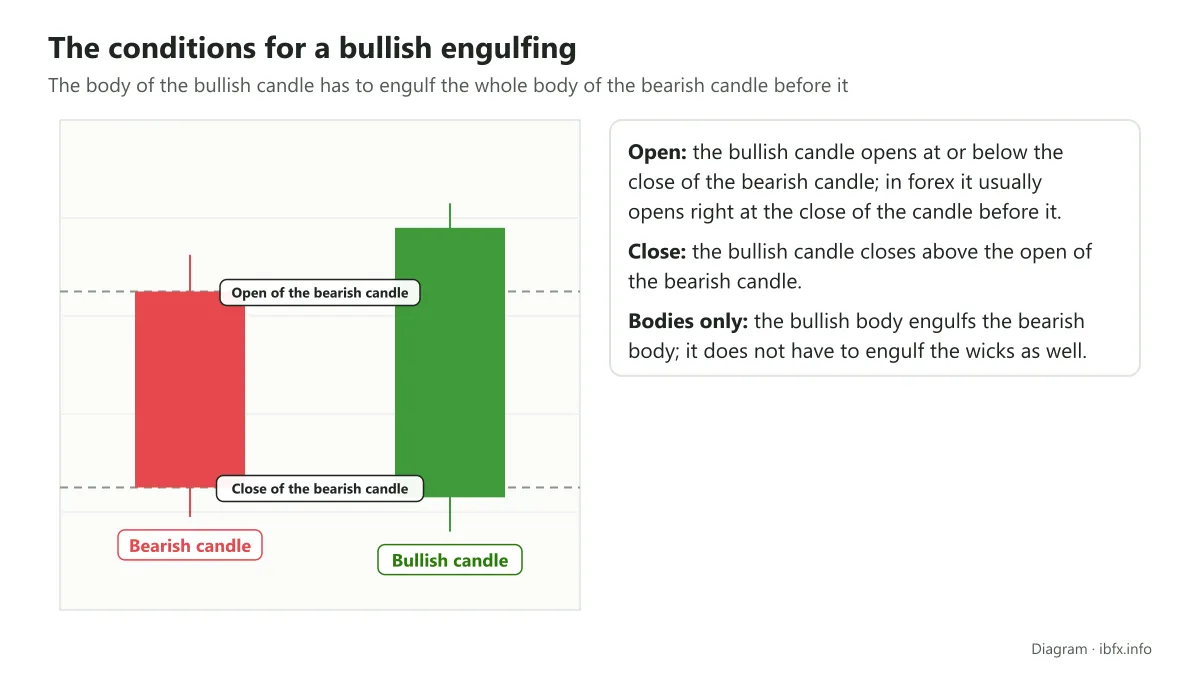
- It appears at the end of a downtrend.
- The first candle is a bearish candle.
- The second candle is a BULLISH candle covering the whole body of the first candle. It only has to cover the body; it does not have to cover the wicks as well.
- The reversal signal is clearer when the red candle is a doji.
What the Bullish Engulfing means
After a sharp fall, it feels rather like a downpour after a drought. And when a bullish candle appears with a large body that feels as though it swallows the red candle before it whole, that is what gives the Bullish Engulfing its strong reversal meaning.
Beyond that, when the green bullish candle appears it can show buyers pouring into the market to block the fall and gather momentum to push price up. Once the green candle ends, a good many traders will want to work out once more whether this really is the start of an uptrend, and for that reason they may push price down to the main support areas and act against that rising price behavior. Sellers, though, seem not to have the strength to push price any lower, so in the end more green candles keep forming. And that is the moment that confirms an uptrend is about to begin.
An example of the Bullish Engulfing reversal candlestick pattern:
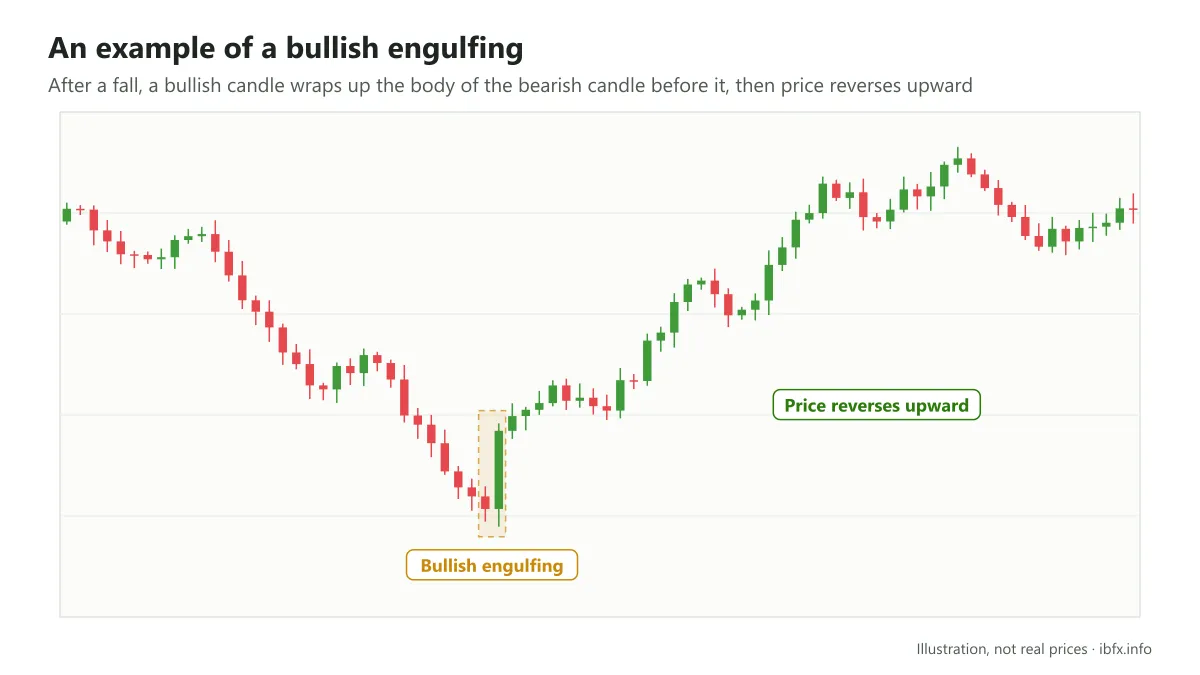
As you can see, the first candle has been wrapped up completely by the second, and after the Bullish Engulfing pattern was set, price reversed upward.
Piercing Pattern
It forms at the end of a downtrend and is a 2-candle pattern much like the bullish engulfing we introduced earlier.
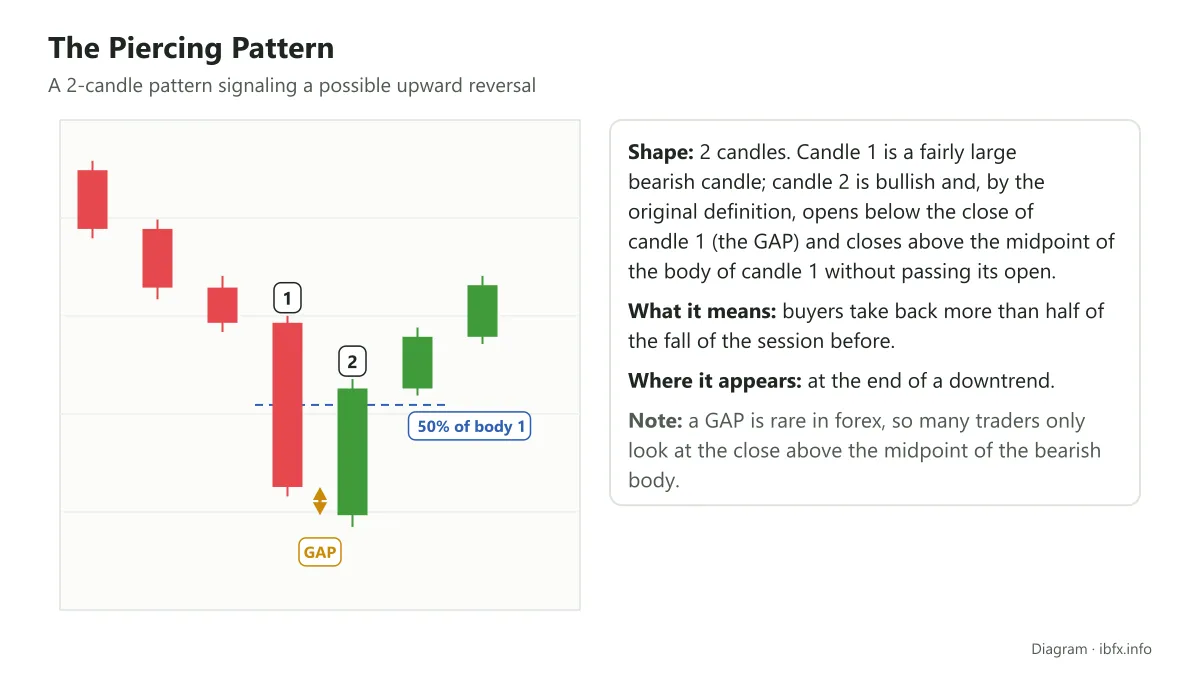
What marks out the Piercing Pattern
- It sits at the end of a downtrend
- It is made of 2 candles
- Candle 1 is a fairly large bearish candle
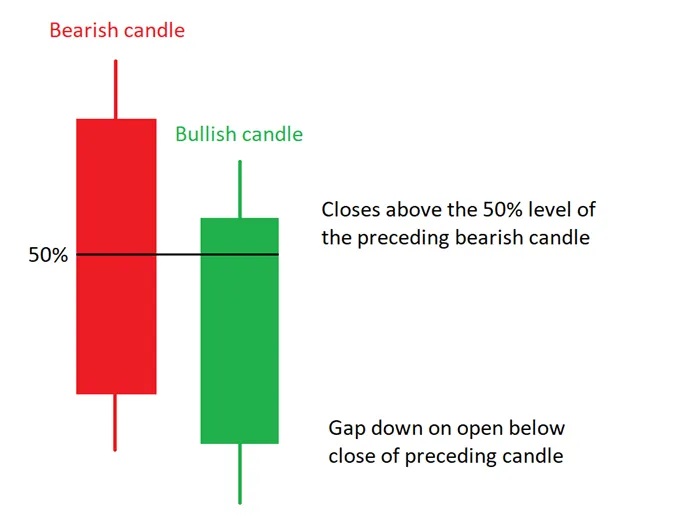
- Candle 2 is a bullish candle which, by the original definition, opens below the low (or the close) of candle 1, creating a downward price gap (marked GAP in the picture).
- The bullish candle (candle 2) closes above the midpoint of the body of the first red candle, but has not passed the open of that red candle (if it does, the pattern becomes a bullish engulfing).
- Note: in forex the next candle usually opens right at the close of the one before it, so a gap is rare; many traders only look at the condition that the bullish candle closes above the midpoint of the bearish body.
What the Piercing Pattern means
At the end of a sharp downtrend there are of course still red candles appearing, and in this case a large red one. The next session opens with a downward gap, as though sellers were carrying on in control. But then the bulls take back control, push price up again and close above the midpoint of the body of the red candle before, taking back more than half of the fall of the session before.
That is why the Piercing Pattern shows that the bulls may be taking charge; and if the next candle is bullish as well, the upward reversal signal is confirmed more clearly.
An example of the Piercing Pattern
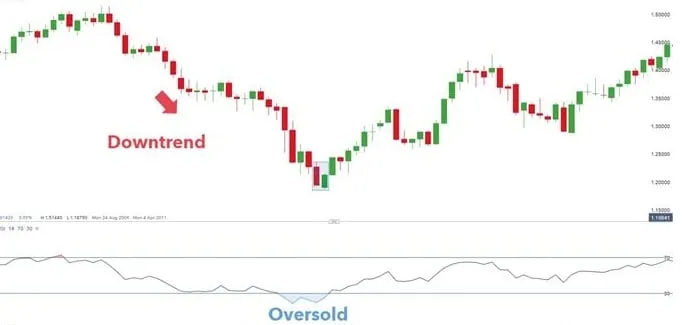
You can see on the EUR / USD weekly chart above the presence of a Piercing Pattern, which has been circled. Before this pattern came a sharp downtrend making lower lows and lower highs.
The RSI indicator was used alongside it as extra confirmation of the reversal. From the chart, the RSI shows an oversold signal, which adds to how much the reversal from the Piercing Pattern is worth.
Bullish Harami
Bullish Harami is a two-candle pattern that usually appears at the end of a downtrend, warning that a reversal may be possible. The first candle is a long red one, the second smaller and usually green. The open and the close of the green candle both sit inside the body of the red candle (in the stock market the green candle usually opens above the close of the red candle). The word “Harami” in Japanese means pregnant.
What marks out the Bullish Harami
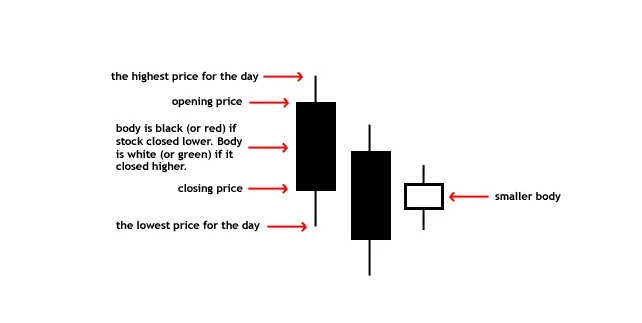
- In the Bullish Harami, candle 1 is a long red candle.
- Candle 2 is a green candle, a bullish candle.
- The body of the second candle sits neatly inside the body of the first, like a baby inside its mother.
What the Bullish Harami means
After a sharp downtrend has taken hold, a long red candle closes as expected. In the next session price does not keep falling but moves within the range of the red body, and the green candle closes below the open of the red candle. That shows the fall has stalled, and the bearish side starts to worry that the bullish side is taking back control. If one more bullish candle stands right after the Bullish Harami, the reversal signal is confirmed more clearly and you can consider a Buy order, with the stop loss below the low of the pattern.
The Hammer candle
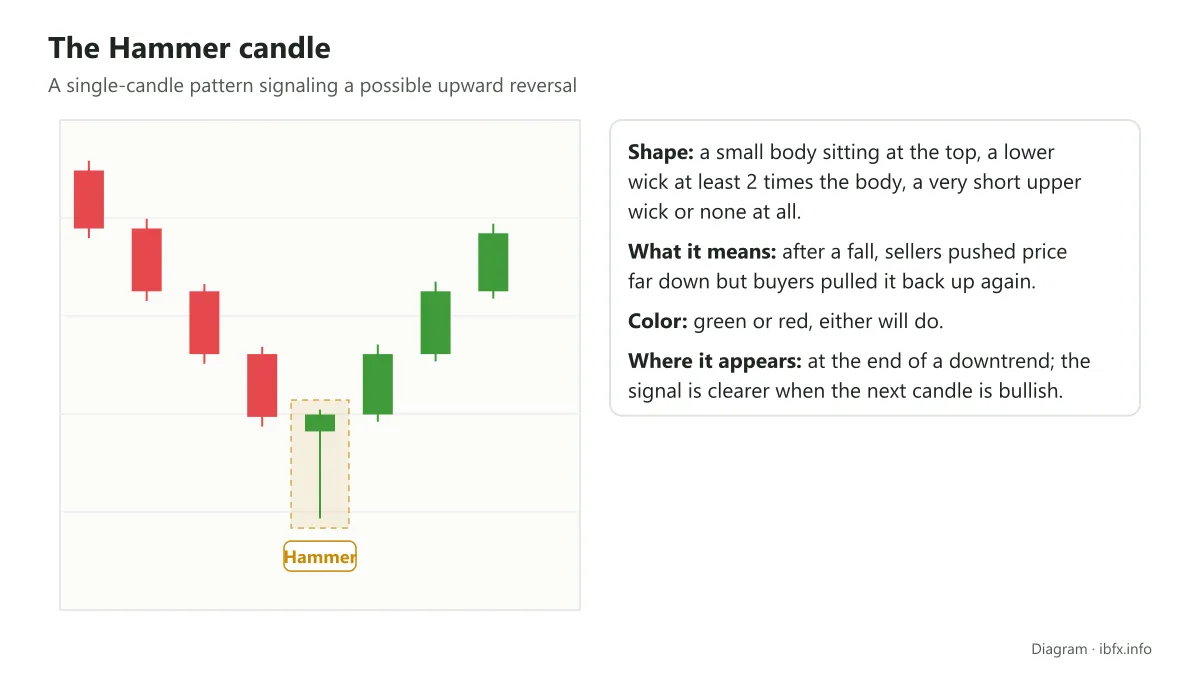
The Hammer is the next single candle that traders use to look for a sign of a reversal. The hammer is rather like the doji in having a small body and a long wick, but the body does not sit in the middle of the candle.
With the Hammer the body sits at the top of the candle, the upper wick is very short or absent, and the lower wick is very long (with the inverted hammer it is the other way round: the body is at the bottom and the upper wick is long).
An example of the Hammer candle:
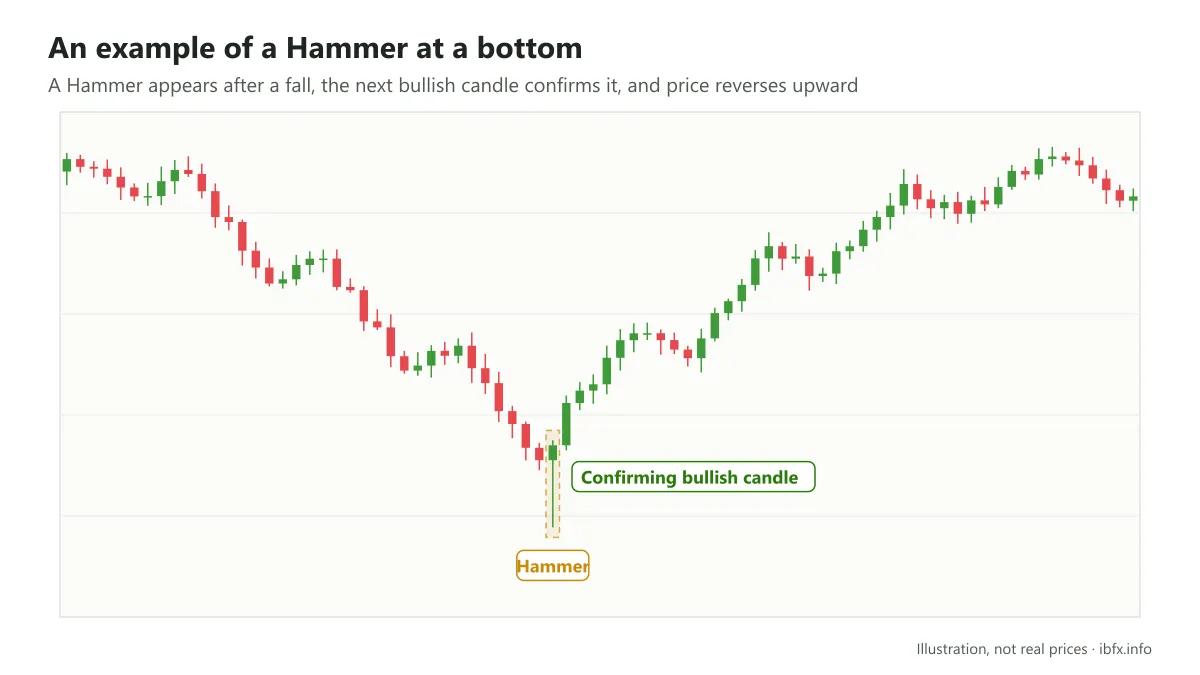
Looking at the illustration above, you will see that the Hammer only means something with the context that comes with it, that is, it has to appear after a fall in price. In particular, the color of the candle does not change what the Hammer does. There are four candles of much the same shape, told apart by where the body sits and the context in which they appear:
- Hammer: a small body at the top, a long lower wick, appearing after a fall in price, a sign that price may reverse upward.
- Inverted Hammer: a small body at the bottom, a long upper wick, also appearing after a fall in price and a sign that price may reverse upward.
- Hanging Man: the same shape as the Hammer but appearing after a rise in price, a signal that price may reverse downward.
- Shooting Star: the same shape as the Inverted Hammer but appearing after a rise in price; the long wick at the top end is a sign that price may reverse downward.
The Inverted Hammer
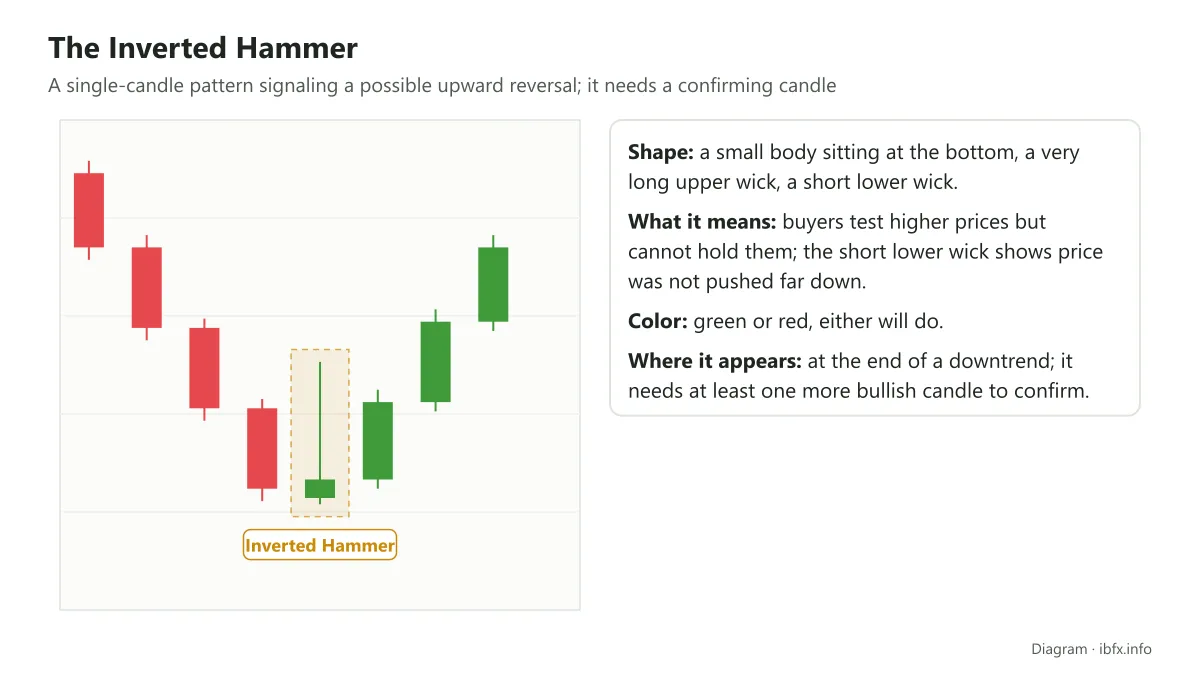
The Inverted Hammer gives an upward reversal signal, and this pattern is usually not used on its own: it needs at least one more candle after it.
If you already know the Hammer pattern, you may be surprised to see that the Hammer and the Inverted Hammer both give an upward reversal signal, even though they are complete opposites, just as their names say, one candle pointing its tail down and the other holding its tail up high.
With the psychology behind them, though, both of these patterns really do give a bullish signal. Of course how reliable they are and how they are used differ.
What marks out the Inverted Hammer
- A small body, a very long upper wick, a short lower wick.
- It appears at the bottom of a downtrend.
- It can be a bullish or a bearish candle.
What the Inverted Hammer means
In a downtrend price keeps being pushed lower. When buyers have gathered enough energy, they push price higher for a short while. Buyers use all their strength to take price as high as they can. That action creates the long wick.
That rise, however, does not hold for long, and the market comes back near the open. Beyond that, the short lower wick shows that price could not be driven too far down either, because of the strong defense put up by buyers. The Inverted Hammer pattern shows the market beginning to feel out the prices above, wanting to push price higher still.
The Morning Star
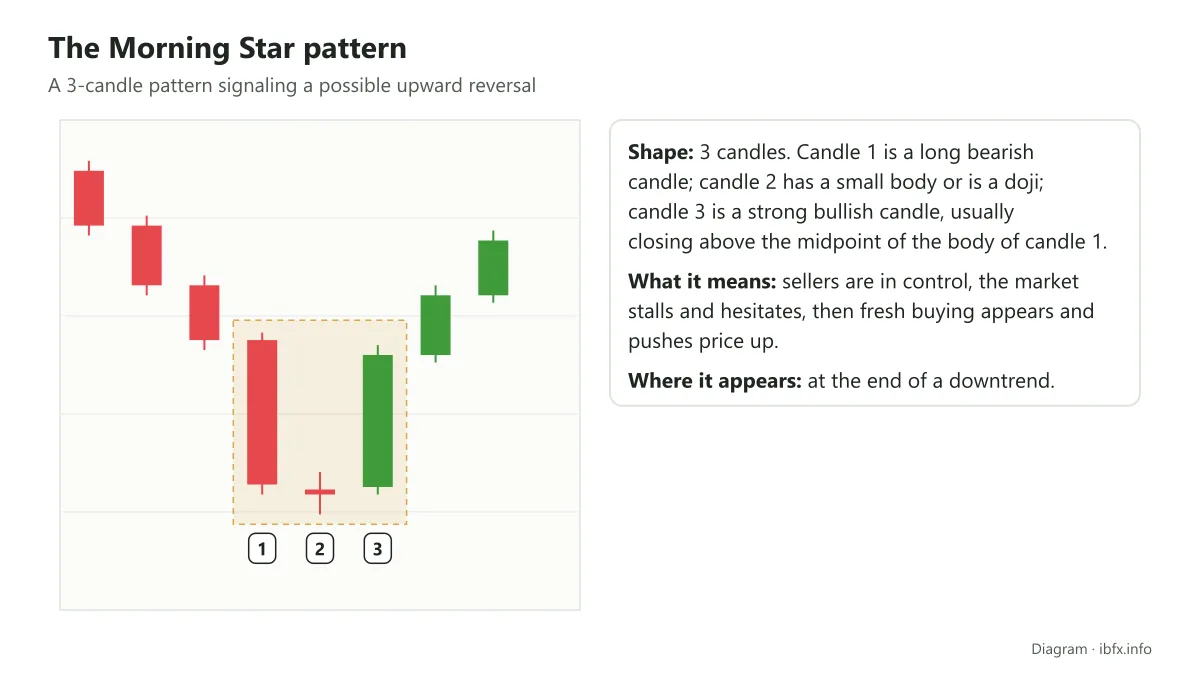
The Morning Star is a 3-candle pattern in which the first candle is a long red one, the second a small-bodied candle such as a Doji / Hammer / Inverted Hammer (as long as the middle candle has a small body), and the third a long green candle. This pattern of course appears in a downtrend.
The name Morning Star comes from Venus: when it appears at dawn, Venus is called the morning star, and when it appears at dusk it is called the evening star.
Because it is the star of the early morning, it is seen as a sign of wonderful, bright, warm things happening. And that is why Morning Star is the name given to the bullish reversal pattern.
What marks out the Morning Star pattern
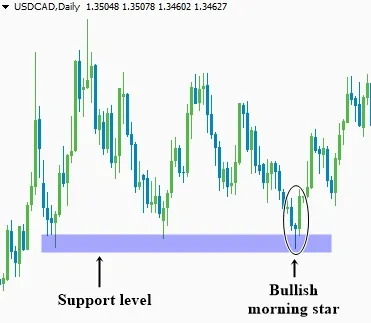
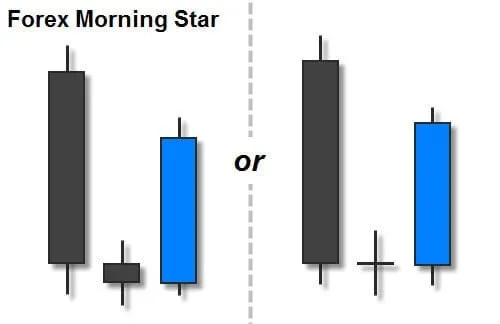 It appears in a downtrend.
- Candle 1 is a long bearish candle.
- Candle 2 has a small body, and can be a bullish or a bearish Doji.
- Candle 3 is a strong bullish candle, usually closing above the midpoint of the body of the first bearish candle.
How market psychology plays out in the Morning Star pattern
The Morning Star pattern begins with a long bearish candle showing that sellers are in control of the situation and are still pushing price down on a wave of excitement. The market then begins to hesitate, though: some of those already in take profit, some of those outside begin to buy, and others hold back and do not want to trade at all. At this point the market is balanced, producing a short-bodied candle, unable yet to carry on the sharp fall.
Then fresh buying appears, many sellers switch to the buying side, creating pressure that pushes price up and finally closes it at a high level, showing that buyers have risen up to take charge. And it is at this same moment that many of the people who sold at candle 1 and candle 2 are carrying a fairly sizable loss. As some of them have to cut their losses, or even switch to the buying side, price rises and helps the market reverse.
Bullish Abandoned Baby
This is a 3-candle pattern with 2 large candles on the outside and a small doji in the middle, set completely apart from the other 2. The price gaps leave a clear space between the doji and both the first and the third candle, which makes it look as though a baby has been abandoned.
The Bullish Abandoned Baby is a bullish reversal pattern appearing at the end of a fall in price (the opposite form, the Bearish Abandoned Baby, appears at the end of a rise). This pattern is mostly met in the stock market, where price gaps are common; in forex it is extremely rare.
What marks out the Bullish Abandoned Baby
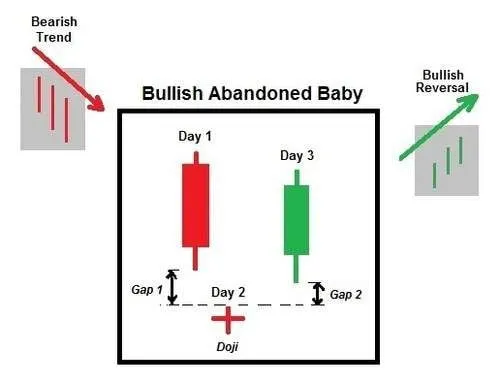
- It is made of 3 candles.
- Candle 1 is a bearish candle still following the trend before it.
- Candle 2 is a doji with a clear price gap against both of the other candles, giving the feeling of being abandoned, lost between 2 large candles.
- Candle 3 is a bullish candle, opening with an upward gap against the doji.
What the Abandoned Baby candle pattern means
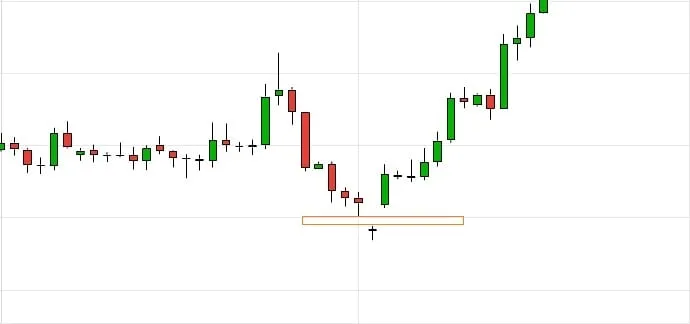
The abandoned baby reversal pattern appears in a downtrend, after a run of bearish candles whose closes get lower and lower. It is a very rare kind of reversal pattern, because it is made of a doji with gaps appearing against the candle before it and the candle standing behind it.
The market at this point is in a falling trend with extremely strong selling pressure, which makes the candle of the first day a sharply bearish one. By the second day, though, the range between buying and selling is so narrow that the close comes out near the open, producing a doji along with a gap against the candle before it. On the third day a bullish candle appears with a gap in the opposite direction. It is that upward gap on the third candle that completes the pattern, a signal that price may recover to higher levels.
Bearish reversal candlestick patterns
So those above are the bullish reversal candlestick patterns; in practice there are many more bullish reversal candles. But these are the most common patterns, enough for you to start getting familiar.
Just as with the bullish reversal patterns, bearish reversal patterns appear at the top of an uptrend. They are a sign that buyers may be exhausted or too tired to push price any higher. So price may reverse downward. If you do not like trying to catch bottoms and tops, these candle patterns can also be used to consider where to exit a Buy you already hold.
The bearish reversal patterns to note are:
Gravestone Doji
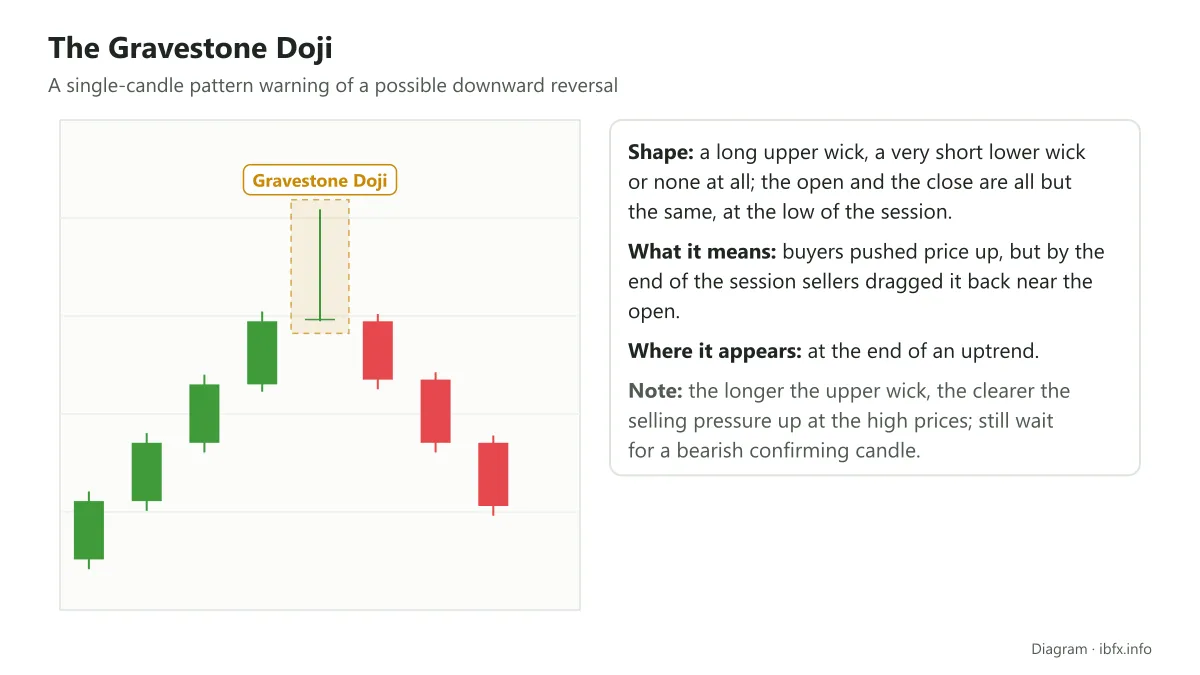
Truly, when you hear the name Gravestone Doji, you have to say the Japanese know how to name their candles: catching both the sound and the shape of the thing, striking and easy to remember. And sometimes just hearing the name is enough to picture what is coming next when that candle appears.
With a name as gloomy as the gravestone doji, its arrival is hardly going to be a good omen. When a gravestone doji appears at the end of an uptrend, it is a warning sign that price may reverse from rising to falling.
What marks out the Gravestone Doji
- A single-candle pattern
- A form of long-wicked doji with the open and the close equal or near enough equal.
- A very thin body, barely more than a line
- A long upper wick
What the Gravestone Doji means
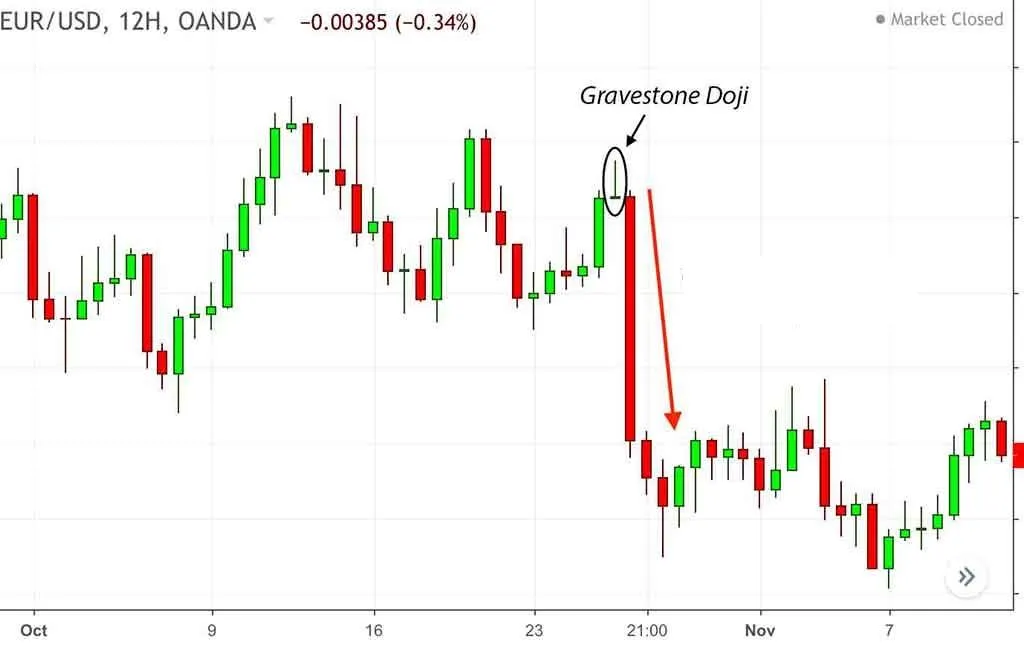
When this pattern appears it shows that early in the session buyers still had the upper hand entirely and tried to push price higher still. By the end of the session, though, sellers overwhelmed them and dragged price down, and in the end the close came out near the open. The longer the upper wick of a Gravestone Doji, the clearer the selling pressure up at the high prices; even so, a confirming candle is still needed before you conclude the trend is reversing.
Bearish Engulfing
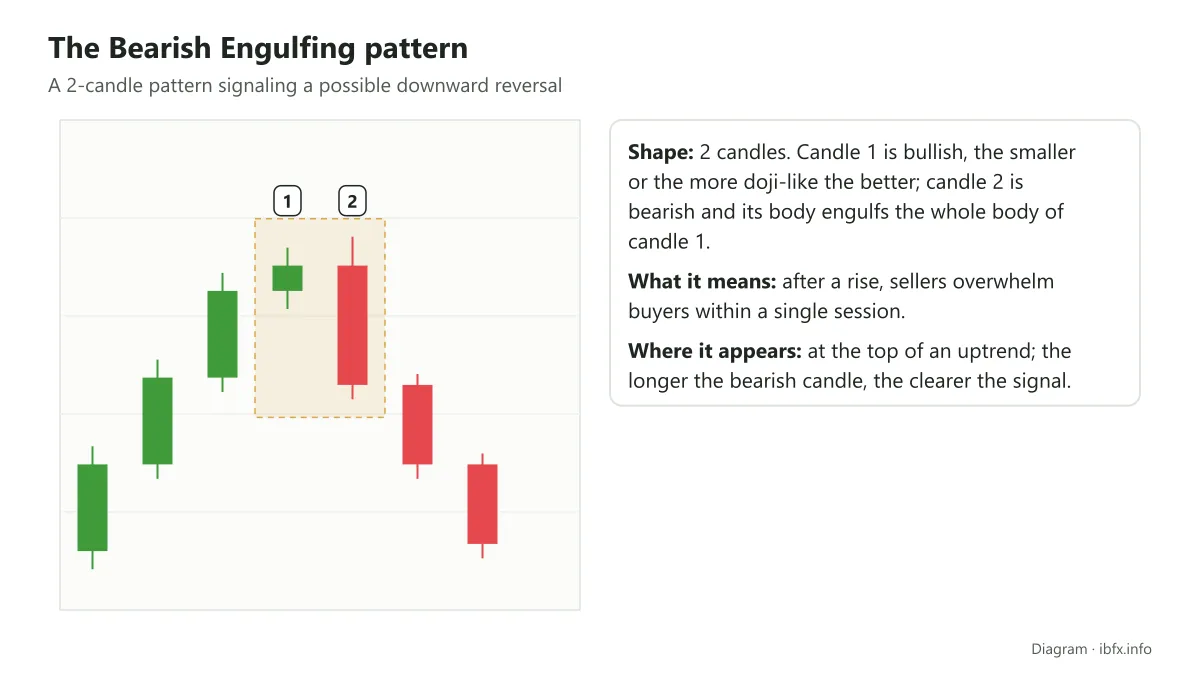
Like the Bullish Engulfing, the Bearish Engulfing is a common reversal candle pattern, appearing at the end of an uptrend.
What marks out the Bearish Engulfing pattern
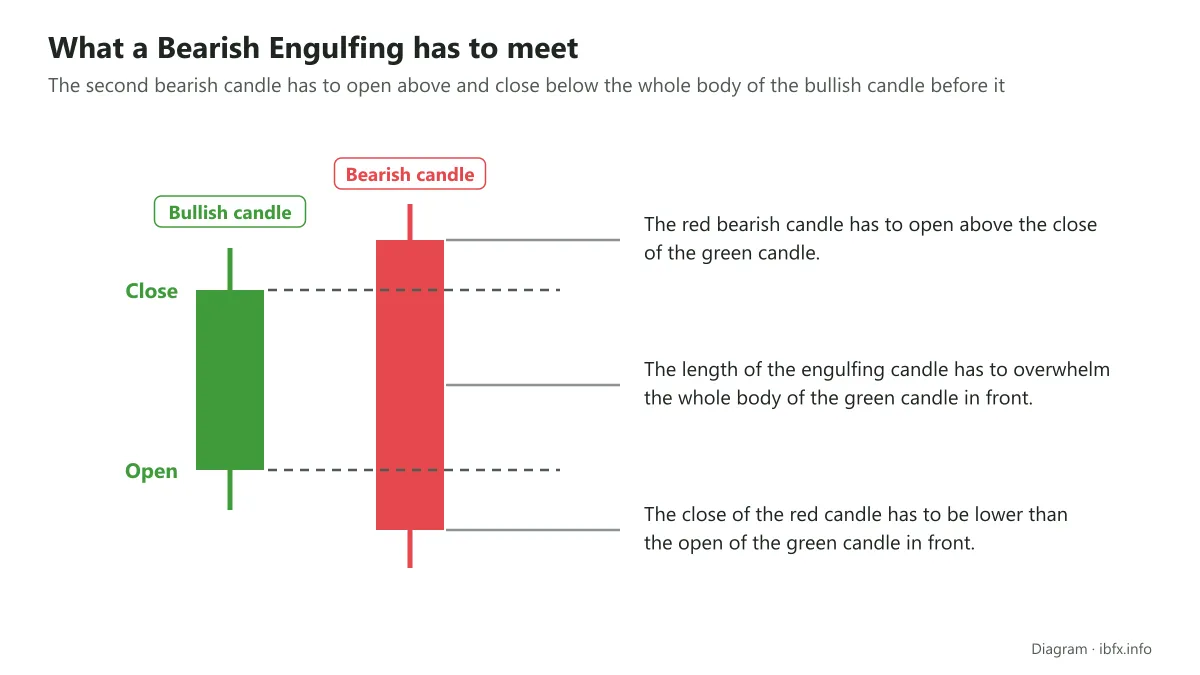
- It is a double-candle pattern (2 candles)
- Where it appears: the top of an uptrend
- Candle 1 is a bullish candle
- Candle 2 is a bearish candle whose body covers the whole body of candle 1
The size of the small bullish candle in front can vary, but the most important thing is that its body has to be entirely engulfed by the body of the next candle. When that first small candle is a doji it is usually seen as a clearer signal, reflecting the market’s lack of conviction before sellers take over.
An example of the bearish engulfing:
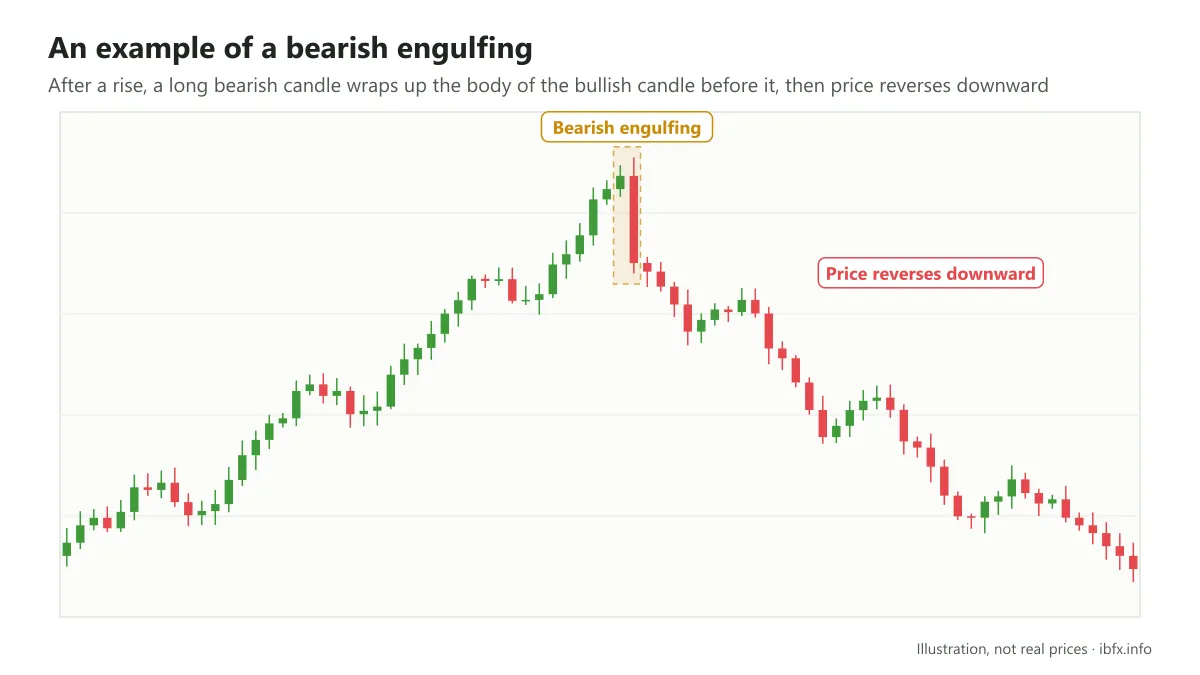
Candle 2 has to be a long red candle which, by the original definition, has an OPEN higher than (or equal to) the CLOSE of the green candle before it; in forex the next candle usually opens right at the close of the one before it, so the main condition is that the red body engulfs the green body. The longer the following candle, the clearer the bearish signal.
Shooting Star
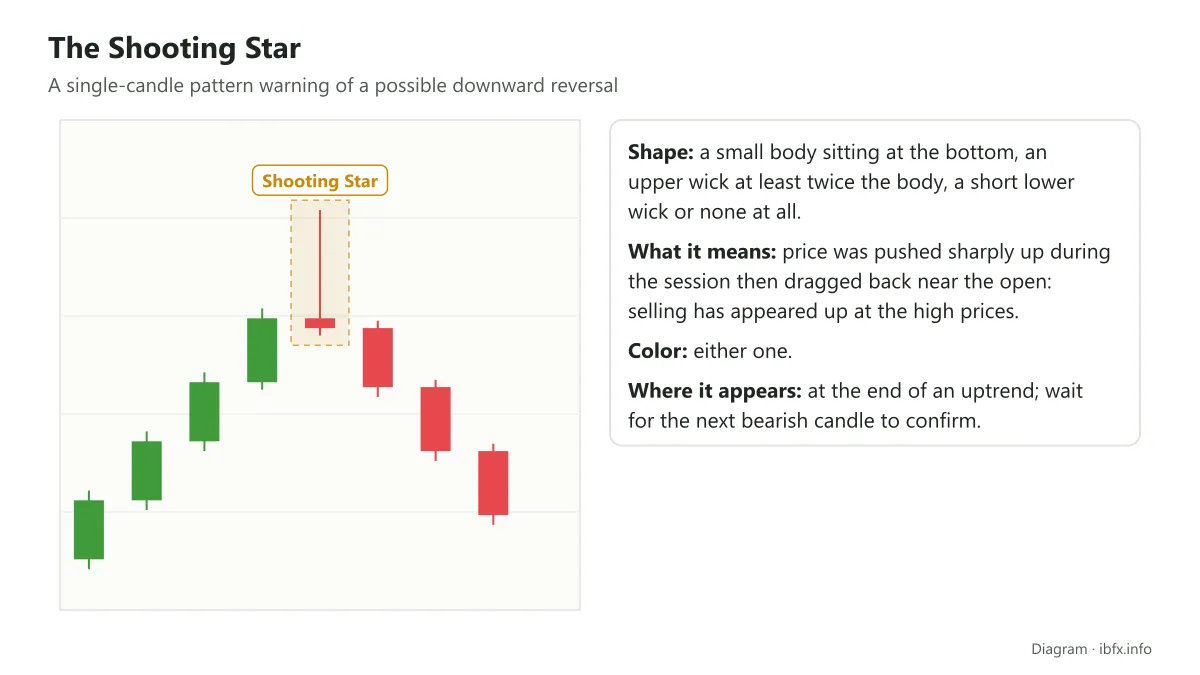
This is a candle with a long upper wick and a small body sitting at the bottom of the candle. Set against the doji, the body of the Shooting Star is still larger, which also shows that the close and the open of the Shooting Star only look roughly equal.
What marks out the Shooting Star
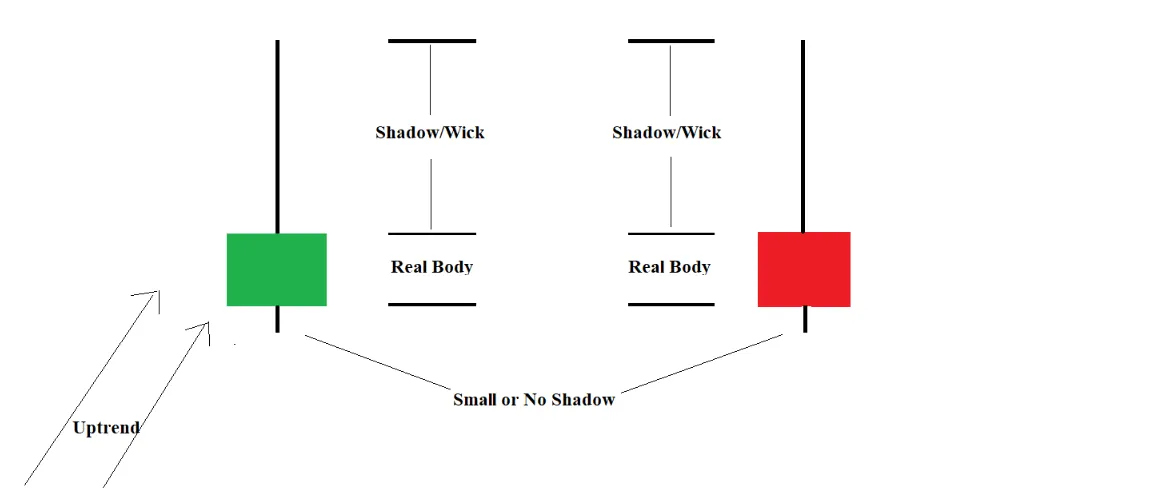
- The upper wick is 2–3 times the body of the candle (the longer the better)
- A small body, larger in size than that of a doji
- The lower wick is all but absent, or short
- The color does not matter: it can be green (a bullish candle) or red (a bearish candle)
What the Shooting Star candle means
After a strong uptrend has taken hold, a new candle opens and price moves sharply up as expected. Before the candle closes, price is pushed back down near the open, showing that buyers could not hold price up in the high area and that selling is appearing. For this candle to be really confirmed, though, you should wait for the next candle to close as a bearish candle before you enter.
You should also trade this candle alongside Elliott Wave, RSI, MACD or a moving average to get more out of your trading.
Evening Star
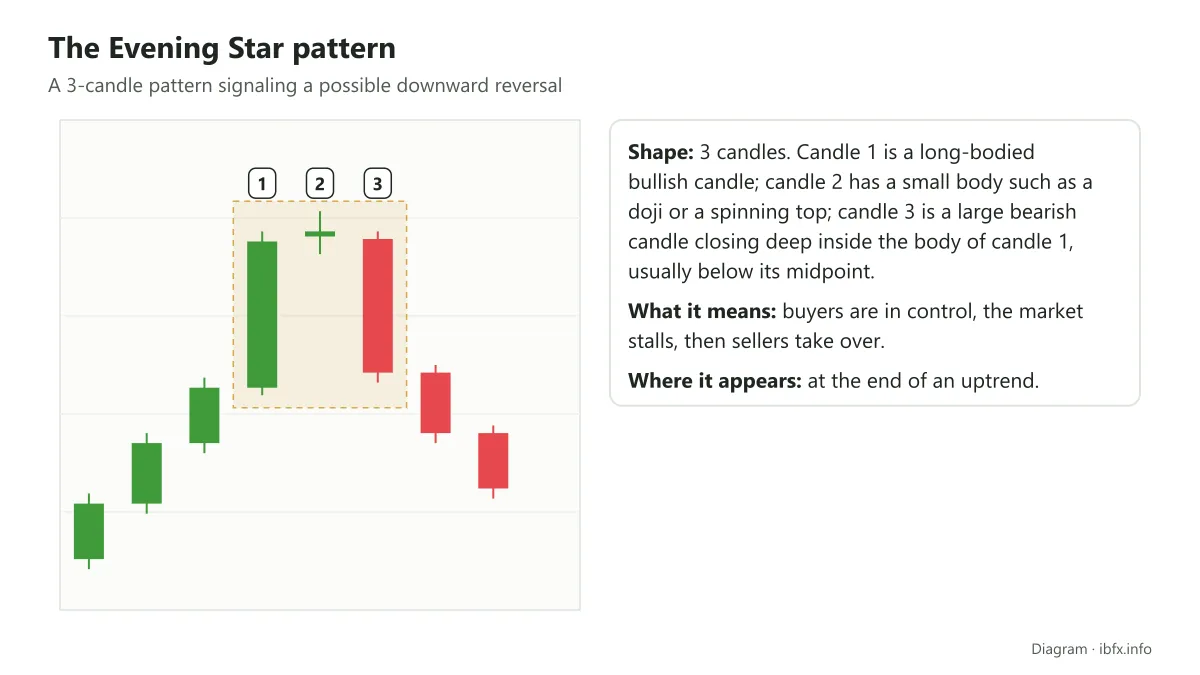
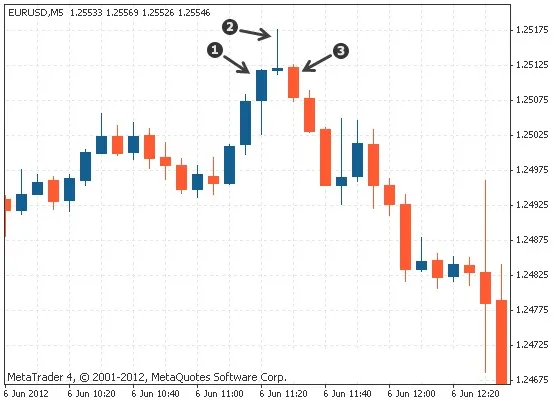
That is the morning star done; the next candle now is the evening star, the star that usually appears to signal night slowly falling after a day of brilliant sunshine. And that is why, when this candle pattern appears at the end of an uptrend, it is also a sign that a reversal may be about to happen.
What marks out the Evening Star pattern
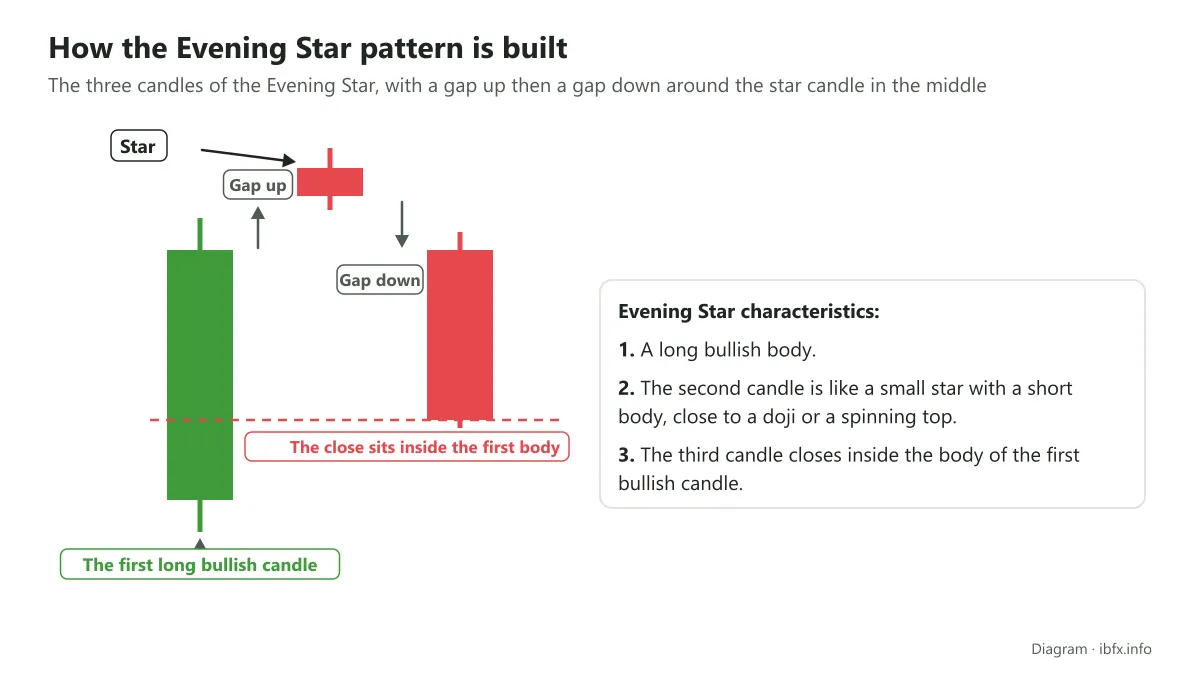
- Candle 1: a bullish candle with a long body
- Candle 2: usually a small-bodied candle such as a doji or a spinning top, which the Japanese likened to a star.
- Candle 3: a large bearish candle closing deep inside the body of the first candle, usually below the midpoint of the body of the first bullish candle.
Beyond that, note the following points about the Evening Star pattern as well:
The longer the first and the third candle, the clearer the reversal signal.
If there is a Gap between the first and the second candle, or between the second and the third, the signal gains extra weight (in forex a Gap between candles is very rare).
The deeper the third candle falls into the body of the first, the clearer the reversal signal.
With the evening star pattern you pay more attention to the bodies of the candles than to the wicks. See also: The Evening Star candlestick pattern.
Other advanced reversal candlestick patterns to know
The double top and the double bottom
These are two very common price patterns. We already have detailed articles on the 2 of them, which you can read here:
The head and shoulders pattern
The head and shoulders is also one of the more interesting reversal patterns, its name following the human body with one head and two shoulders. You can read the following article for a clearer grasp of this pattern:
A strategy for trading the reversal candlestick patterns
When you trade reversal patterns you have to remember to be patient and wait for the pattern to be really confirmed, to avoid the risk. Look at the example below to understand better how to trade these patterns.
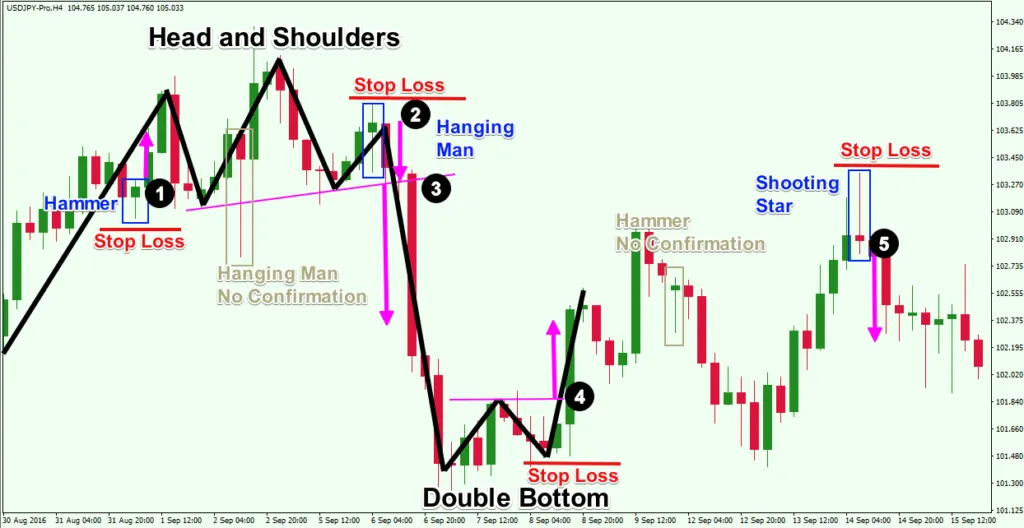
The example above is the H4 chart of the major pair USD / JPY. The chart shows several reversal patterns, each situation marked with a number as below:
Pattern 1: You see a bullish Hammer form, confirmed by a bullish candle right after it. In this example, after the confirming candle, price rose by at least the length of the Hammer candle.
Pattern 2: a Hanging Man appears after price has risen, and price then fell.
Pattern 3: Next a head and shoulders pattern forms; together with the Hanging Man at number 2, the bearish signal gains extra weight.
With those 2 signs, you can consider a Sell order, place the stop loss above the Hanging Man at number 2, and work out the take profit target from the height of the head and shoulders pattern.
Pattern 4: Price then consolidates and produces a Double Bottom pattern, another trading opportunity. This time, instead of a Sell you can Buy, buying USD / JPY back when price breaks up above the neckline (in magenta). You can place the stop loss below the second bottom, as in the illustration above.
Pattern 5: Here you see a shooting star form, and at this point you can reckon that a bearish pattern has formed. In particular, once the Shooting Star has appeared, the next candle being a bearish one means the pattern has been confirmed. You need to take note of this: in the picture above there is a Hammer, but the candle after the Hammer is a bearish one, meaning the pattern was not confirmed, and in the end price did not go the reversal way we wanted. For that reason you do not trade at this Hammer.
Back to pattern 5, once a bearish candle has confirmed it, you see a bearish pattern following a bullish one, so you can perfectly well place a Sell order here with the stop loss at the high above the shooting star at number 5.
Trading rules for the reversal candlestick patterns
To trade reversal candles you need to remember a few simple rules to do with trading, as below:
Only enter once the reversal candle has formed
For a reversal candlestick pattern to be confirmed we have to wait for that candle to end before we can enter. While the candle has not finished forming, you cannot conclude for certain that it is a doji or a hanging man… until the candle closes anything can still happen, so be really patient, or you will find it easy to make a mistake.
For example, with the Bullish Engulfing pattern, the careful way is to wait for one more third bullish candle to confirm it and then trade once that candle ends. This way sometimes makes you miss a good entry, but it helps cut down the false signals.
Stop loss
Nothing is 100% certain, so you always have to place a stop loss in every case. With reversal patterns the stop loss is usually placed above (for a Sell order) or below (for a Buy order) the high or the low of the pattern, a small distance further out from the wick depending on the time frame, to avoid being swept out. Work out your position size from the stop loss distance.
Take profit
The minimum price you use to take profit with a reversal candlestick pattern is equal to the size the pattern formed. Measure from the lowest point to the highest point, work out the number of pips and apply that to your take profit. Note that this is only a reference target, not a level of profit you are certain to reach: price can reverse before it touches the target. If price goes further than you expected, you can also use a trailing stop to hold on to part of the profit.
Those above are the common reversal candles you ought to know when you trade forex. Practice spotting them on a demo account, and always put them together with the context of the trend, the support and resistance areas and tight money management.