On this page
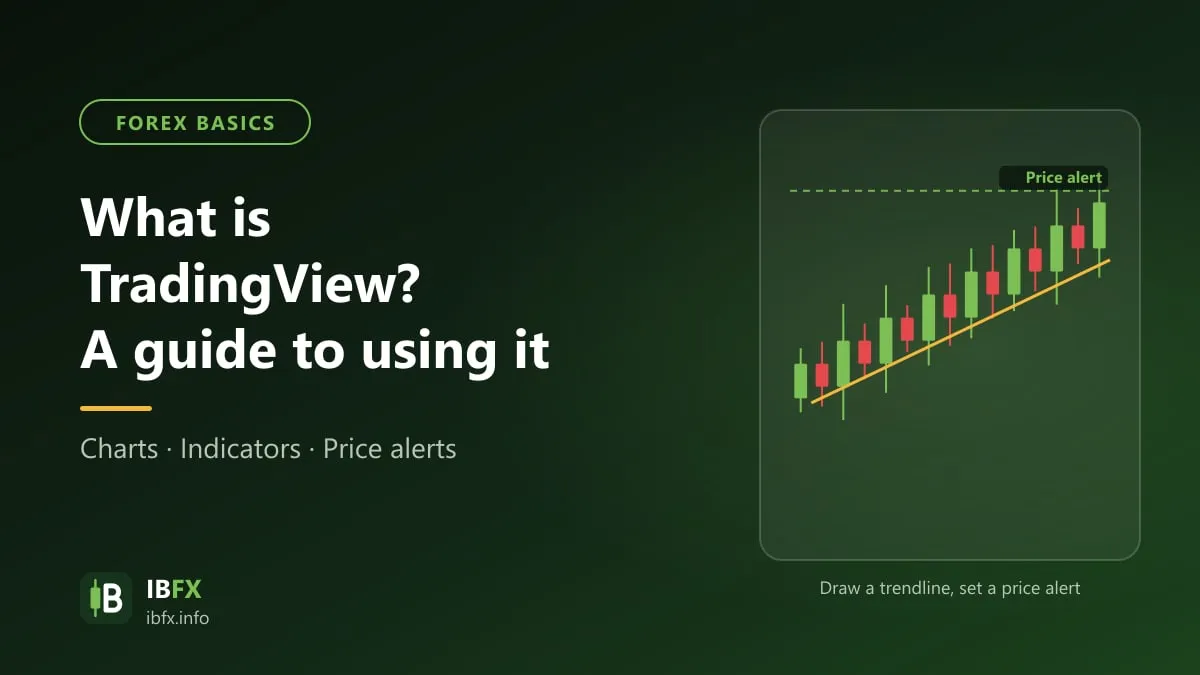
If MT4 is where you place your orders, then TradingView is the chart analysis platform a great many traders use when they trade forex.
And because TradingView is such an enormous store of material, the first time you set foot in it you are certain to feel swamped, with no idea how to get the most out of the platform.
As well as explaining everything TradingView can do, this article on “what TradingView is” throws in a handful of neat tips you should not skip if you mostly use TradingView for analysis. Read on.
What is TradingView?
TradingView is a service that provides tools for traders, founded in 2011.
Structurally, TradingView is built like the social platforms in use today, such as Facebook or X (Twitter). The difference is that this platform is not for everybody: it is only a place to connect people who enjoy financial markets, who want to learn about them, or who trade them.
Because it is designed as a social network, the information on TradingView is broadly similar to what you find on other popular networks: a news section and a section of traders’ analysis (this is where you set out your own view on where the price of an instrument is heading). That section also carries the full set of likes, shares and comments from other traders. TradingView even provides something close to a Facebook group for discussion and opinions, plus private chat so you can talk to a particular trader.
That said, many traders mostly use TradingView as a chart analysis tool in place of the charts in MT4. Which of the two you prefer is up to you.
Why use TradingView?
TradingView holds a great deal of data and a great many analysis ideas, and the interface is far friendlier than MT4. The ideas posted by the community are of uneven quality, though, and they are not investment advice; use them to learn how to analyze rather than to enter trades. On top of that, being an enormous social network, TradingView does not confine you to members trading at the same broker: you can connect with anyone in the world who has an interest in markets and uses TradingView.
It does not stop there. TradingView has a number of other strengths:
- TradingView supports many languages, which makes it easy to use.
- TradingView comes in every flavor, from the website and the desktop app to the iOS and Android apps.
- It is easy to connect with plenty of talented traders around the world and learn how they analyze, which sharpens your own analysis.
- The TradingView interface is beautifully designed and friendly, so it is very easy to use for anybody, beginners included.
- Every chart you have ever analyzed on TradingView is saved and available on your other devices. Thanks to that syncing, all you need is an internet connection to look at your charts or at somebody else’s.
The kinds of account on TradingView
TradingView splits accounts into two kinds: the free account and the paid accounts.
The free TradingView account, or the Basic account
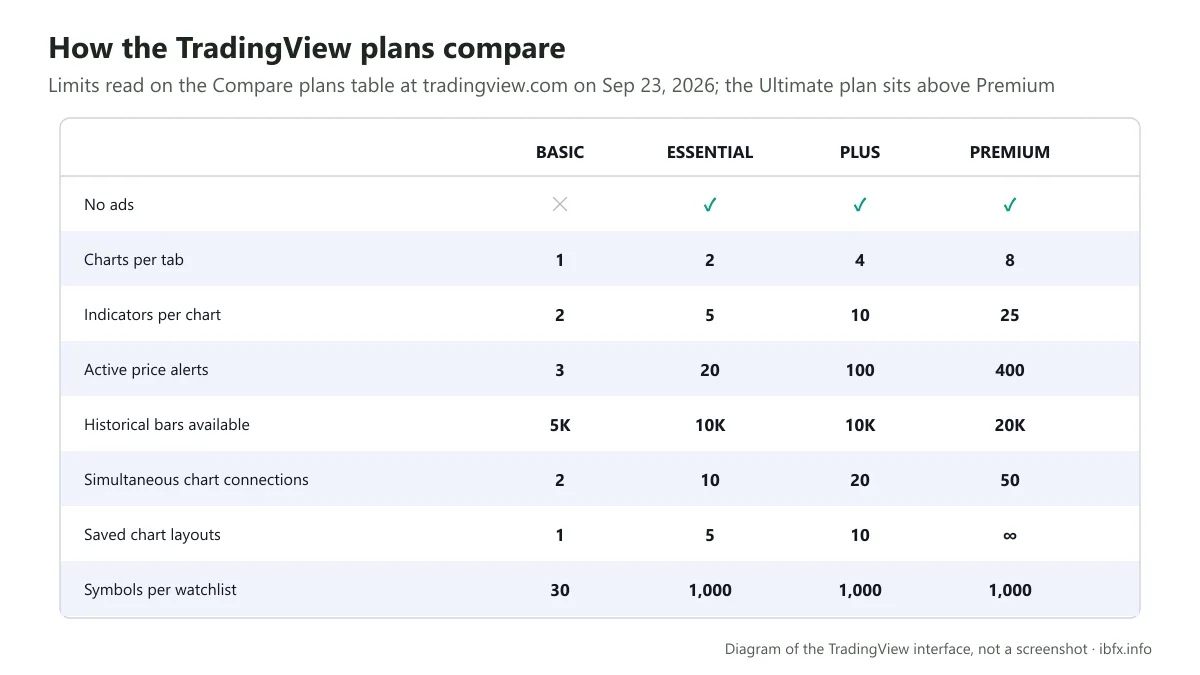
Which kind you use depends on what you need. The saying “you get what you pay for” holds true here. On the free, or Basic, account, TradingView only lets a trader use the basic features: there are ads, and there are caps on the number of indicators per chart, the number of price alerts and the number of devices you can use at once. The exact figures change over time.
If you are new and have never used TradingView, or you are learning to read charts, the free version is usually enough. TradingView charges monthly or annually, so you can upgrade later whenever you need to. In the section on signing up we show you how to try a paid plan for free.
Paid TradingView accounts
The paid accounts are split into four levels: Essential, Plus, Premium and Ultimate. On annual billing they cost 12.95, 29.95, 59.95 and 199.95 USD a month; on monthly billing, 14.95, 34.95, 69.95 and 239.95 USD a month. TradingView has renamed its plans, added plans and adjusted prices many times, so check the current price list on the TradingView website.
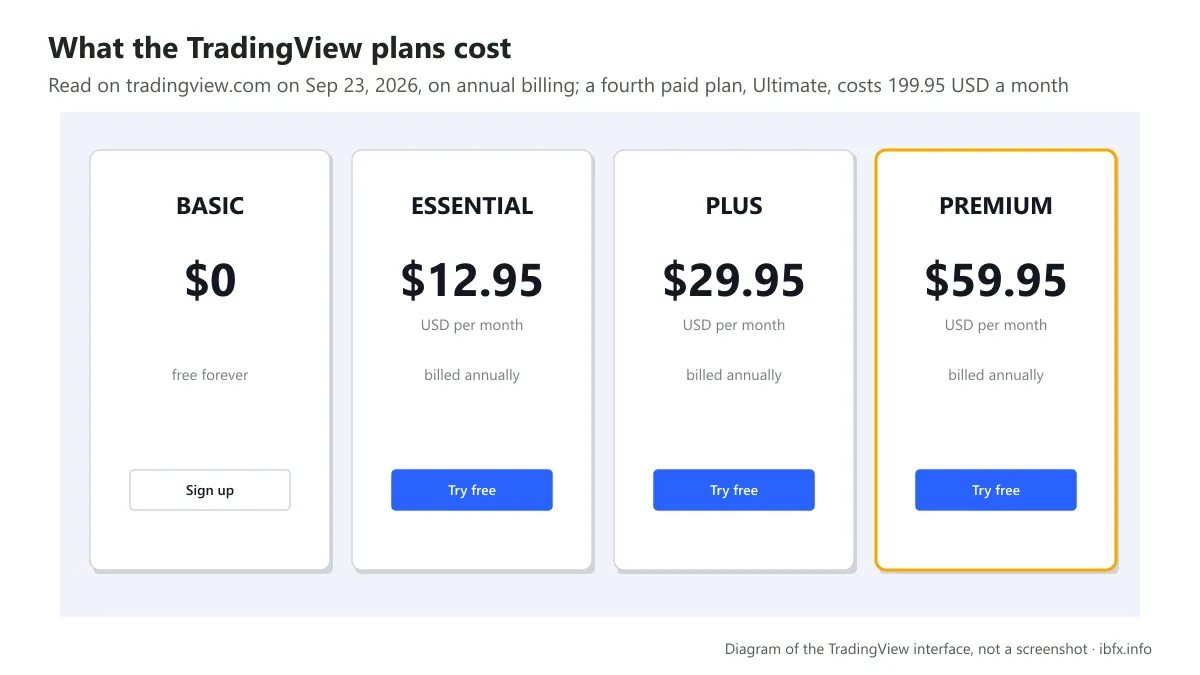
The top plan is Ultimate, at 199.95 USD a month on annual billing, and TradingView notes that only Ultimate is available to professional users.
If you do need a paid plan, you can wait for the big sales such as Black Friday, when TradingView usually discounts heavily against the standard price.
People upgrade when they need more indicators, more alerts or more charts on one screen. The lower plans still cap some features compared with the top plan.
Have a look at the comparison below to fill in the picture:
How to sign up for an account at TradingView
This is the part about signing up for a TradingView account.
First, to sign up, go to the TradingView home page:
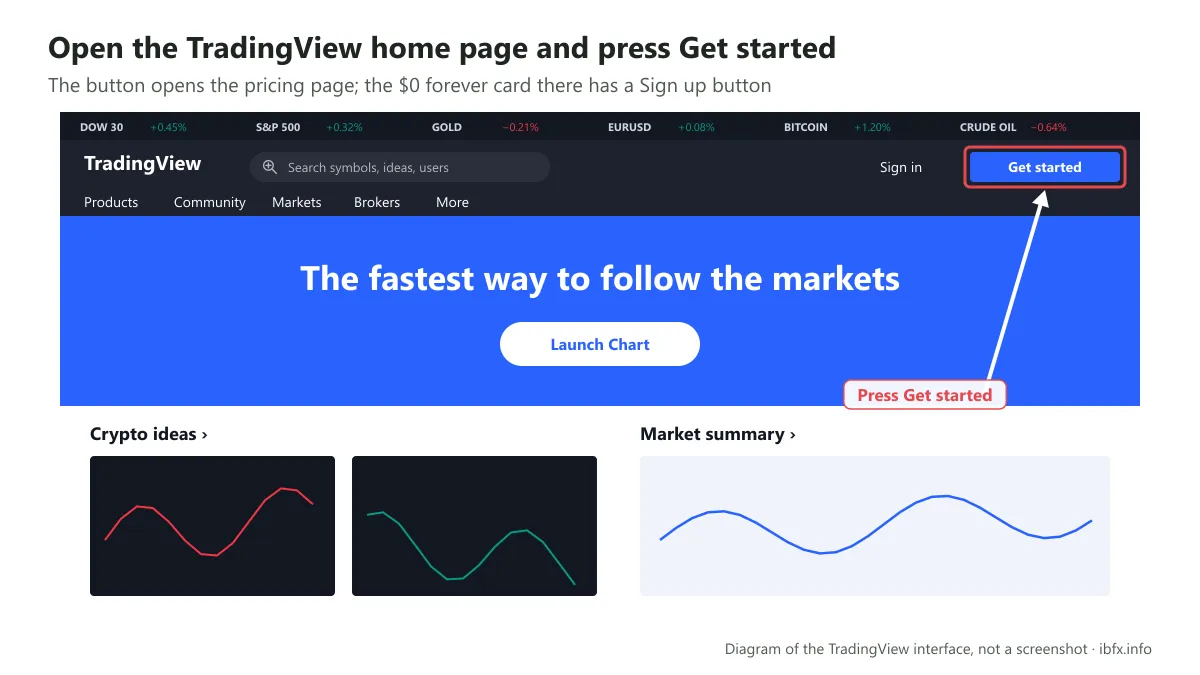
Both the Get started button at the top right and the Get started for free button in the middle of the page take you to the pricing page. The $0 forever card there has a Sign up button that opens the sign-up screen; the free plan asks for no card.
Signing up then runs in two steps:
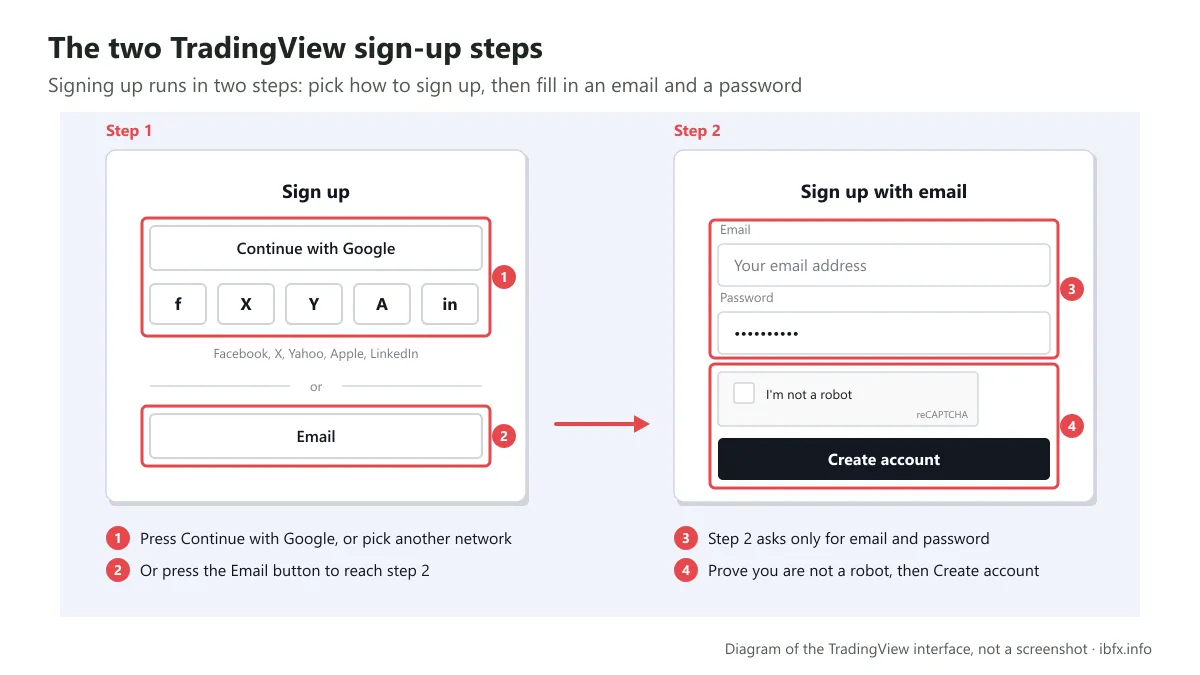
Step 1 asks how you want to sign up: a Continue with Google button, a Show more options link that adds Facebook, X, Yahoo, Apple and LinkedIn, or an Email button if you would rather fill the details in yourself.
Step 2 only appears if you pick Email, and it only asks for an email and a password, plus an I’m not a robot box. There is no username field and no separate box for agreeing to the terms. Fill those in and press Create account.
Next an email arrives, and all you have to do is verify the account to finish signing up at TradingView. Then turn on two-factor authentication to protect it.
Trying a paid plan
The account you get at TradingView by default is the Basic account, which is free. If you want to try a paid plan, TradingView usually gives you 30 days; remember to switch auto-renewal off if you do not want to be charged when the trial ends.
A tour of the TradingView interface
This is the TradingView home page, and it gives you no end of features, among them:
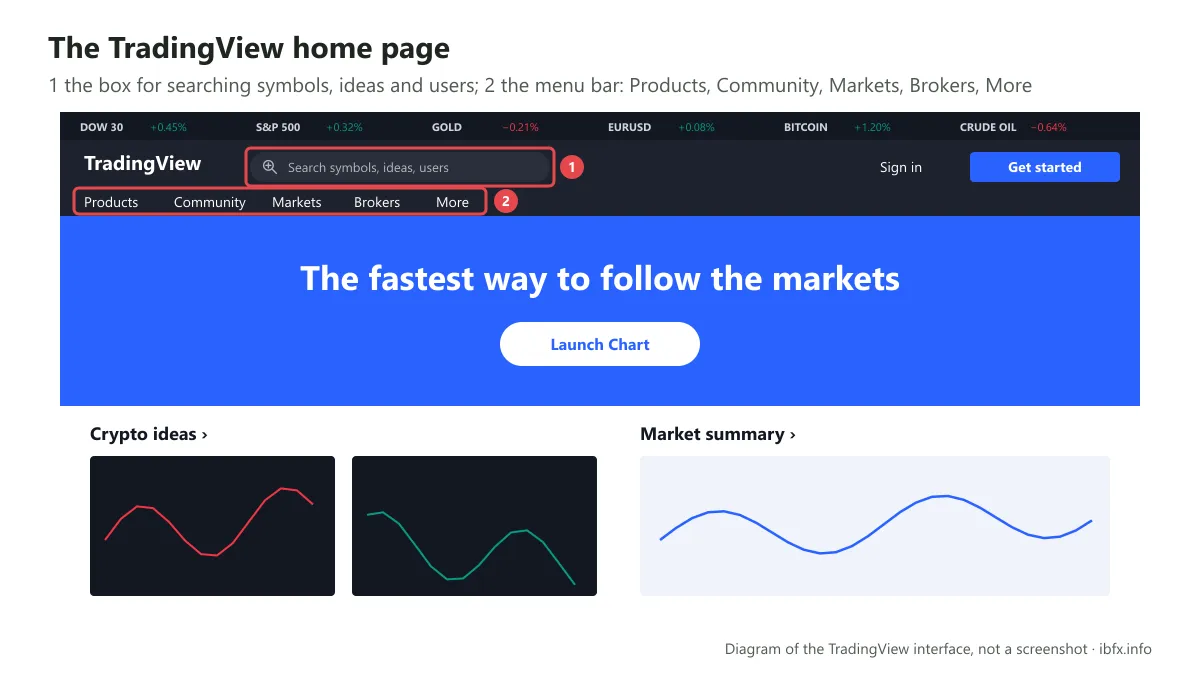
The search bar: whatever you want to find on TradingView, from forex, stocks and commodities to indices or cryptocurrencies, you can type it here. As well as instruments, TradingView lets you search for trading ideas, educational ideas, indicators, or traders you want to follow.
Lower down the page, TradingView groups ideas by instrument so a trader can follow them more easily:
- Ideas by instrument type: forex, crypto, stocks and so on.
- Ideas by trend analysis: support and resistance, supply and demand, Fibonacci and so on.
- Ideas by harmonic pattern: the AB=CD pattern, the Gartley pattern and so on.
- Ideas by chart pattern: double top and double bottom, pennants and so on.
- Ideas by technical indicator: moving averages, oscillators and so on.
If you want to read an idea, or you are interested in one of these groups, just scroll down the page.
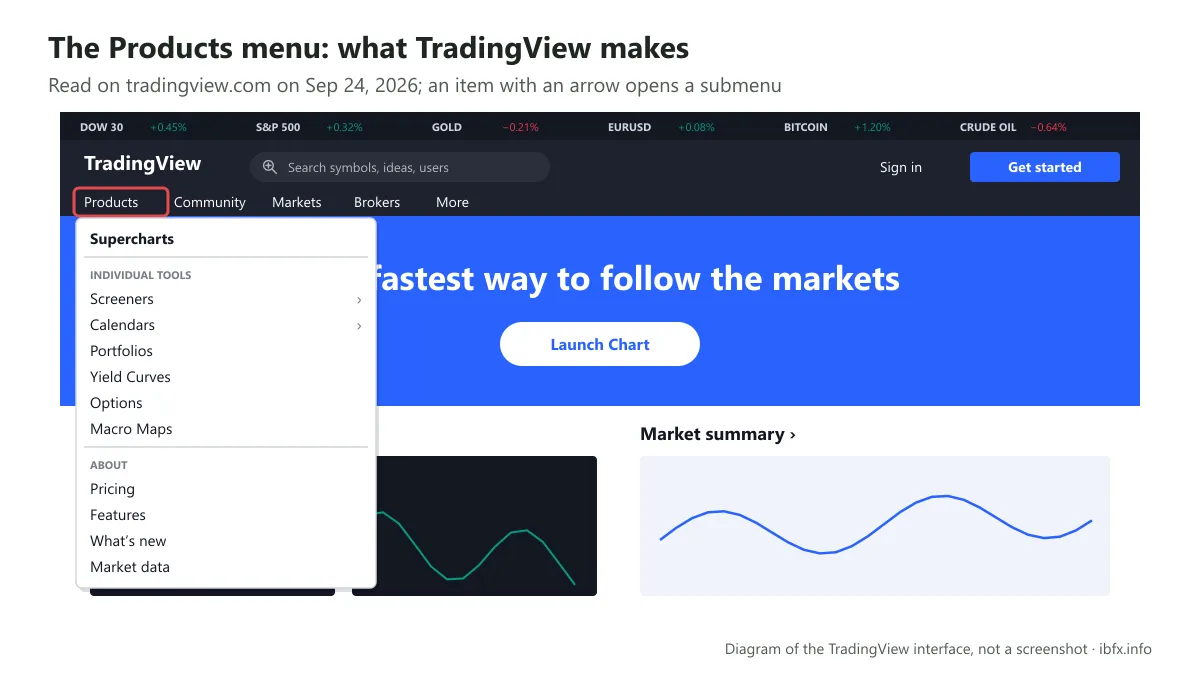
The menu bar under the search box has five items. The list below was read on tradingview.com on Sep 24, 2026; TradingView rearranges this bar fairly often, so if what you see differs, look for the nearest name.
Products: where TradingView puts its own products. Supercharts is the way into the chart interface, the part traders care about most; then come Screeners (for stocks, forex and crypto), Calendars, Portfolios, Yield Curves, Options and Macro Maps. At the foot of the menu is an About group leading to the price list, the feature list, What’s new and Market data.
Community: the social side of TradingView, holding the trading ideas users post and the indicators and scripts the community writes.
Markets: the list of instruments TradingView carries: indices, cryptocurrencies, currencies, stocks, bonds, futures and more.
Brokers: the section comparing the brokers you can connect to TradingView, so you can place orders from the chart.
More: the rest of the information about TradingView, the Blog and News sections, and the solutions TradingView offers for websites and brokers.
If you want to look at one of these, just scroll down to read more. Beyond everything listed above, the main page also carries an economic calendar and financial news that TradingView pulls in from a range of sources.
How to use the TradingView chart
What the TradingView chart screen is made of
Broadly speaking, TradingView has a very friendly design with the parts laid out clearly and sensibly, and every part, every bar, holds particular information:
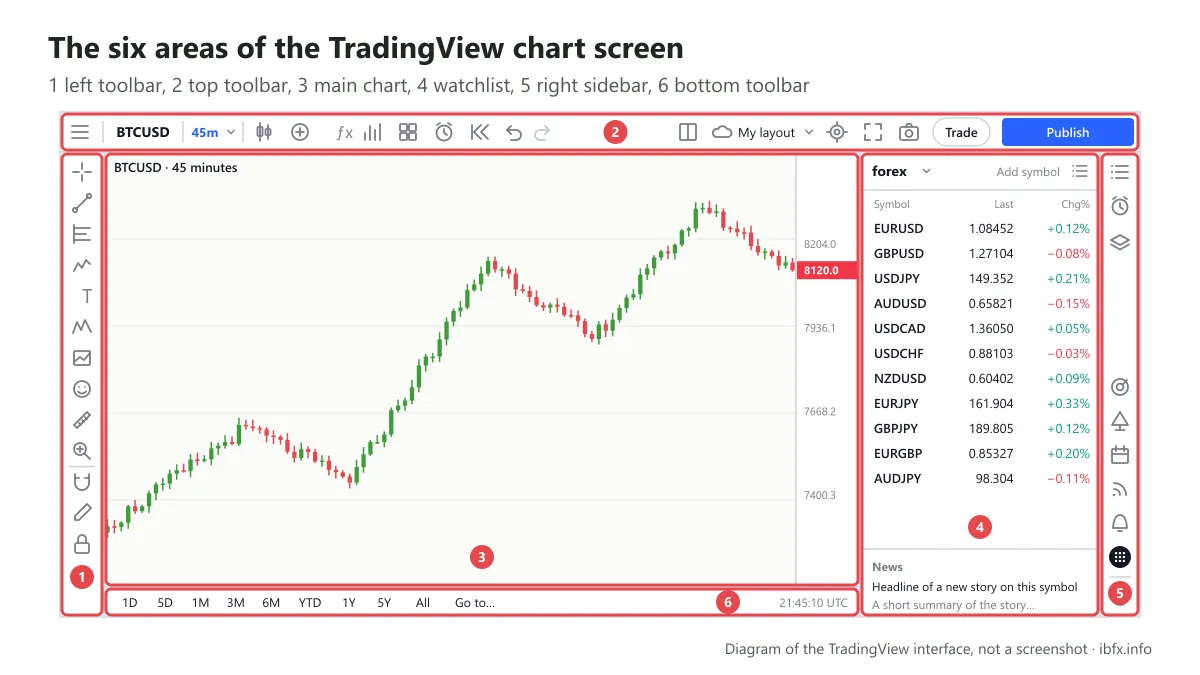
Part 1: the Left Toolbar holds every drawing and measuring tool TradingView provides. To use these tools properly, though, you need to learn and understand technical analysis.
Part 2: the Top Toolbar is mostly where TradingView puts the tools to do with indicators and candle types. That is, where part 1 has you drawing and measuring by hand with tools such as Fibonacci, part 2 holds ready-made indicators: if you want one, you simply add it to the TradingView chart and you are done.
These indicators are worked out automatically by the machine rather than by the trader. So a trader only has to apply an indicator to analyze where the price is heading, with nothing else to draw.
Parts 1 and 2 are the two you will use most. So if you have no time to explore, studying these two is enough.
Part 3: the main chart area – the largest part, where the chart sits and where you apply all the tools and indicators TradingView provides to analyze the price.
Parts 4 – 5: the Right Toolbar holds the information about instruments that you created yourself. TradingView also works in a news section and instrument prices there so a trader can keep an eye on them.
There is one more narrow part at the very edge for connecting with other traders (marked 5 in the picture above). This is what makes TradingView a social network built for traders, and it mostly holds the chat tools, the economic calendar, and the small groups where a trader can join in the discussion with others.
Part 6: the Bottom Toolbar is the part most traders skip, but it is quite interesting and it explains why TradingView became a complete platform, with note-taking tools and a trading panel for connecting an account at one of the brokers linked to TradingView, or for practising with Paper Trading (TradingView’s simulated account) without signing up at any broker at all. TradingView also puts particular data about stocks, forex and other commodities down there.
That is the overall make-up of the TradingView chart. Now let us go into each part in depth.
The parts of the TradingView chart in detail
Part 1: the Left Toolbar
As we said, this is where every tool for drawing on and measuring a chart lives. Where area 2 holds the automatic indicators, in this area the user has to draw and measure by hand. For that reason a trader needs to understand what each tool means, and may well need to learn technical analysis before they can use what TradingView provides, such as Fibonacci retracement, Fibonacci extension or the Gann patterns.
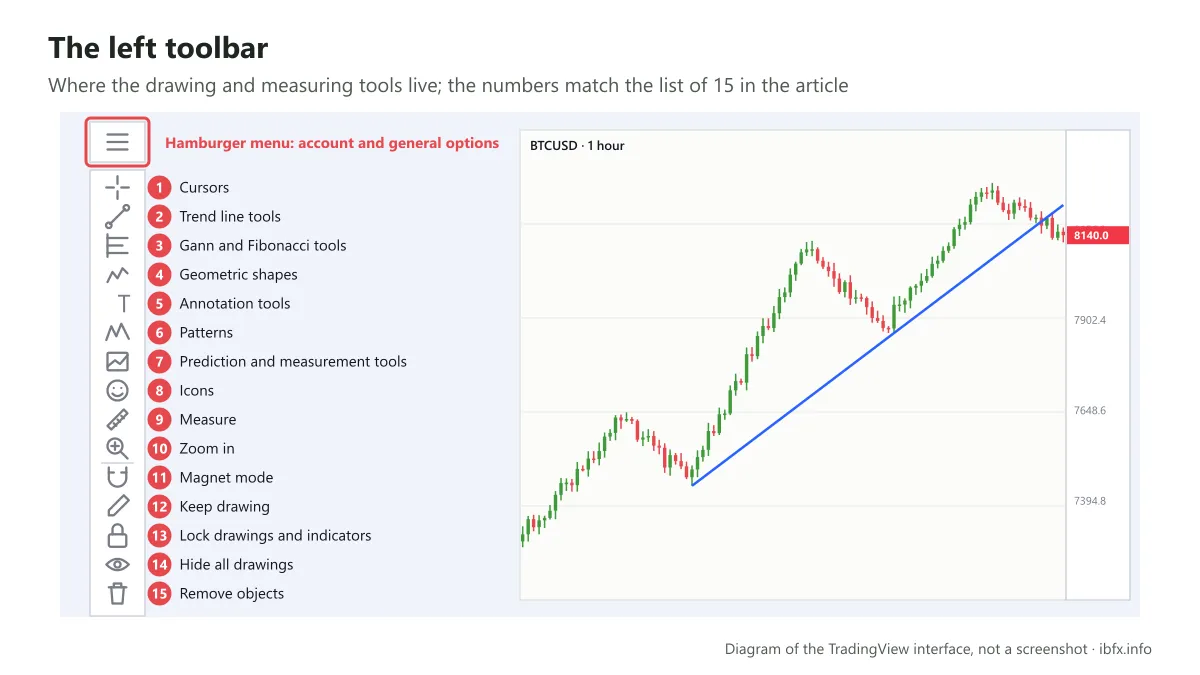
The three red lines above, which are not numbered, are where everything to do with your TradingView account lives. If you want to switch the chart to dark mode (a feature TradingView added fairly recently), you can do that from there too.
- Cursors: this is where you change the mouse pointer to suit yourself, into an arrow, a dot, even an eraser. The one most people use, and the easiest to read, is the crosshair TradingView sets by default.
- Trend line tools: exactly as the name from TradingView suggests, this holds every tool a trader draws with to find where the price is heading and to mark out support, resistance, price channels and so on.
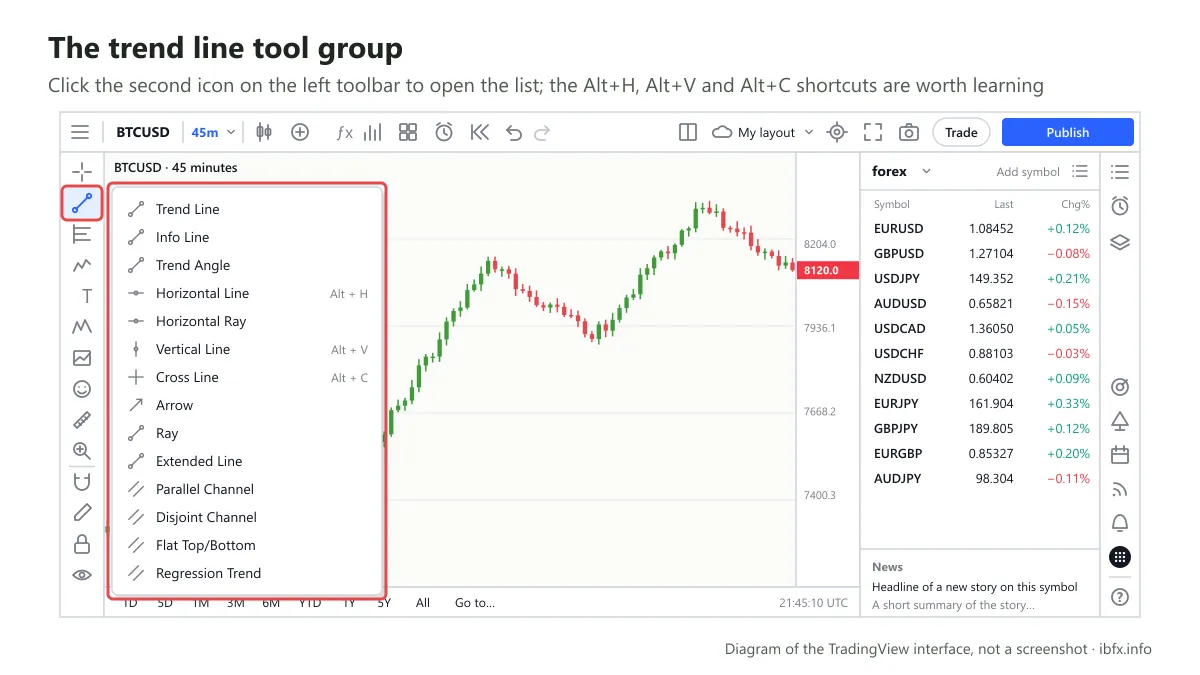
This is the part every trader has to use, and arguably the part used most. Note a few of the shortcuts TradingView provides: if you often use lines such as the horizontal line (Alt+H), the vertical line (Alt+V) or the cross line (Alt+C), learn those shortcuts, because they make the job quicker.
- Gann and Fibonacci tools: this is where the classic models that every trader has heard of, to a greater or lesser degree, live: the Gann box, the Gann fan, the Pitchfork, Fibonacci retracement and Fibonacci extension.
- Geometric shapes: these help you mark and lay out geometric shapes on the chart so it reads more easily. Traders tend to use this part to explain or analyze for other traders, when they want to set out a personal view or to make a case about a particular currency pair.
- Annotation tools: this is where you “take note” of anything you want to put on the chart. TradingView also provides other marks, such as arrows and flags, for you to mark things up so they are easier to spot.
- Patterns: unlike the Gann or Fibonacci part, what TradingView provides here is more advanced, and not every trader handles it well. If you do want to use it, you have to learn and understand these patterns first: triangles, the ABCD pattern, head and shoulders, the Elliott impulse waves, the Elliott triangle wave and so on.
- Prediction and measurement tools: this part helps you measure price levels so you can set the most suitable risk-to-reward ratio. Plenty of traders also use it to lay out or share a trade with other traders, showing the entry, the stop loss and the take profit.
- Icons: to give the chart some color instead of leaving it bare, TradingView has obliged with a great many different icons, so you can personalize a chart as far as you like.
- Measure: measures a distance and counts the candles in an area or a range of your choosing.
- Zoom in: where you magnify part of the chart so it reads more easily. This is not the same as scrolling with the mouse, because scrolling magnifies the whole chart. Here, when you use the tool, the chart jumps straight to the area you want to look at, which is handy and saves you dragging the chart over to it.
- Magnet mode: a magnet “pulls” prices together the way a magnet pulls iron. So when magnet mode is on, your cursor snaps to the open, high, low and close of the nearest candle.
This tool is especially useful when you are drawing Fibonacci retracements or extensions and you want to catch the exact wick or body. Or when you anchor a support or resistance level exactly to an open, close, high or low.
- Keep drawing: on TradingView you cannot use one tool several times over in a row; each time you draw, you have to click the icon on the toolbar again. So if you want to draw 10 trend lines, you have to click the toolbar 10 times. Far too slow. To fix that, you can use keep drawing, which lets you draw one kind of line or use one tool over and over without picking it again.
- Lock drawings and indicators: it is called locking because when you turn this on, every line you have drawn is locked and cannot be moved or stretched.
- Hide all drawings: hides every line you have drawn for the moment so the chart looks clear; press it again to bring them back.
- Remove objects: this is where you delete every line you have ever drawn and every indicator you have ever set up. It works a little differently from hiding: hiding is temporary, whereas here, when you press it, every indicator and drawing tool disappears immediately. TradingView gives you three choices: remove drawings, remove indicators, or remove drawings and indicators.
Part 2: the Top Toolbar
If part 1, the Left Toolbar, is a trader’s left arm, then the Top Toolbar is the right arm. These two are what you will use most. Let us see what this part can do.
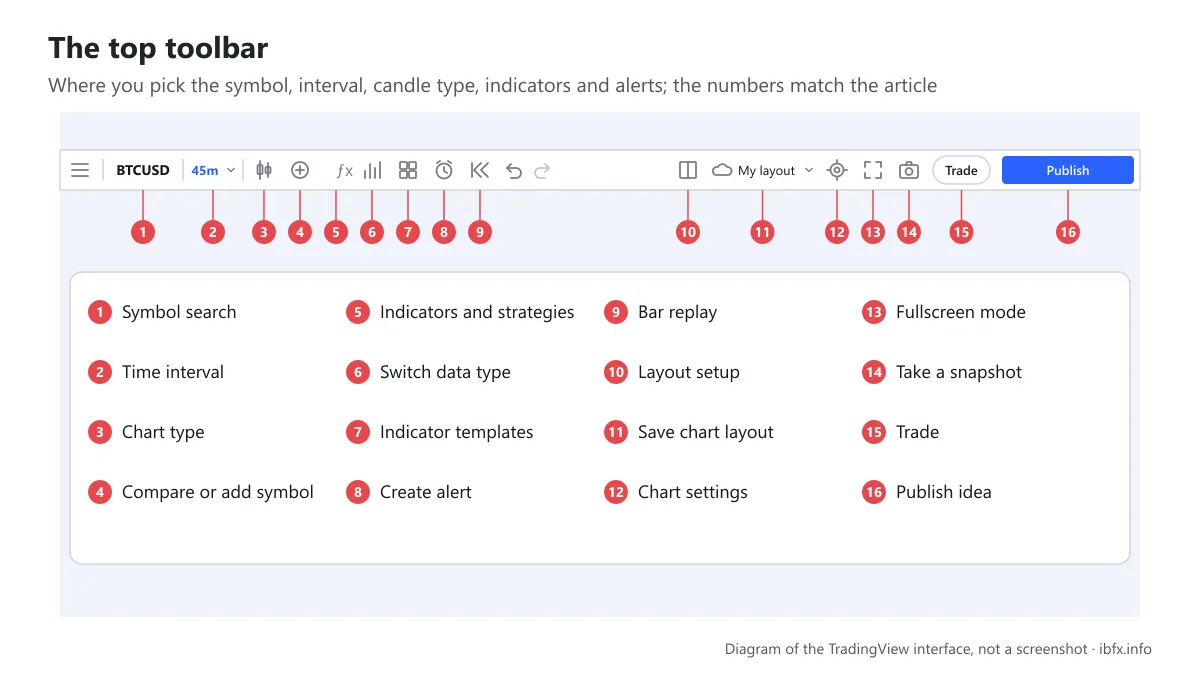
- Symbol search: where you pick other currency pairs. If you do not want to look at the current pair, just click on it and a panel like the one below opens:
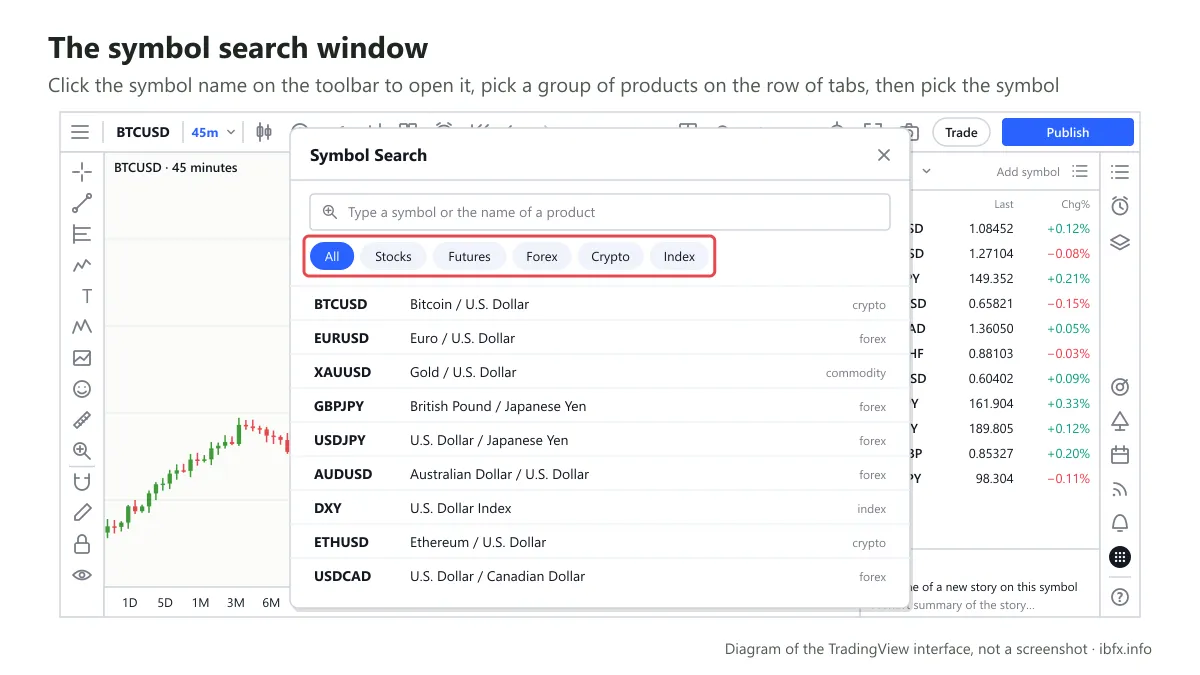
From the picture you can see that TradingView has neatly split the instruments into groups to make them easier to work through.
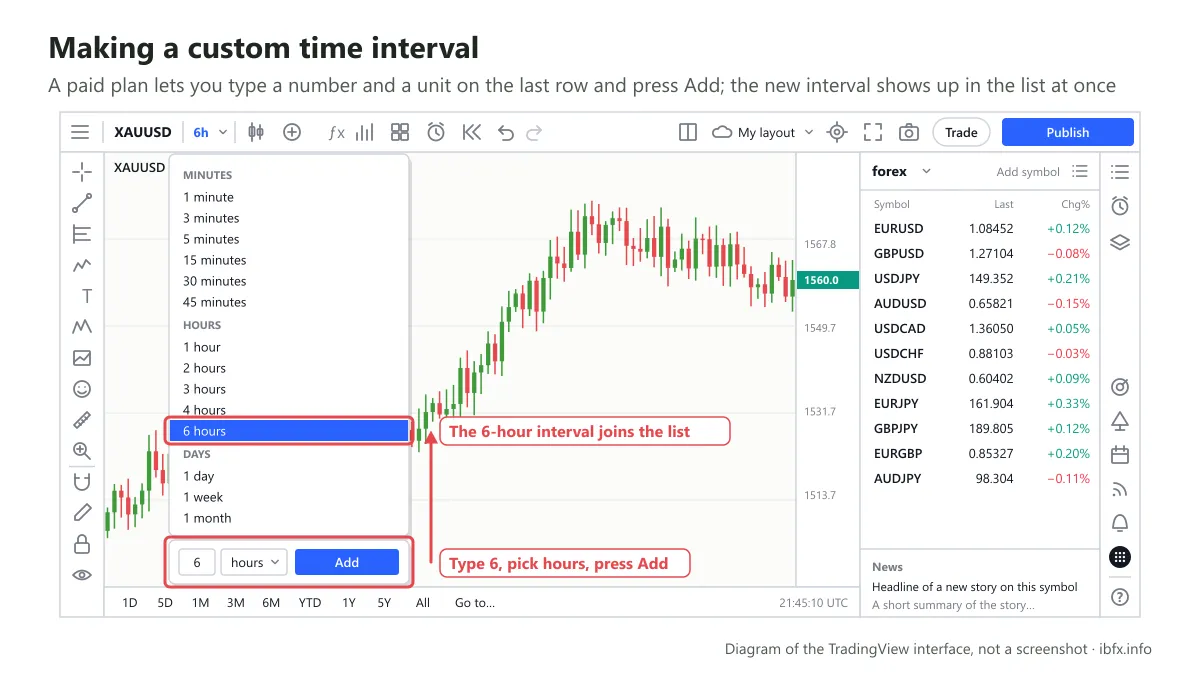
- Multiple time intervals: this holds every time interval TradingView provides. Compared with MT4, TradingView provides more of them, in 5 groups: seconds, minutes, hours, days and range.
On a paid version a trader can also make up their own interval, by pressing the add line under whichever group they want, be it hours, minutes, days or anything else.
- Chart types: where the heavy weaponry lives, and it matters a great deal for working out what information the price carries and where it is going, or more precisely for answering the question “what does the market want”. The chart most people use today is the Japanese candlestick, and Heikin-Ashi is another many traders apply. Still, understanding candles and the reversal candlestick patterns is enough to get on with.
- Compare or add symbol: a neat feature from TradingView for comparing one chart with another, so a trader can see the relationship between currency pairs more precisely.
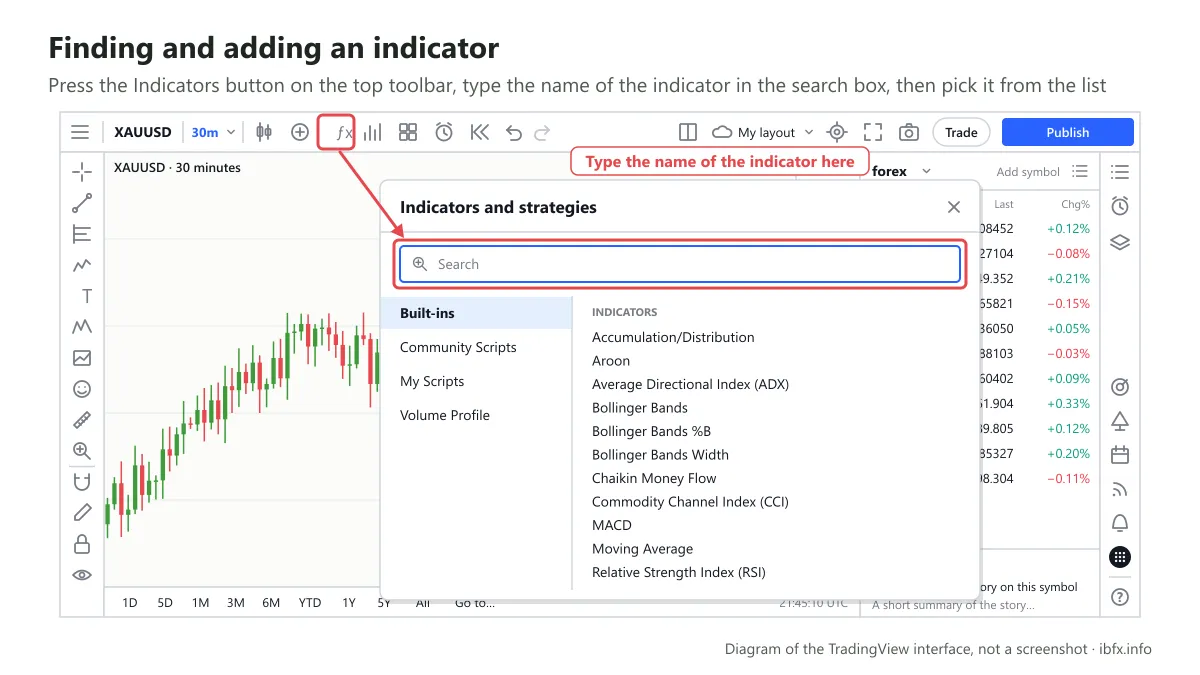
- Indicators and strategies: almost every trader combines a few things from the Left Toolbar, a trend line for instance, with the indicators in this area.
You get a great many different indicators, from the classics such as Bollinger Bands, moving averages, RSI and MACD through to Ichimoku. As with much of what TradingView supports, the indicators here come in two main kinds, free and paid. All the common ones are free, though, so there is nothing to worry about. To add an indicator to the chart, press the icon shown below and then type in the one you want:
-
Switch data type: the part TradingView set aside for traders who like to trade stocks, where the basic figures about a company sit so you can weigh up the potential and decide whether it is worth investing in.
-
Indicator templates: these are the templates TradingView builds in, or you can make up the indicator set you want and save it, so you never have to set it up again.
-
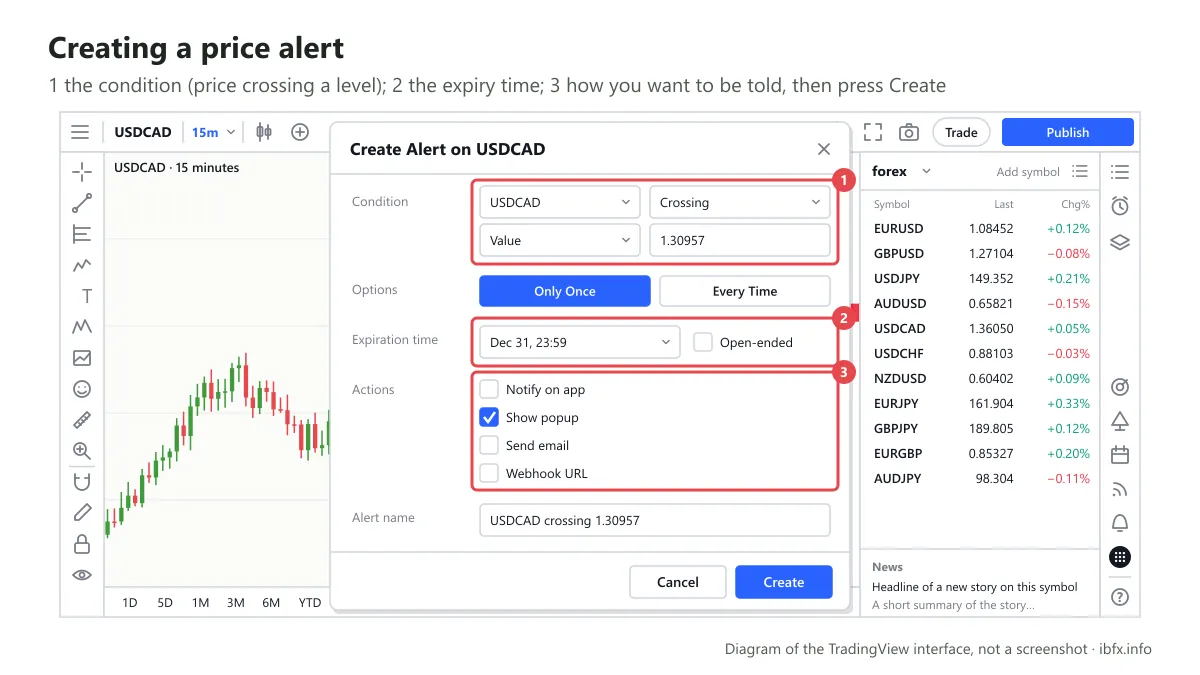
Create alert: a feature from TradingView that is genuinely useful to busy traders who cannot sit watching a screen all day. You can set an alert on the price you want in advance (say the gold price at 1560) and when the price touches that level (1560) a popup appears on screen, or you can choose to be told by email or through the TradingView app on your phone. The Basic version of TradingView only allows a very small number of alerts, and you have to delete an old one to make room. The paid versions allow more but still cap them: read on Sep 23, 2026, the number of price alerts you can have active at once is 3 on Basic, 20 on Essential, 100 on Plus, 400 on Premium and 1,000 on Ultimate.
-
Bar replay: this is the tool for backtesting, that is, for winding time back to exactly the point you want. Say the candles were running at 23:00 on Jan 10, 2020: the candles will run to that exact mark, and if you want to see how the following candles run you can click the step-forward control and a new candle forms. Very good for practising and for checking trading strategies again (the free version is capped on some intervals).
-
Layout setup: the way you split the screen into several parts, and it only shows on the paid versions. A very neat feature from TradingView, which we go into carefully later on.
-
Save chart layout: where all your analysis is saved. To save a chart you can use the shortcut Ctrl+S. TradingView also has an auto-save mode, so when you close it the chart is usually still there.
-
Chart settings: you can set the chart up as you like, from the candle color and the candle border to the time zone and more.
-
Fullscreen mode: the full picture, uncovered, for anyone who wants the whole screen.
-
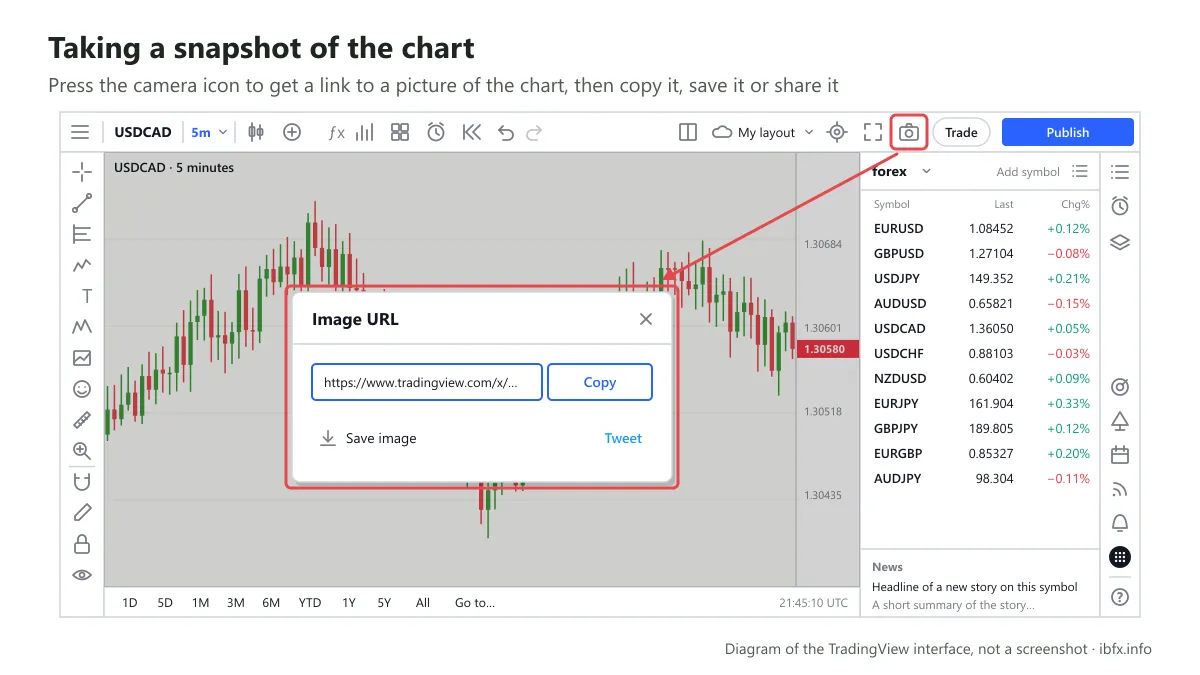
Take a snapshot: gets you a link to a picture, or shares the picture, with a single click.
- Trade: opens the trading panel. Press it and TradingView shows a Trade with your broker window holding a Paper Trading tile (TradingView’s own simulator) and a list of linked brokers you can connect a real account to. The trading panel used to sit on the strip of tabs below the chart; as read on Sep 25, 2026 this button is the only way in.
- Publish idea: share your ideas and your analysis with the community of traders on TradingView.
Part 3: the Main Chart
This is where the charts you want to look at appear. If you want to draw anything or set up any indicator, you do it here, which is why this counts as the heart of a chart on TradingView.
Beyond that, to reach more of what this area can do, just right-click and you get the picture below:
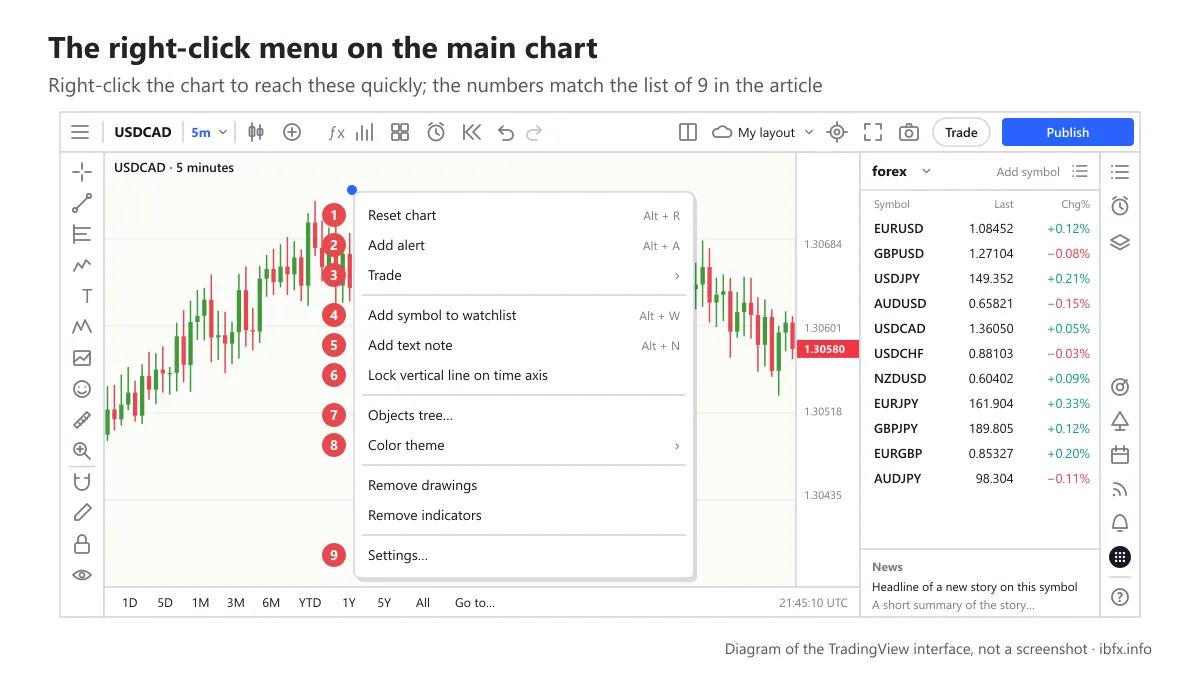
- Reset chart: a feature from TradingView that pulls the chart back to the present. When the chart has wandered too far, this one button brings you back without any scrolling.
The name “reset chart” may be misleading, but when you use this feature the lines and the indicators all stay exactly as they were; nothing is deleted.
- Add alert: much like the feature on the Top Toolbar, this adds any alert or price level a trader is interested in.
To add one, just press add alert or use the shortcut “Alt+A”, then fill in the price you want the alert on. You can set an expiry date, and tick whichever way you want to be told.
- Trade: place an order straight from the chart, on the Paper Trading simulator or on a real account at a broker you have connected. Always check which account you are on before you press the button.
- Add symbol to watchlist: much like the watchlist TradingView builds in; if a currency pair is not on your watchlist yet, you can press this to follow it or trade it.
- Add text note: a note-taking feature that does not show on the chart but sits under “text notes”. So these are entirely private notes: when you share a chart with somebody else, this note does not appear, unlike the annotations from the Left Toolbar.
- Lock vertical line on time axis: used to mark the time of a particular candle, so that when you switch to another interval you find that candle more easily.
- Objects tree: the list of tools a trader has added and used on that currency pair; if you want to close one or take it off, press the “X”.
- Color theme: you can choose a light or a dark background. TradingView added dark mode fairly recently to give users the choice.
Features such as removing all the drawing tools or removing all the indicators work the same way as on the Left Toolbar we covered above.
- Chart settings: holds the settings for personalizing a chart, much like the Top Toolbar on TradingView.
Part 4 – 5: the Right Toolbar
This area holds two things side by side: the watchlist panel (part 4) and the column of icons against the right edge of the screen (part 5). The column of icons is where you open each tool panel next to the chart.
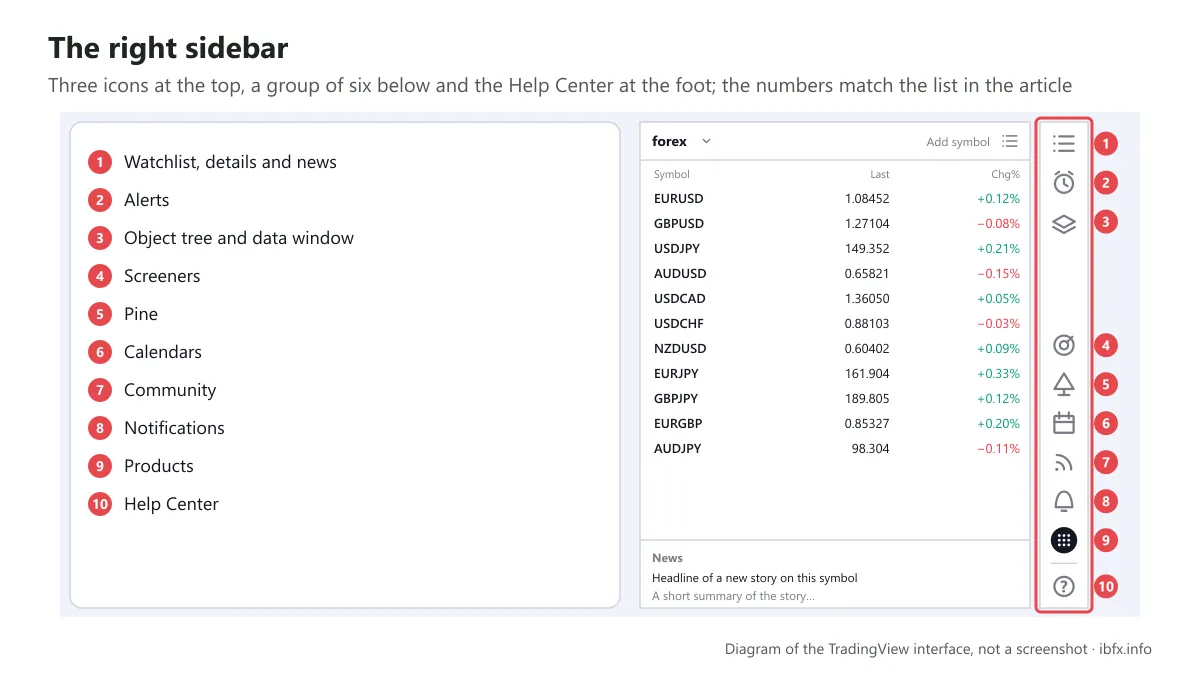
TradingView has reorganized this bar. As read on Sep 25, 2026 it carries 10 icons: three at the top, a group of six below them and the Help Center at the foot. Hotlists, My ideas, Public chats, Private chats and Ideas stream no longer have icons of their own — the social side is now gathered behind a single Community button; the Trading Panel and the DOM have moved to the Trade button on the top toolbar.
- Watchlist, details and news: this is where every instrument a trader wants to analyze or assess is held. Because TradingView links up with many different price providers, and carries no end of instruments from stocks and securities to crypto and forex, a trader can create and group their own lists of instruments to work through them more easily.
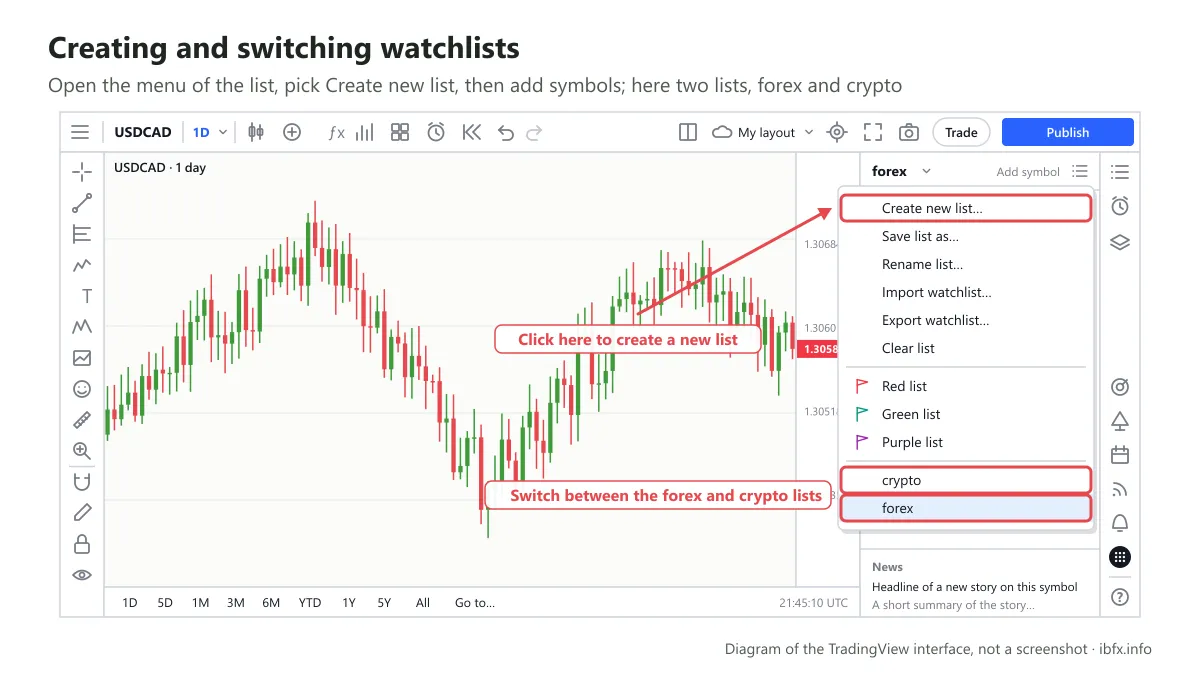
In the picture below we created 2 folders, forex and crypto, on TradingView. Those 2 folders make it easier to manage and work through the pairs. To create a folder, just press “create new list” and then add the pairs you have picked:
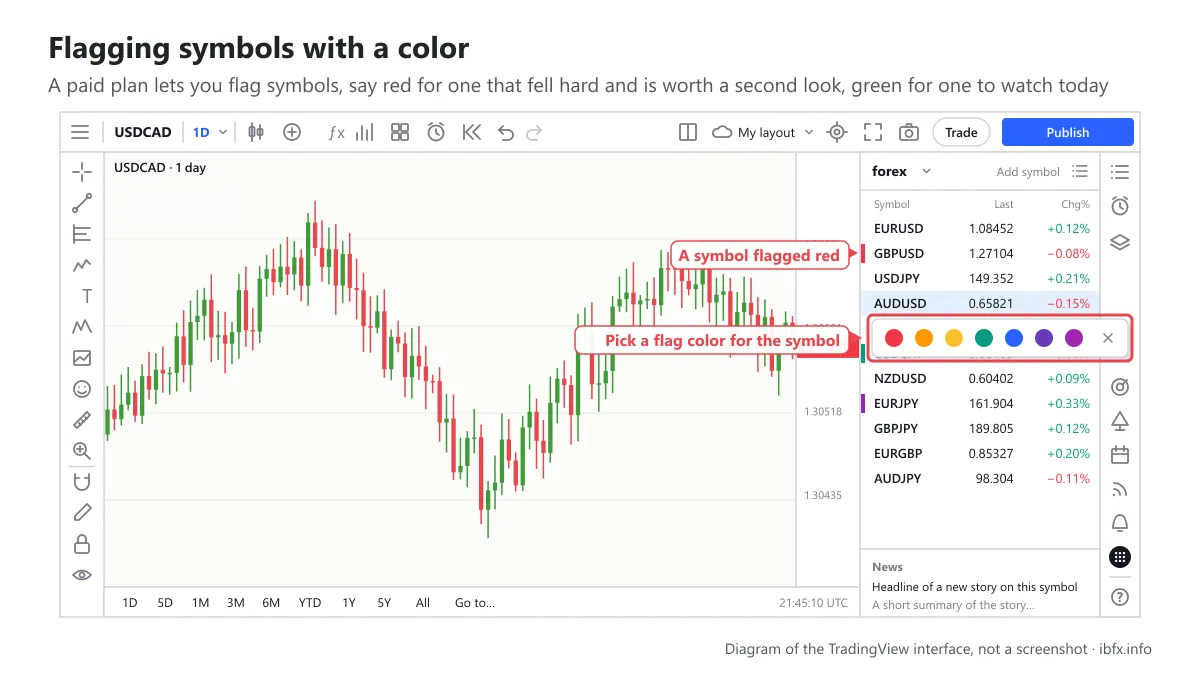
As well as managing lists of instruments, the paid version of TradingView lets you flag a currency pair in 5 different colors. For instance: red for pairs that have fallen very hard and need another look. Or green for the pairs worth noticing today, the ones to study for an entry:
Beyond instruments, the area at the very bottom is where TradingView works in news from a range of sources, so a trader can keep an eye on it without visiting any other website.
- Alerts: the list of price alerts you have set, with a log of the ones that have fired. How many alerts you can have running at once depends on your plan — see Create alert on the top toolbar above.
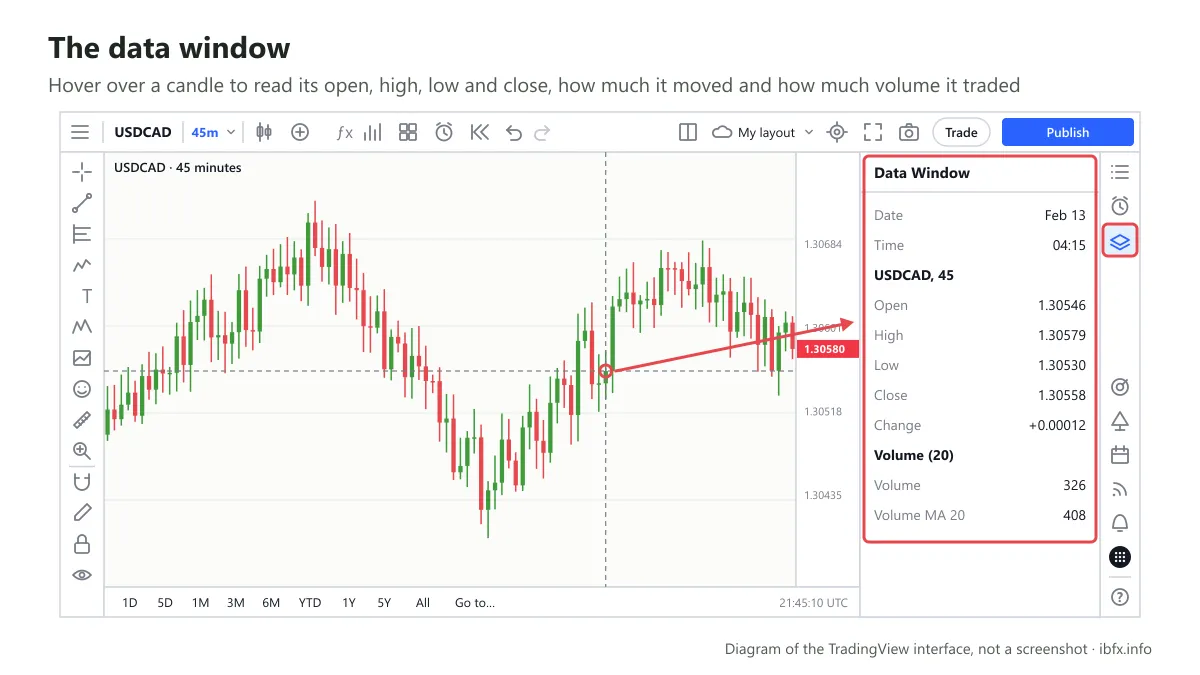
- Object tree and data window: two things behind one button. The object tree lists everything you have drawn and every indicator running on the chart, which makes it easy to find and remove one particular object once the chart gets busy. The data window gives you the particulars of each candle: the open, the time the candle ran, and figures such as the close, the open, the high and the low. If you have added an indicator, the lower part shows that indicator’s figures too. In practice this is the same as what TradingView shows on the main chart, only easier to read, because the candles are not sitting on top of the numbers:
- Screeners: where you filter symbols by conditions you set — forex, stocks and crypto each have their own screener. The screeners used to sit on the strip of tabs below the chart; they now open from here, and the screener panel still docks under the chart as before. There is an example in the screener section below.
- Pine: where you open the Pine Editor to write your own indicator or strategy in TradingView’s Pine Script, together with the Strategy Tester. Both of those also used to sit on the strip of tabs below the chart.
- Calendars: gives you the economic calendar and the earnings calendar (for traders who trade stocks). Another convenience: instead of visiting ForexFactory, you can pick up the events coming in the near future right here.
- Community: one button that gathers the whole social side of TradingView, the part that used to be split across several icons. Inside it are the ideas you have published, the stream of ideas TradingView suggests, private messages and the chat rooms.
If you want to share a view with other traders, publish an idea (the Publish idea button on the top toolbar). The more you publish, the more you practise your own analysis, and the more of a following and reputation you build; your name can make the list of “top authors”.
The public chat rooms in particular are not open to every account: TradingView sets a condition on either a paid plan or reputation points. The exact figure is only visible once you are signed in, so check it inside your own account.
- Notifications: every notification to do with your account appears in this area: who just liked or commented on your analysis, who has started following you and so on.
- Products: a menu through to TradingView’s other products (the standalone Screener screen, the heatmaps, the full economic calendar and so on). It is the way out of the chart screen, not a charting tool.
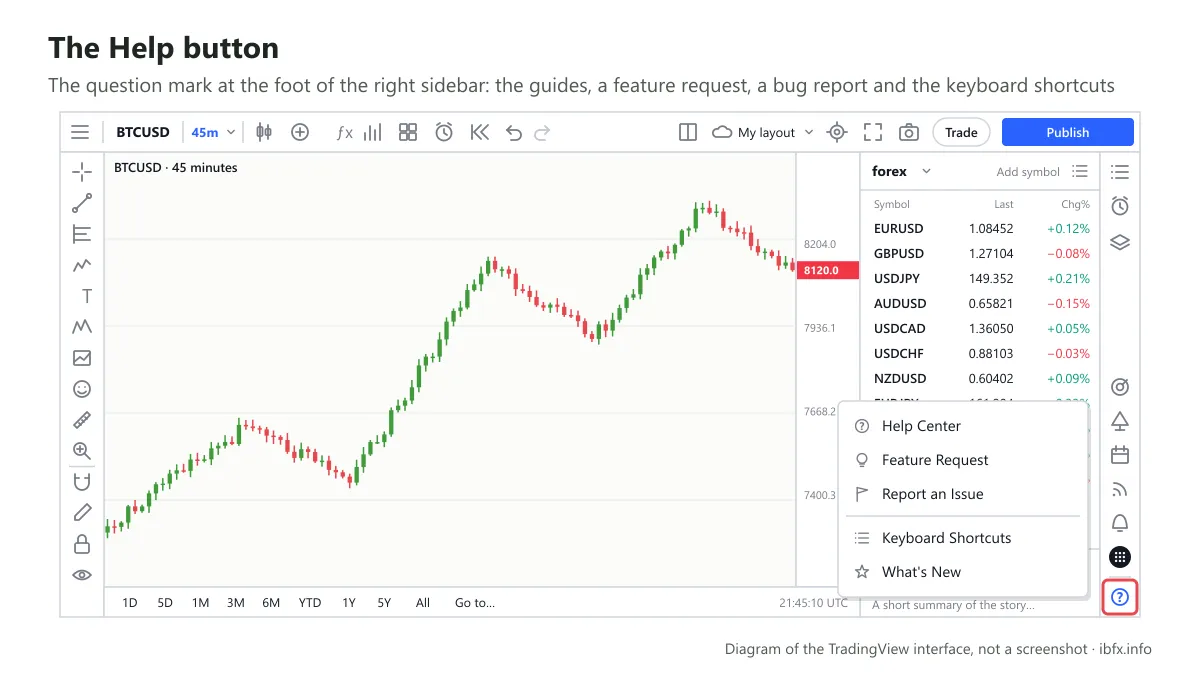
- Help Center: the question mark at the foot of the bar, which opens the guides, a feature request, a bug report and the table of keyboard shortcuts.
Trading is no longer on this bar. The order ticket and the DOM (depth of market) used to have their own icons here; you now open them with the Trade button on the top toolbar. That window holds a Paper Trading tile (TradingView’s own simulator) and a list of linked brokers you can connect a real account to.
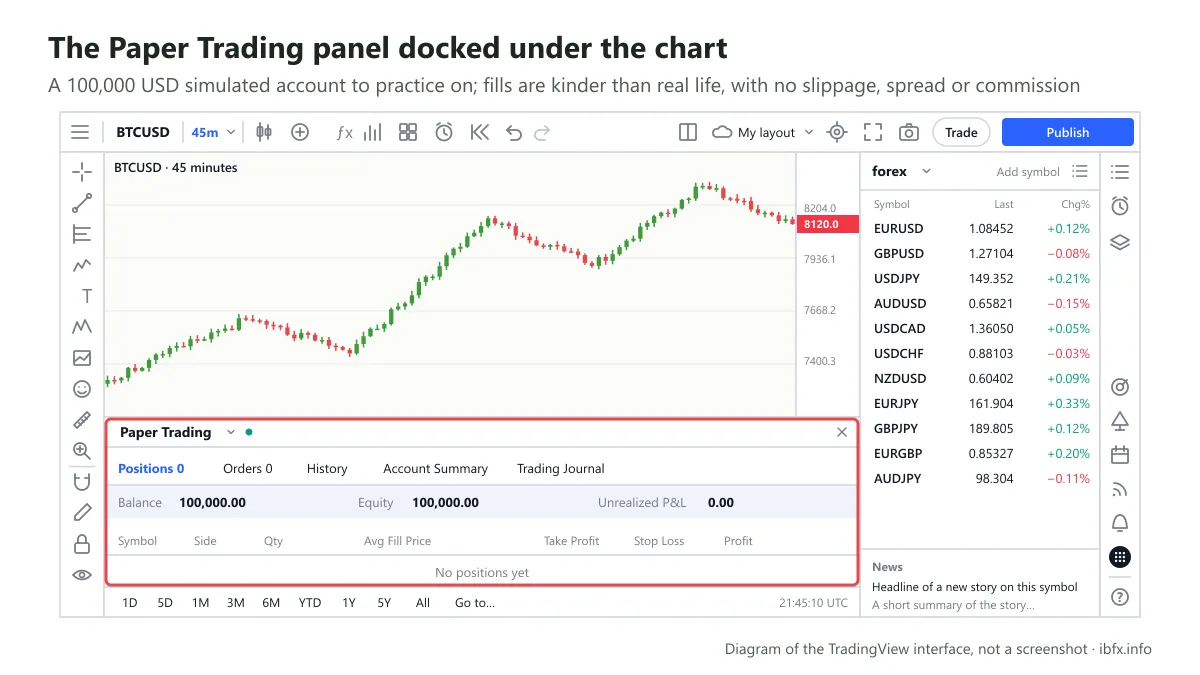
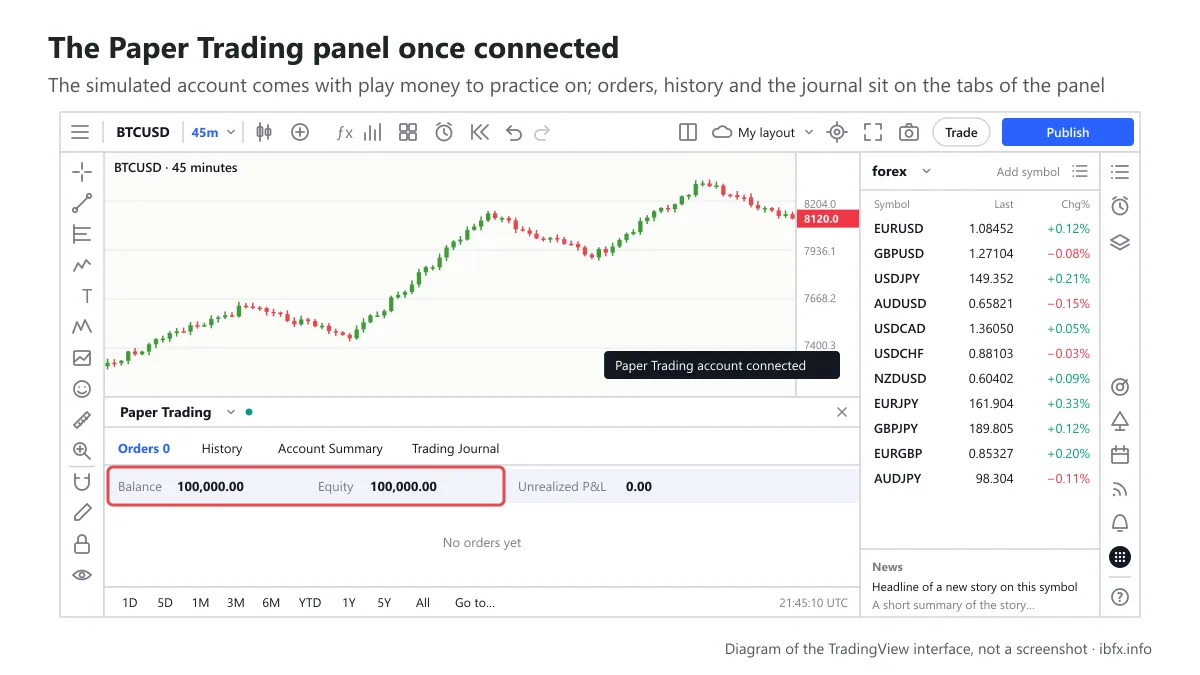
Note: only Paper Trading is a simulated account; when you connect a broker’s account, the orders are real orders with real money. With Paper Trading, the moment you connect there is play money in the account to practise on; the diagrams here use 100,000 USD as an example, and the balance you actually get may differ. You can reset that balance in the trading panel settings. We go into it carefully in the Paper Trading section below.
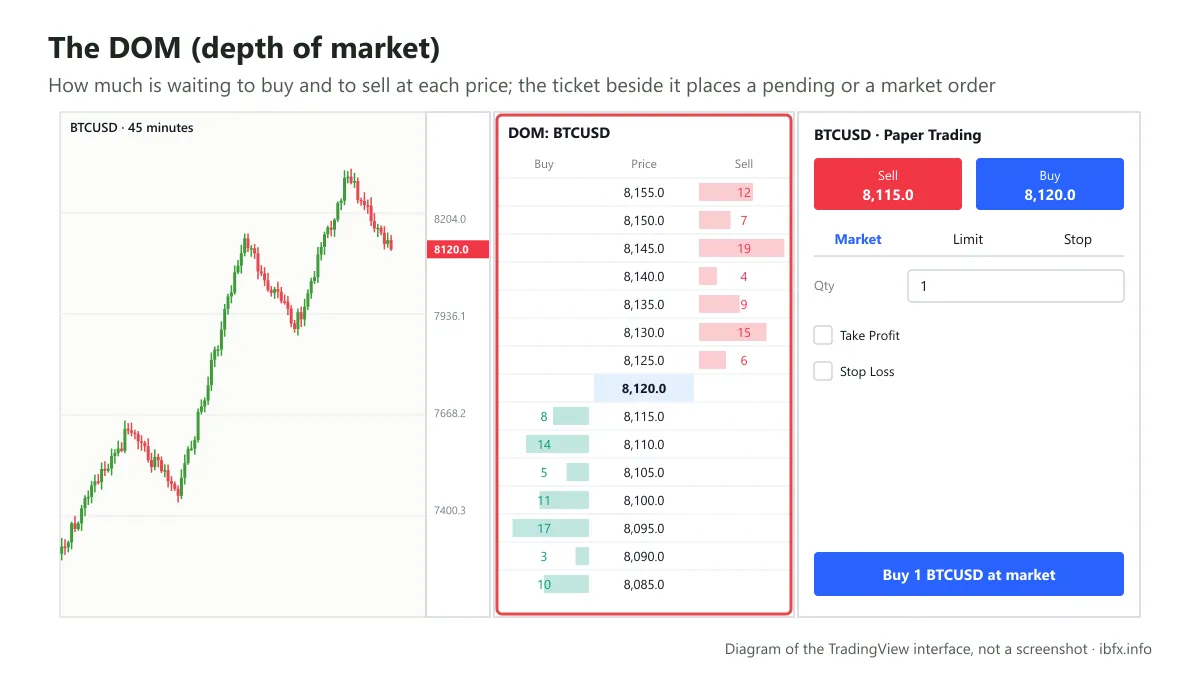
DOM is short for Depth of Market, where you see all the bid and ask levels. From the DOM you can also place a pending order or an order at the market price. The DOM now lives inside the trading panel, so it opens from the Trade button above as well:
Last of all, the question mark at the foot of the column (item 10) opens the Help Center:
Part 6: the Bottom Toolbar
This bar is very short now. As read on Sep 25, 2026 it holds only the strip of range buttons (1D, 5D, 1M, 3M, 6M, YTD, 1Y, 5Y, All), a Go to… button for jumping to a particular date, and the UTC clock at the right edge.
The old strip of five tabs — screener, text notes, Pine Editor, strategy tester, trading panel — has been dropped. Where each tool went:
| Old tool on the bottom bar | Where it opens from now |
|---|---|
| Forex, stock and crypto screeners | The Screeners button on the right sidebar |
| Pine Editor, Strategy Tester | The Pine button on the right sidebar |
| Text notes | The Text tool on the left toolbar, written straight onto the chart |
| Trading panel, Paper Trading, DOM | The Trade button on the top toolbar |
What has not changed is where the panels appear: wherever you open them from, they still dock under the chart as before.
The screeners. As well as forex, TradingView has screeners for stocks and for cryptocurrencies. This area holds a great deal of information about the bid and the ask of one currency against the others. In the picture below we are filtering every symbol quoted against GBP:
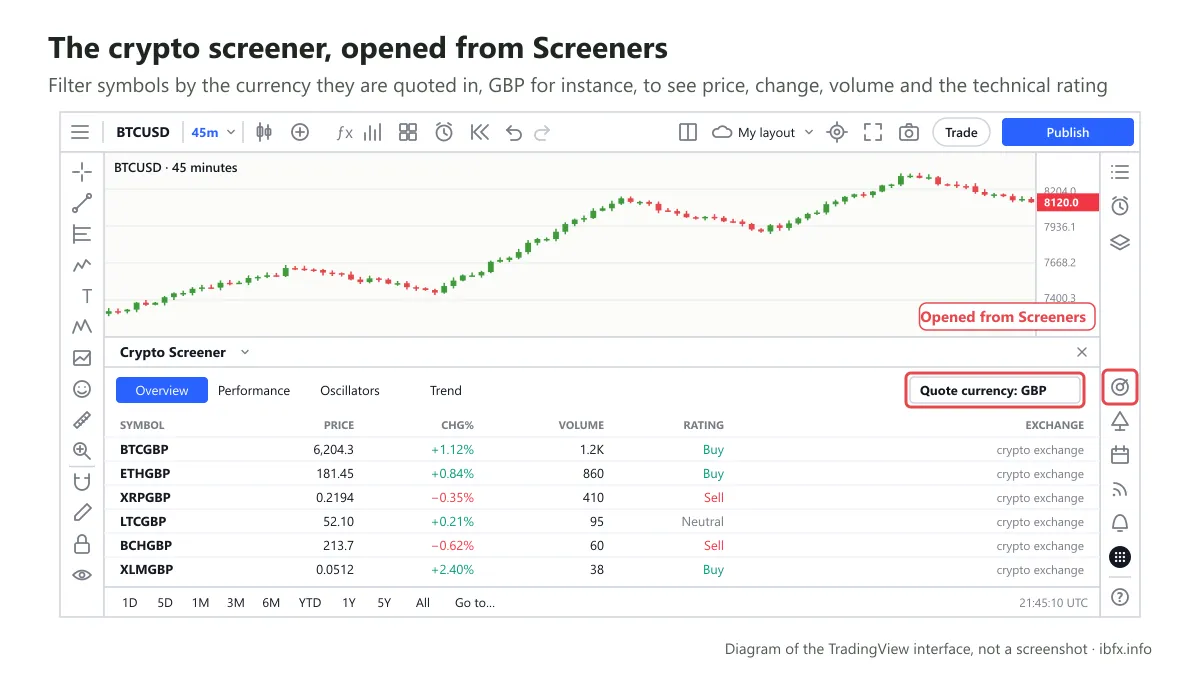
If you know a fair amount about fundamental analysis and about currencies, this is the place that gives you the broadest view of a currency.
Paper Trading. This is a simulated account TradingView provides for you to practise trading on. How to open it:
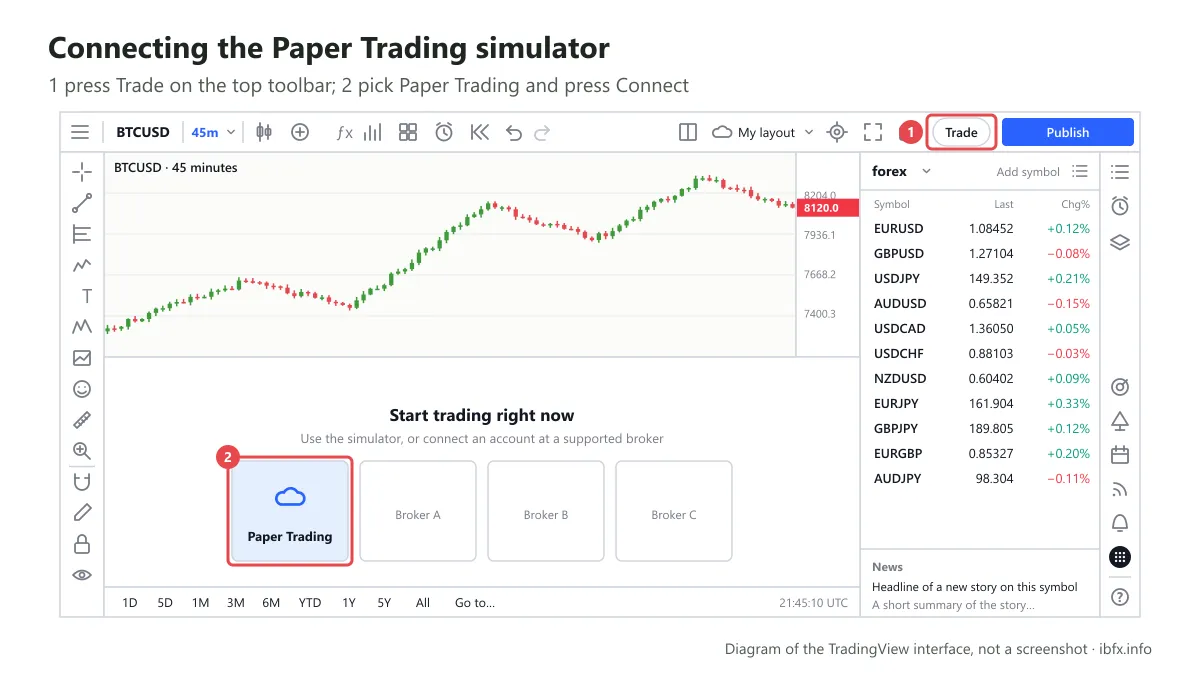
Press the Trade button on the top toolbar and TradingView opens a Trade with your broker window. The first tile is Paper Trading, and the rest are the brokers it links to. Pick Paper Trading and press Connect. Because this is only a demo account, once you have connected you are credited with play money to trade with straight away, without any KYC verification or anything else.
The interface once you have connected the account looks like this:
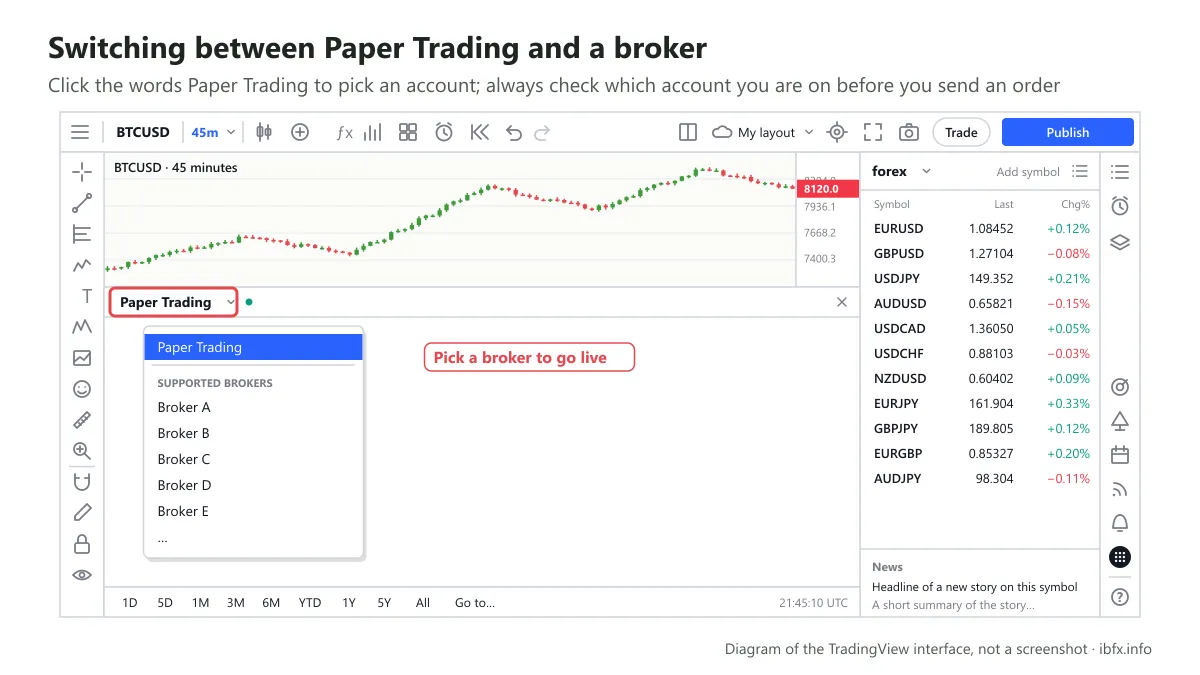
If you want to switch over to an account at a broker you have linked, press the words Paper Trading and pick that broker (at which point it is a real account).
Paper Trading runs on real-time prices, which makes it a useful feature for a new trader: without signing up at a forex broker you can still practise your analysis and practise placing orders. Note, though, that fills on Paper Trading are kinder than real life (there is no slippage, no spread and none of the commission you get at a broker), and you feel none of the pressure of losing real money, so practice results usually look better than trading for real.
Some tips and features worth knowing when you use TradingView
If you have traded for a while, or used TradingView for a while, everything above may already be familiar to you. So you need not read it again. Instead, have a look at this second part, in case there are things TradingView provides that you did not know about; if so, put them to work straight away. They are genuinely useful and they get the most out of your analysis.
Showing a whole row of time intervals
Any trader analyzing a currency pair has to analyze several intervals to judge the trend and to find an entry. Usually traders work from the larger interval down to the smaller one. That is, they may look at W and D first, and only then at H4, H1 or M15, M30, even M5.
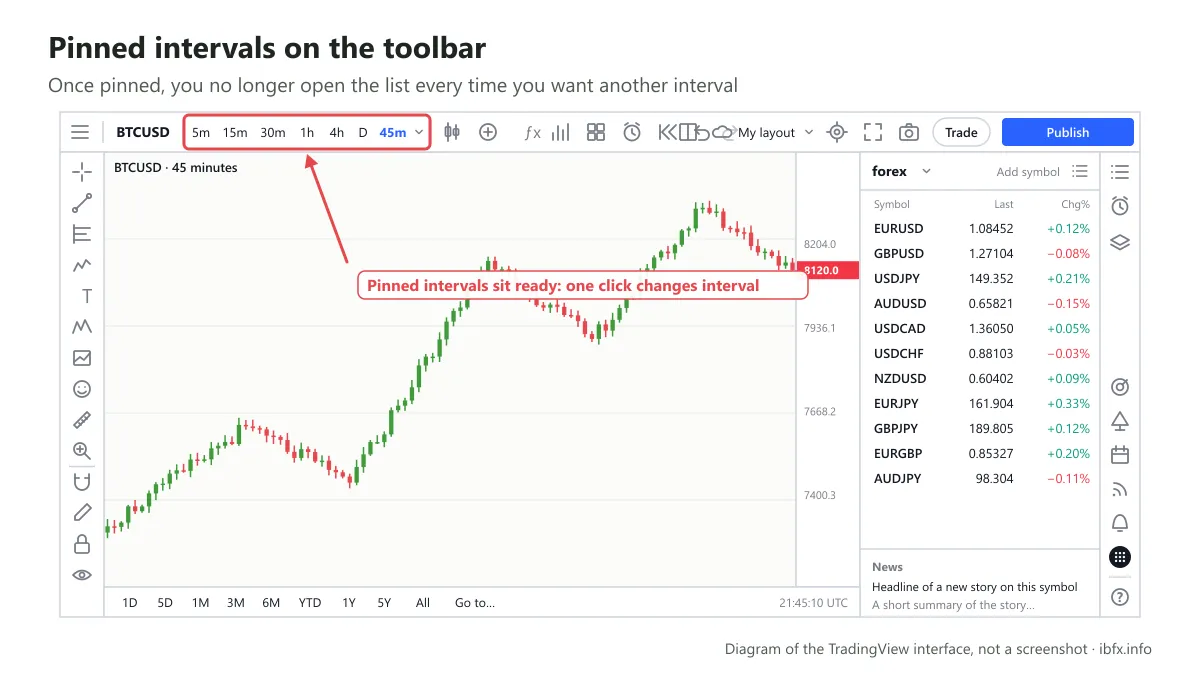
That means every time you want a look, you have to click each of those intervals on the chart, which is slow. So if you use certain intervals often, you can have them all appear right on the main chart to make them easier to reach:
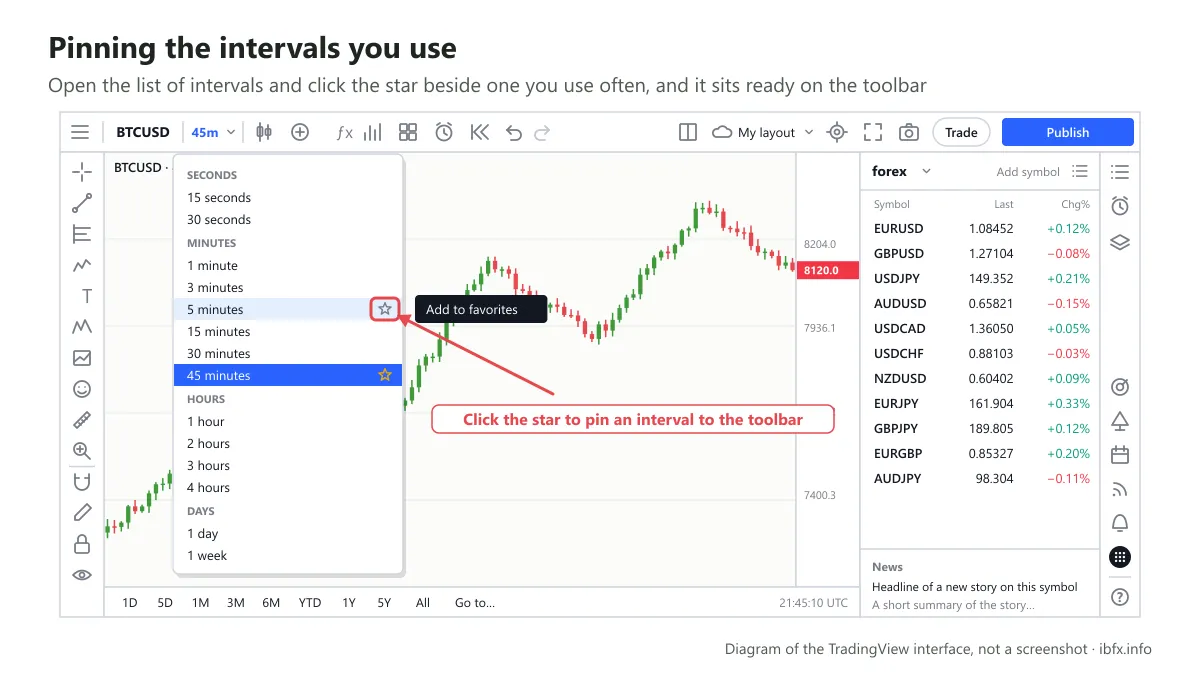
All you do is open the interval section, find the one you often analyze on, look to the left and you will see the “add to favorites” line; press it, as in the picture above.
And here is the result once you have ticked all your intervals: they sit on the main chart, and you no longer click several times to reach each one.
Turning event information off
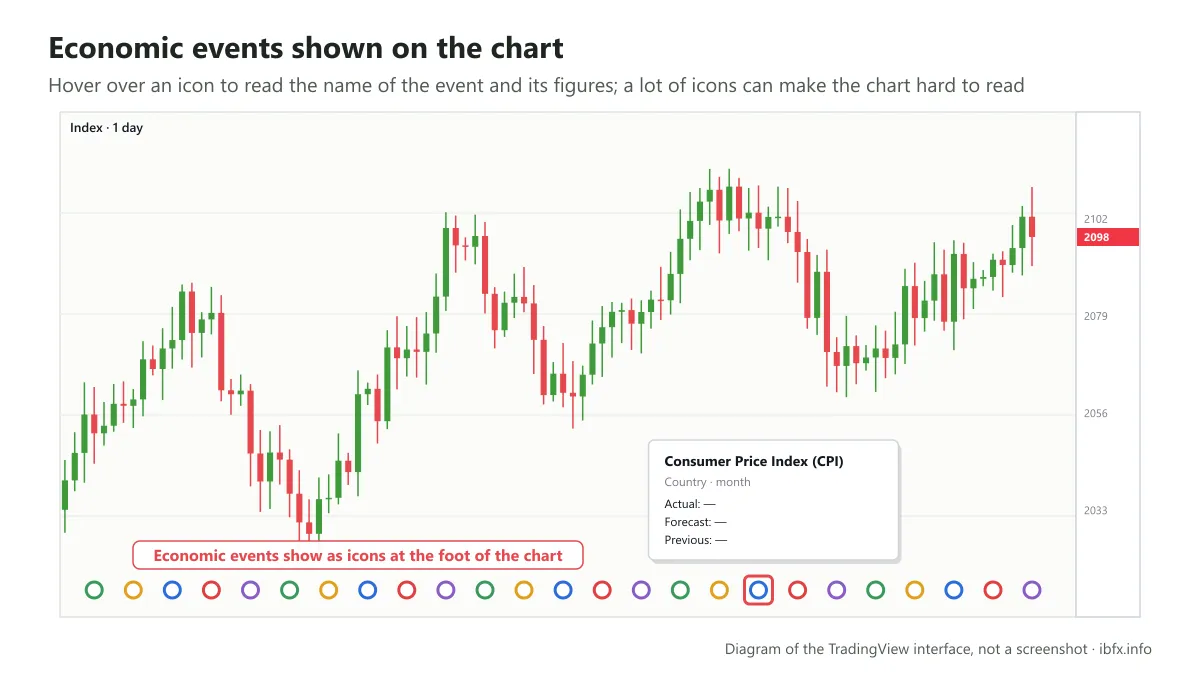
Event information means the events happening on the currency pair you are analyzing, the little round marks down the right-hand side of the main chart. This part is rather annoying, because the marks tend to mix into the chart and make it harder to read:
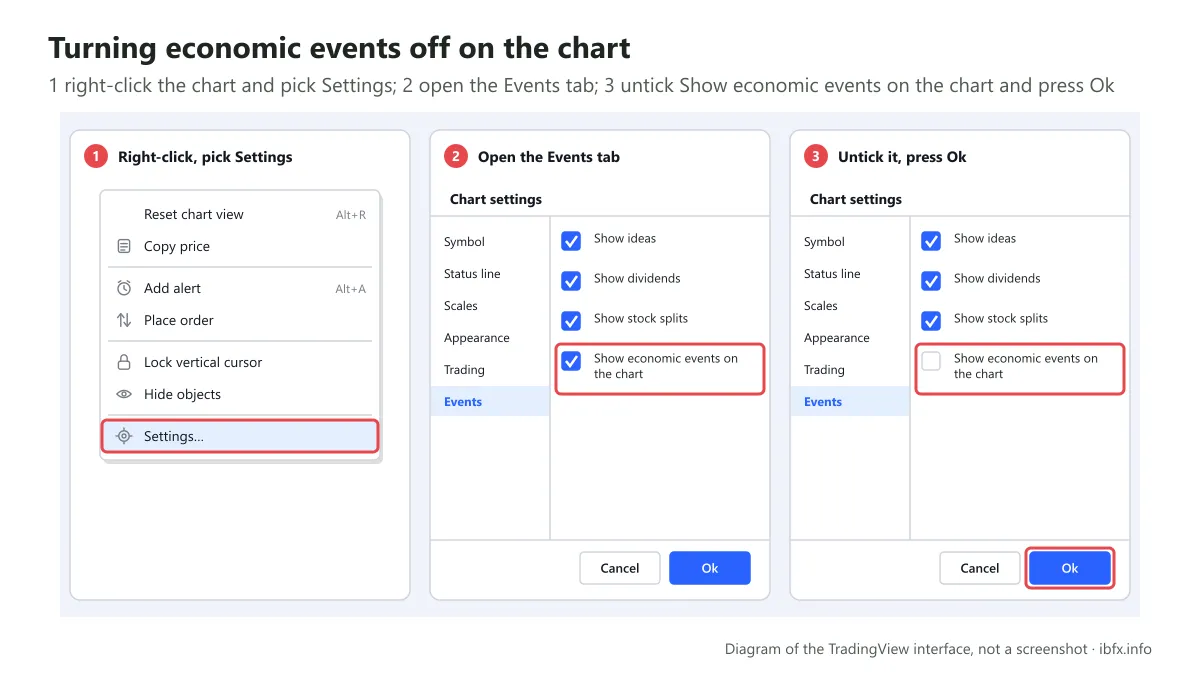
To turn this off, right-click the main chart, choose settings, find the “events” line, untick “show economic events” and press Ok:
Splitting the chart
This is the TradingView feature we like most. Splitting a chart on TradingView gives you 2 options: lay the panes out with different instruments, or all on the same instrument. MT4 has this feature too, but the interface on TradingView is far easier to read and far friendlier.
All you do is press “layout setup” and a panel of layouts appears; pick the one you want, split in 2, in 3 or in 4. Note that this feature only comes with the paid version:
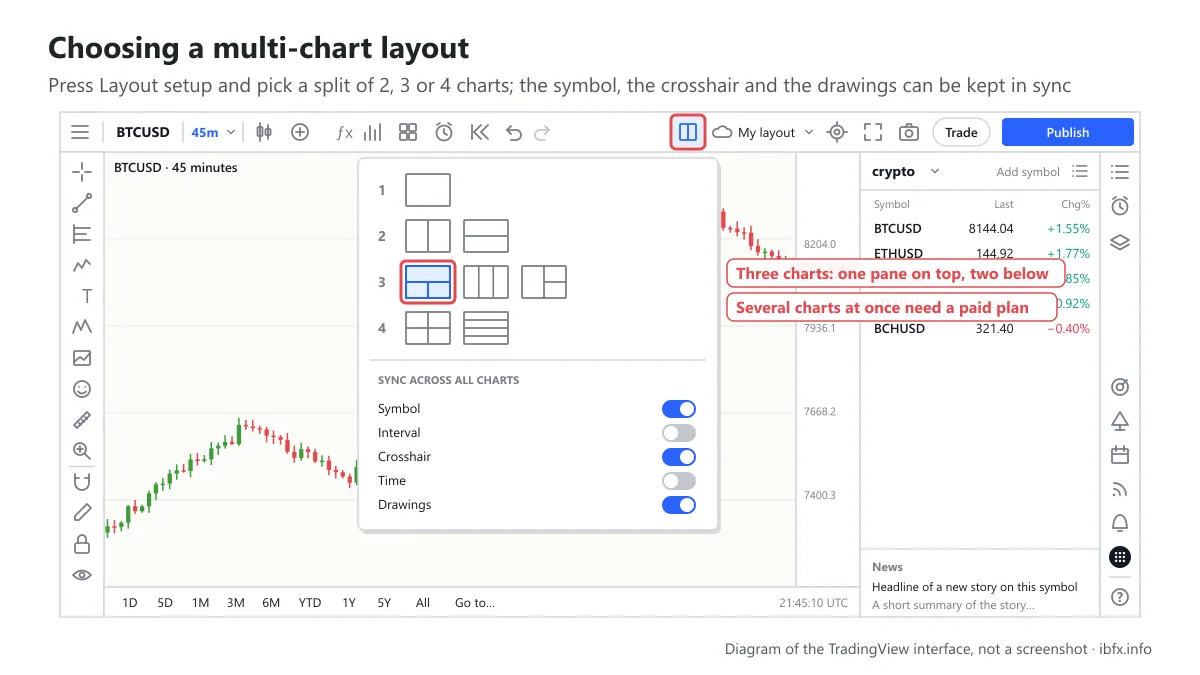
Say we pick the 3-pane layout; the main chart area then looks like this:
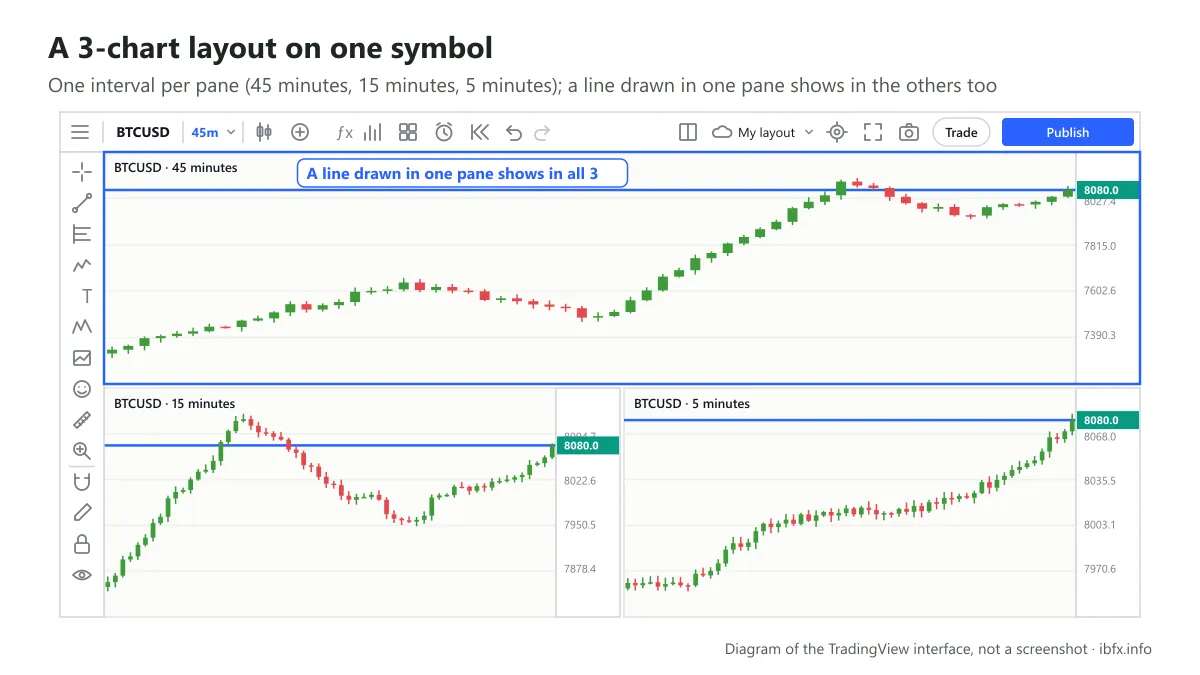
As you can see, the screen now carries 3 different intervals, M5, M15 and M45. That is excellent if you want an overall view of the price on the same instrument at different scales, to see how it runs.
Even when you draw a trend line in one pane, the same trend line appears in the others at once, which makes it easier to watch the price move and to analyze it better. And of course, although the screen holds 3 panes, none of the features are cut back: you can use all of them to analyze the trend.
Jumping to a particular date
This feature suits anyone who wants to backtest or to study the history of the price at a particular moment. If you want to look at the gold chart on Jan 1, 2019, say, and you only drag the chart by hand, there is no telling when you will get there. So to save time, use this feature, as in the picture below:
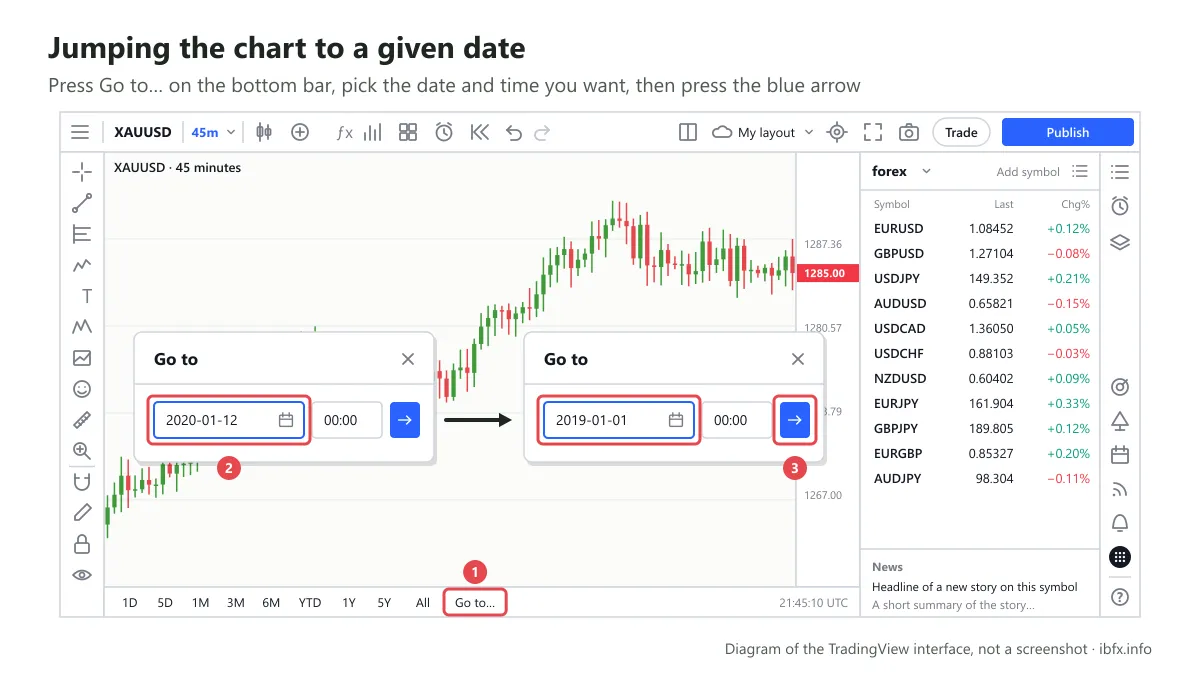
All you do is press “go to”, a date box appears, you pick the date and time you want the chart to move to, and press the blue arrow.
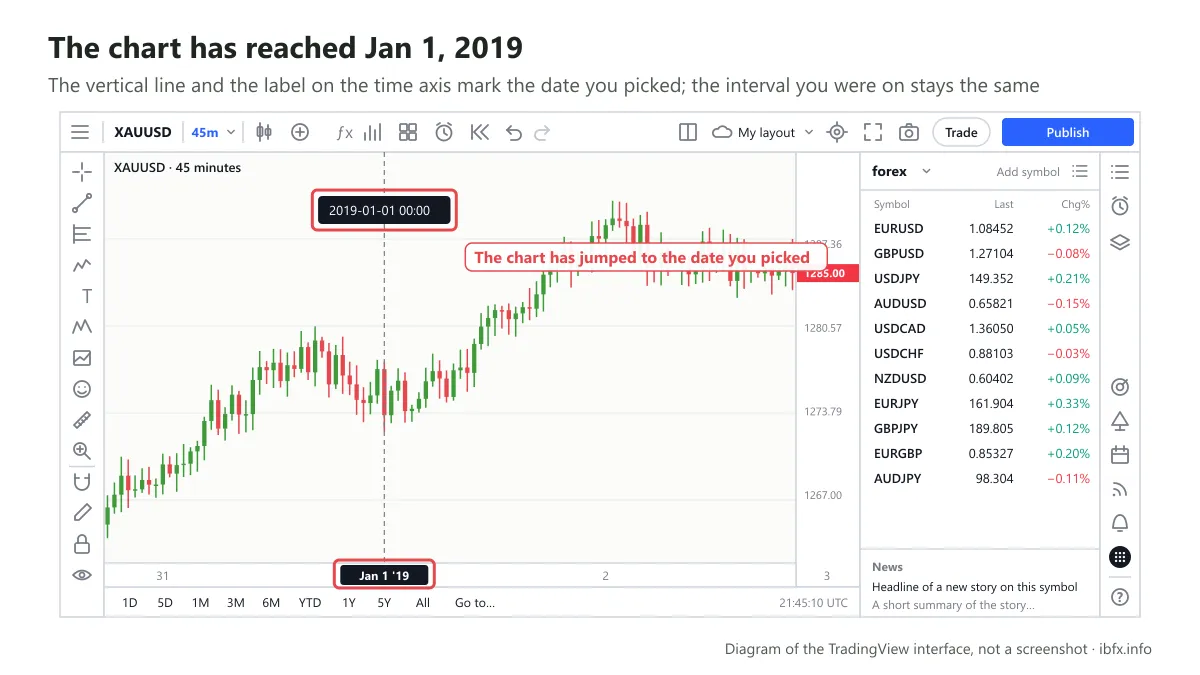
And here is the result. The chart runs to Jan 1, 2019 exactly, on the interval you are using, so you do not have to drag until your arm aches. Rather good, no?
The undo feature
While you analyze, you may draw a great many trend lines and pile plenty of indicators and tools onto one chart, which makes it very hard to read.
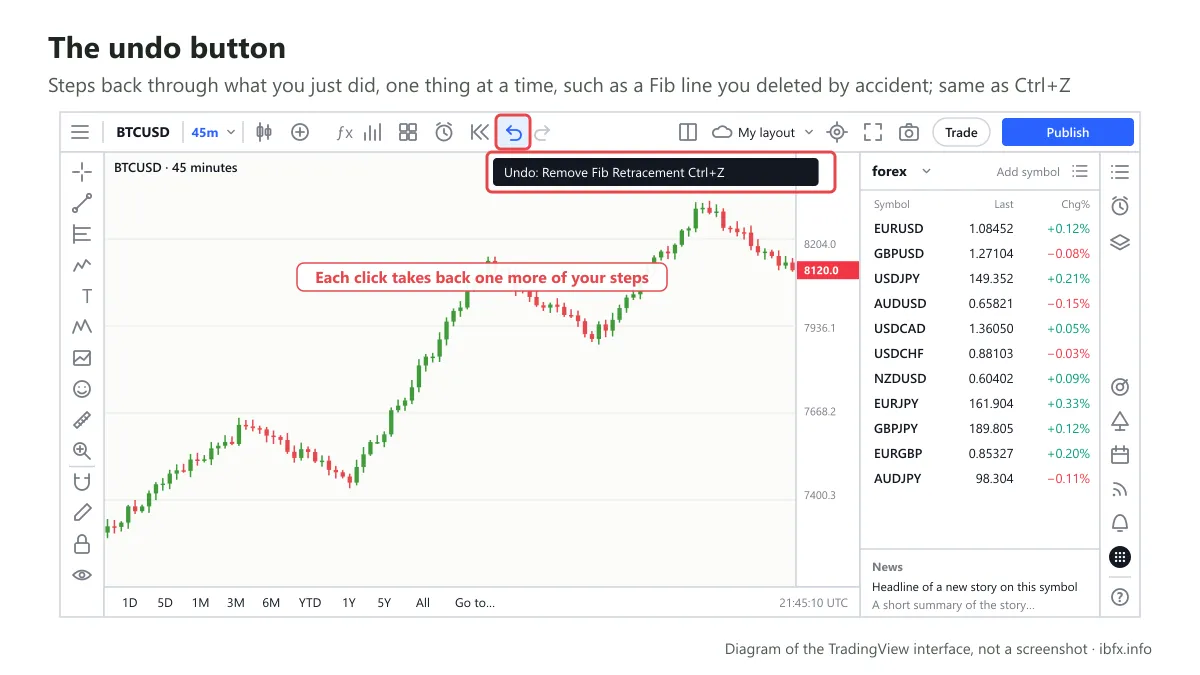
If you press this button, they go back to how they were before you drew them, much like the shortcut Ctrl+Z. This feature works a little differently from removing the drawing tools or removing the indicators, which we covered earlier.
That is because you can take off one thing at a time, the ones you do not like, rather than everything at once. And if you take off a tool by accident, you can press the box in the example below to bring back each piece you deleted:
Showing a drawing only on certain intervals
This one is extremely useful, above all when you use the Gann and Fibonacci tools. Because of the syncing TradingView sets up, what you draw appears on every interval. If you draw on a large interval such as W and then drop down to M5, you will find the Fibonacci covering all the candles, which is very hard to read. So if you only want it on certain intervals, double-click the tool you drew, open the Visibility tab and untick the intervals you do not want it on.
Pulling out the tools you use most
When you analyze a price you often have to combine trend lines with a whole set of indicators such as Fibonacci or Elliott waves, or the patterns TradingView builds in. And each time, you have to click each pattern and then pick the indicators, which is slow. So to save time, if you use a tool often, pull it right out by pressing the box beside the star, “add to favorites”, the way we showed you with the intervals above:
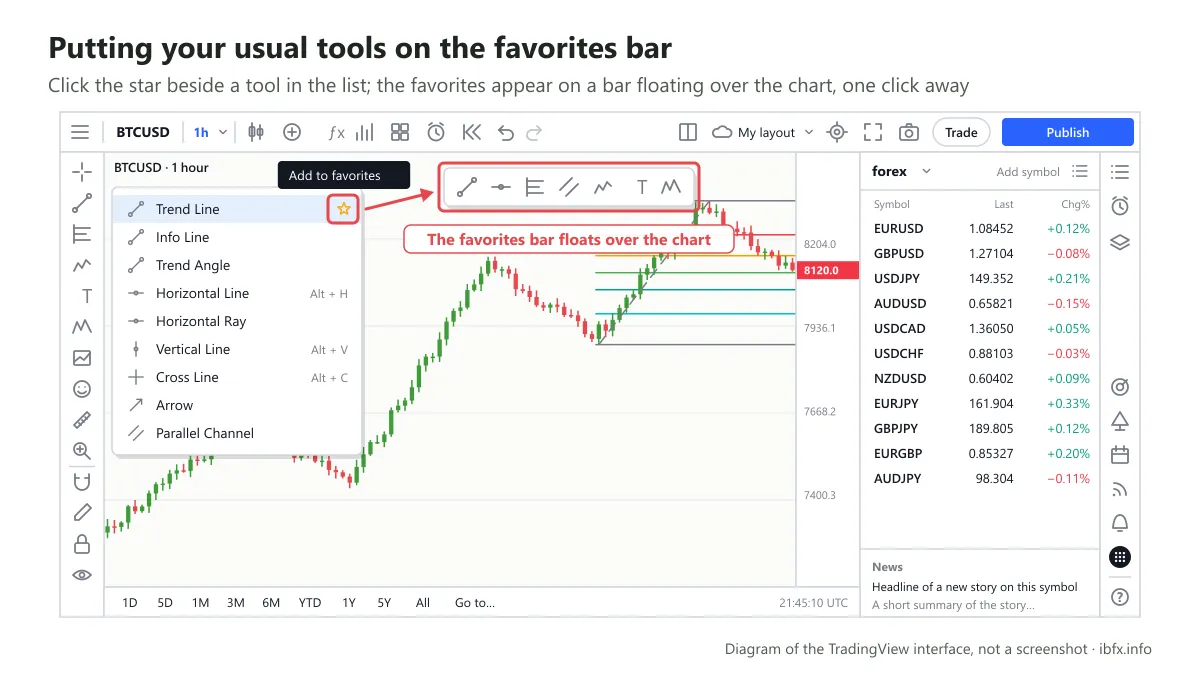
Keeping your notes from wandering off
If you use the “text” annotation on one interval, then switch to another, the annotation jumps a very long way off and you cannot find it.
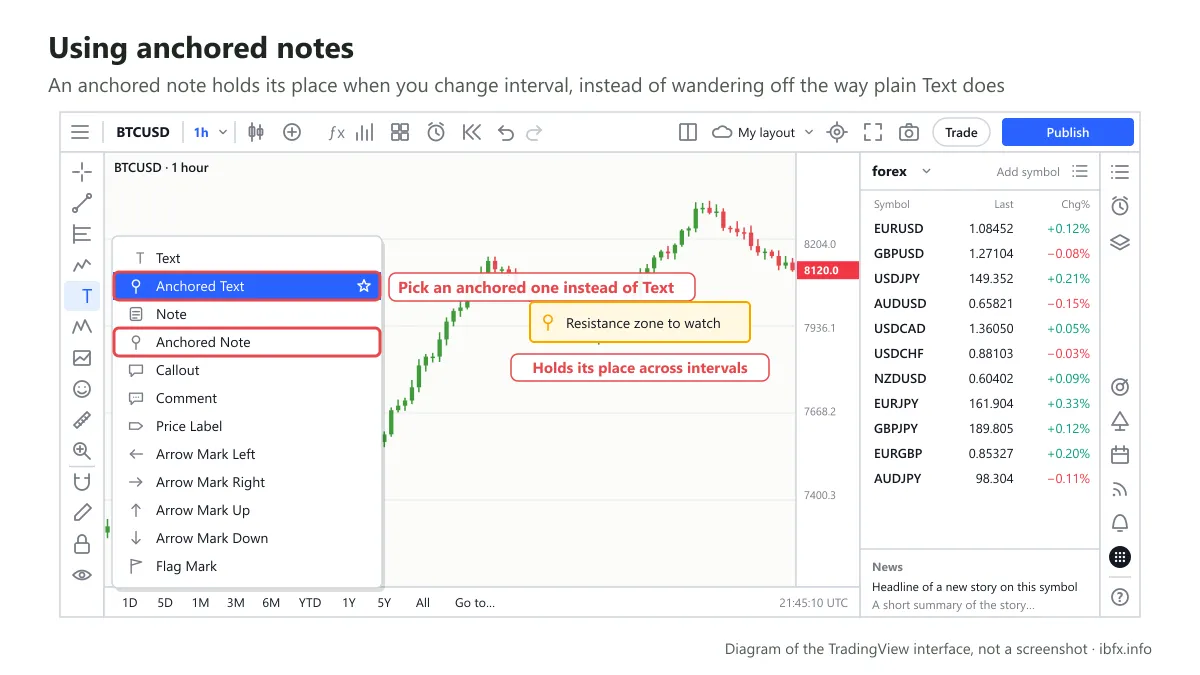
So instead of “text”, pick “anchored text” or “anchored note”. And wherever you anchor these annotations, they still appear in that exact spot when you switch to another interval, which makes them easy to see or to remember on later days, or in a later session.
The quickest way to add currency pairs
When you first come to TradingView, they only give you a certain set of currency pairs. Some of them will be pairs you have never heard of and will not use. So each time you change account or sign up for a new one, you have to enter this section again with the pairs you want.
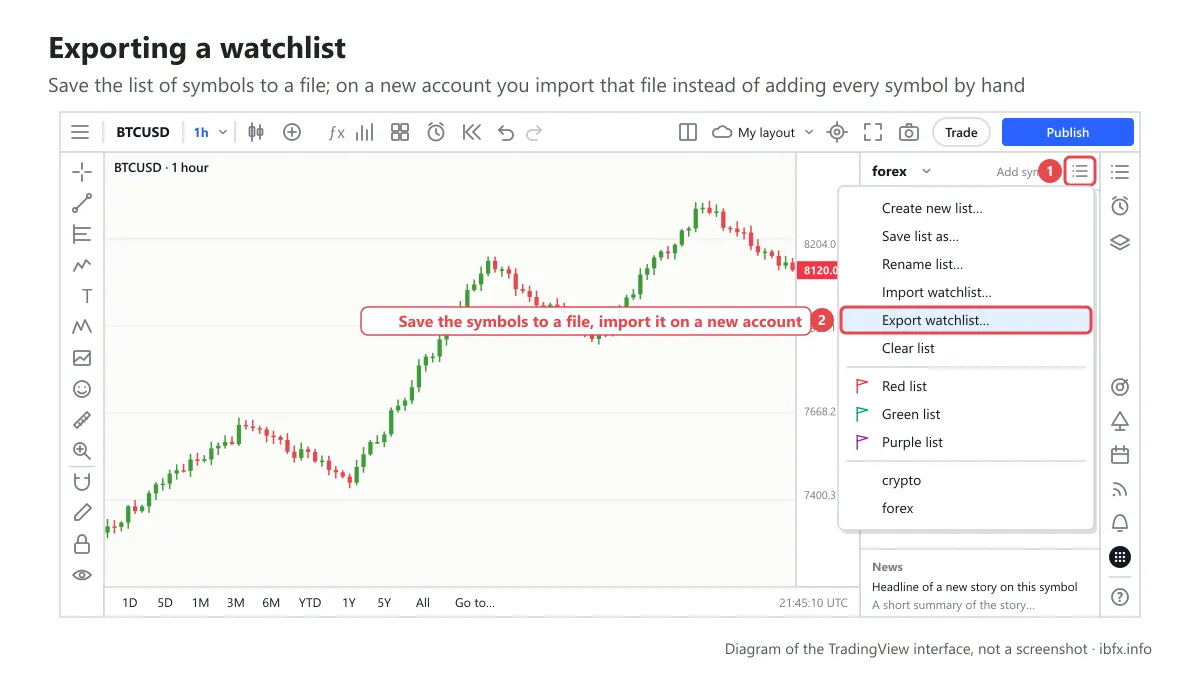
To save time you can “export watchlists”. Later, if you move to a new account, you import that list. TradingView pulls in every currency on the list for you, with no need to enter them one by one.
That is the whole guide to using TradingView; we hope the article is of use to you.