On this page
Before you open a position, you need two numbers: how much you lose if you are wrong, and how much you get if you are right. The R:R ratio (risk:reward) puts those two numbers side by side. It does not tell you whether a trade will win or lose, but it does tell you how often you need to win in order not to lose money over the long run.
This article follows on from the stop loss guide and the take profit guide. The numbers in it are illustrative examples, not the results of any particular strategy.
What is the R:R ratio?
- Risk is the amount of money you lose if price hits your stop loss.
- Reward is the amount of money you receive if price hits your take profit.
- R:R = risk : reward. An R:R of 1:2 means you accept losing 1 part for the chance of gaining 2 parts.
Two ways of writing it are common: “1:2” (risk first) and “2R” (the reward is 2 times the risk). Some software writes it the other way round, as reward:risk 2:1. When you read a document or use a tool, check which number is the risk so that you do not misread it.
How to calculate R:R
R:R = distance from the entry price to the stop loss : distance from the entry price to the take profit
For a position with the same size at both ends, counting in pips is enough:
| Position | Stop loss | Take profit | R:R |
|---|---|---|---|
| Buy EUR/USD at 1.17000 | 1.16800 (20 pips) | 1.17400 (40 pips) | 20 : 40 = 1:2 |
| Sell GBP/USD at 1.35000 | 1.35300 (30 pips) | 1.34550 (45 pips) | 30 : 45 = 1:1.5 |
| Buy USD/JPY at 147.00 | 146.50 (50 pips) | 147.50 (50 pips) | 50 : 50 = 1:1 |
Counting in money gives the same ratio: the 0.1 lot EUR/USD position on the first row (about 1 USD per pip) has a risk of 20 USD and a reward of 40 USD. If you take profit in parts, or have several take profit levels, work the reward out as the average of those parts to get your real R:R.
The win rate you need to break even
Let R be how many times the reward is compared with the risk (with an R:R of 1:2, R = 2). If every position closes exactly at the stop loss or at the take profit:
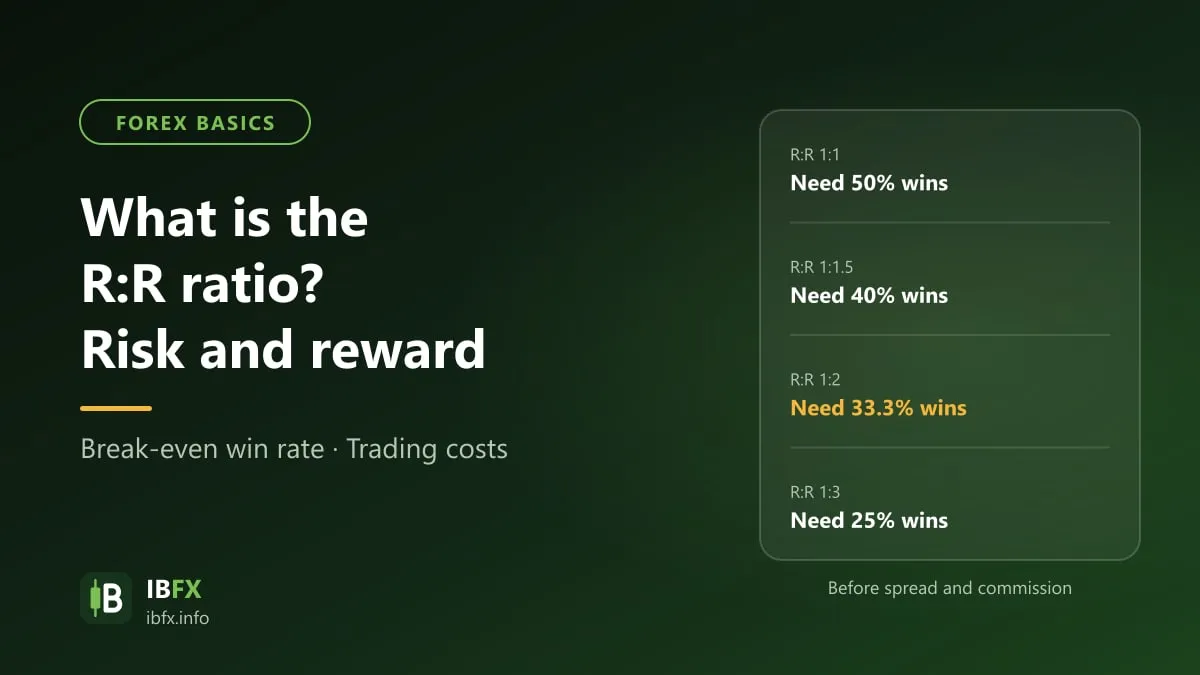
Break-even win rate = 1 ÷ (1 + R)
| R:R | Win rate needed to break even |
|---|---|
| 1:0.5 | 66.7% |
| 1:1 | 50% |
| 1:1.5 | 40% |
| 1:2 | 33.3% |
| 1:3 | 25% |
A high R:R does not mean a better one. The further away the take profit, the less often price reaches it, so the win rate usually falls. What matters is that the actual win rate of the way you trade is higher than the matching break-even level.
To compare different ways of placing a position, use the expectancy per trade measured in R:
Expectancy = win rate × R − loss rate × 1
- A 45% win rate at an R:R of 1:2: 0.45 × 2 − 0.55 × 1 = +0.35R per trade.
- A 30% win rate at an R:R of 1:2: 0.30 × 2 − 0.70 × 1 = −0.10R per trade.
- A 60% win rate at an R:R of 1:0.5: 0.60 × 0.5 − 0.40 × 1 = −0.10R per trade.
See also: Why should you write a forex journal every day?
Expectancy only describes the average over a great many trades, and it only means something when the win rate comes from a full record of real trades, for example in a trading journal. A win rate you estimate by feel is usually higher than the real one.
Trading costs make your real R:R lower
Spread and commission are taken off both winning and losing trades: a losing trade loses more, a winning trade gains less. Suppose the spread and the commission together work out at about 1.2 pips per trade:
| Stop loss 20 pips, take profit 40 pips | Stop loss 5 pips, take profit 10 pips | |
|---|---|---|
| R:R on the chart | 1:2 | 1:2 |
| Real loss when the stop loss is hit | 21.2 pips | 6.2 pips |
| Real gain when the take profit is hit | 38.8 pips | 8.8 pips |
| Real R:R | about 1:1.83 | about 1:1.42 |
| Break-even win rate | 21.2 ÷ 60 ≈ 35.3% | 6.2 ÷ 15 ≈ 41.3% |
The shorter the stop loss, the larger the share the costs take. A position held overnight can also pay swap. So when you scalp with a stop loss of a few pips, work your R:R out after costs.
Using R:R together with position size
R:R tells you the ratio between the gain and the loss, not the amount of money. The amount depends on your position size. The order to work in:
See also: the 2% money management rule
- Pick the percentage you risk per trade, no more than 1–2% of your capital, following the 2% money management rule.
- Place the stop loss by price structure, for example below a support area, then measure the distance in pips.
- Work out the position size: lots = amount at risk ÷ (stop loss in pips × pip value of 1 lot).
- Place the take profit at a sensible price area such as resistance or a previous high, and only then look at whether the R:R makes the trade worth taking. Do not move the take profit further out just to get a nicer ratio.
An example: 1,000 USD of capital, so 1% of risk is 10 USD; buy EUR/USD with a 20 pip stop loss (1 lot is about 10 USD per pip). Lots = 10 ÷ (20 × 10) = 0.05 lots. With a 40 pip take profit the reward is about 20 USD, an R:R of 1:2. The Position size by risk and Pip value tools work these steps out faster.
Be ready for a losing streak. At a win rate of 40%, the probability that 5 trades in a row all lose is 0.6 × 0.6 × 0.6 × 0.6 × 0.6 ≈ 7.8%, and the more trades you take, the easier it is to meet a streak like that. If the risk is measured on your current balance, 10 losing trades in a row at 1% risk each bring the account down about 9.6%; at 2% risk each it falls about 18.3% and needs a gain of about 22.4% to get back to where it was. The Profit and loss percentage tool works this number out quickly.
Common mistakes when using R:R
- Placing the take profit far away to get a nice ratio. A ratio of 1:5 on paper means nothing if price almost never runs that far.
- Widening the stop loss when price moves against you. The real risk is larger than planned, and the R:R you had at entry no longer holds.
- Moving the stop loss to break even too early. The position is easily closed at break even before price runs the right way, which changes both the win rate and the expectancy.
- Looking only at R:R and ignoring the win rate and the costs. All three numbers have to be weighed together.
- Not recording your real R. Closing by hand, closing in parts or slippage make the outcome differ from the original ratio. Record the real R of every trade so that you know whether the way you trade has positive expectancy or not.
See also: Risk management rules in trading you need to know
See also the principles of risk management in trading, and the guide to margin, margin call and stop out.
Summary
- R:R = distance to the stop loss : distance to the take profit. 1:2 means 1 part of risk for 2 parts of reward.
- Break-even win rate = 1 ÷ (1 + R): an R:R of 1:2 needs a win rate above 33.3%, an R:R of 1:1 needs above 50%, before costs.
- Spread and commission make the real R:R lower, especially with a short stop loss.
- R:R does not replace position size: the risk per trade should still stay within 1–2% of your capital.
Trading leveraged forex and CFDs carries a high level of risk; you can lose all of the money you deposited.