On this page
The term sideways is probably one of the familiar terms you often hear or read when you take part in forex trading. And because it is so familiar, when a sideways market is mentioned everyone understands, without needing a long explanation. So if you want to know precisely what a sideways market is, read our article below.
What is a sideways market?
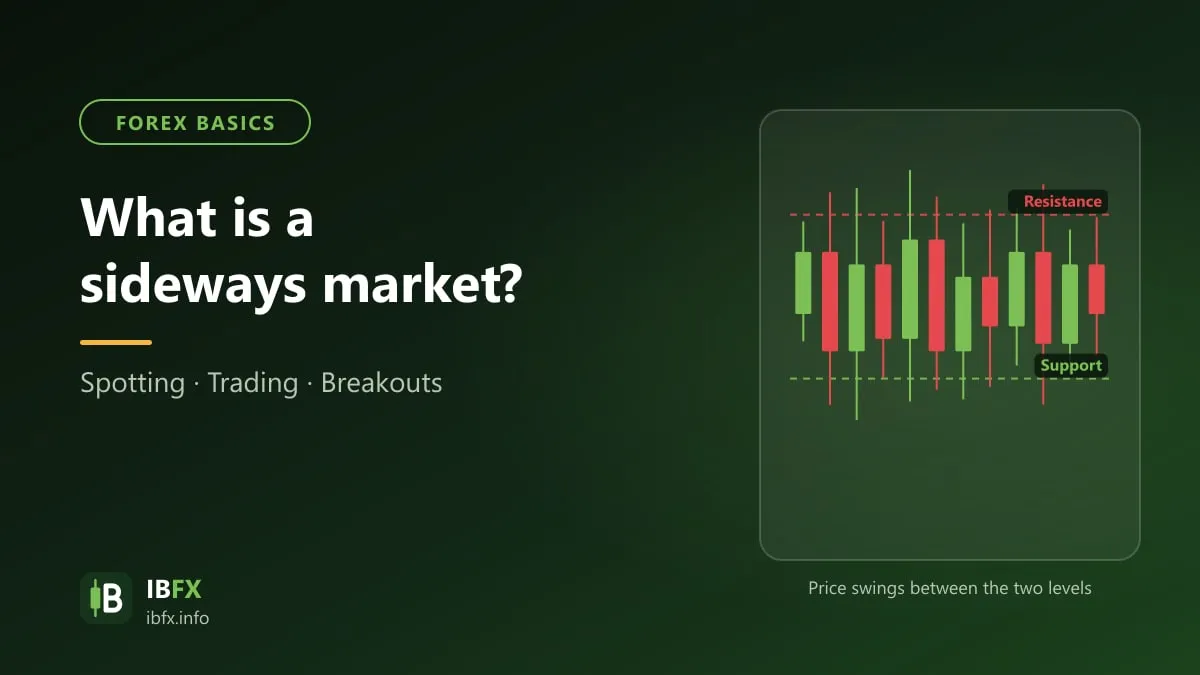
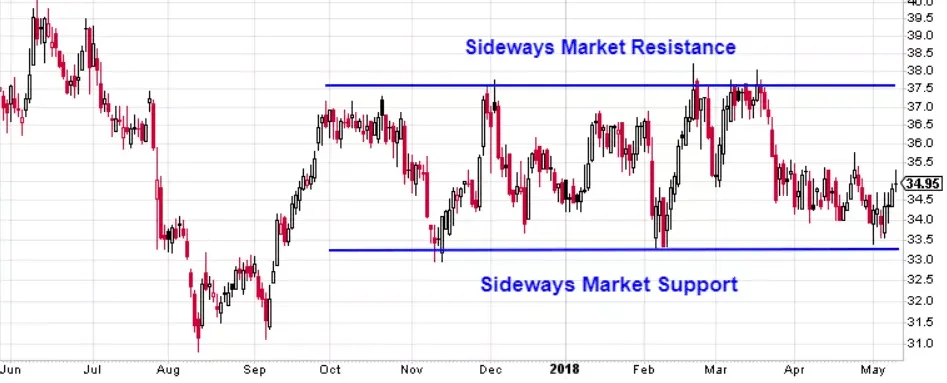
A sideways market (price moving sideways) is a state in which price swings inside a zone bounded by fairly clear resistance and support levels. You find this state in every market: forex, stocks, gold and cryptocurrencies. Unlike an uptrend and a downtrend, in a sideways market buyers and sellers are close to balanced, so price cannot clearly make a higher high or a lower low.
Why does a market move sideways?
In practice, a price trend works the same way people do. It cannot rise forever, or fall forever; the market too has to have periods of rest, so that the buying side and the selling side can go on building up their forces. And so it can settle what the earlier trend was, and whether we should carry on with the old trend or turn it round and make a new one.
And to do that, this sideways stretch is when the buying side and the selling side both “quietly” recruit more troops to throw into the battle; they call a truce for a while, and once they have built up enough they will charge into the fight to become master of the game. And when the 2 sides have enough force to go on “fighting” each other, a trend forms, which may be a continuation of the old trend or a new trend running against the old one.
So a market moves sideways for many reasons, and it also depends on the range price swings in.
A market moving sideways in a narrow range is a time when nobody is buying or selling much, which usually happens near public holidays and the New Year break. In this kind of market the spread is usually wider and price moves little, so the best thing is for us to rest too and wait for some movement before trading.
A market moving sideways in a wider range may be a pause in the middle of a trend (after which price carries on in the old direction), or a period of accumulation or distribution before the trend reverses. There is no way of knowing in advance which way price will break out.
How to identify a sideways market in forex trading
This matters a great deal, because this is the stage where the trend is not clear. Many traders will trade less, because price very easily “turns on its master”, flipping up and down, rising then falling, falling then rising, which can have a trader stopped out again and again and cause heavy damage in their trading.
To identify a sideways market, you first have to find the support and resistance levels. One common way of recognizing it: price has turned at least 4 times (about 2 highs and 2 lows) inside the same zone without yet forming a new higher high (an uptrend) or a new lower low (a downtrend).
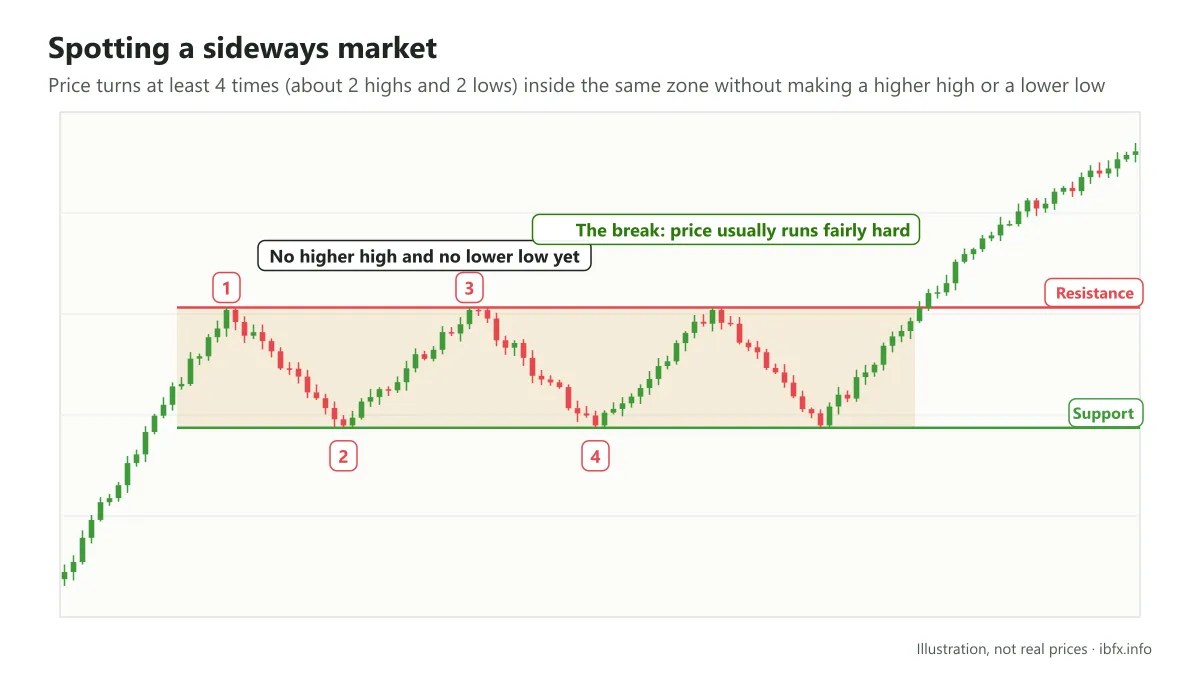
Put simply, price cannot break the old support and resistance levels. After a long time without being broken, those levels become strong barriers; when price does break through, it usually runs quite hard in the direction of the break, which may be a continuation of the old trend or a reversal. Resistance and support levels are seen as strong when price comes back to them several times without being able to break through, usually 3 times or more.
The tools used to recognize a sideways market
The ADX indicator
One way of identifying a sideways market is to use the ADX. Many traders see the market as having no clear trend when the ADX is below 20–25. Remember, the lower the ADX value the weaker the trend; the ADX only measures strength, and does not tell you whether the direction is up or down.
The Bollinger Bands indicator
In substance, the two Bollinger Bands narrow when the market moves little and widen when movement picks up. When the two bands squeeze in like the neck of a bottle, price is swinging in a narrow range and not moving strongly in any direction, so you should trade the trend less. When the two bands start to widen again, movement is picking up and price may be starting a new run, but the direction of that run has to be confirmed by price action.
When does a sideways market end?
If price moves above the resistance level and then forms higher highs and higher lows, the sideways market has ended and is turning into an uptrend. If price falls below the support level and then makes lower lows and lower highs, that is when the sideways market ends and a downtrend begins. Note: a false break (price moves outside the zone and comes straight back) happens very often.
What should you do while a market is moving sideways?
If you are a new trader, it is best not to trade while the market is sideways or the trend is unclear. You should wait patiently for price to break out of the upper or the lower edge of the sideways zone, wait for a candle to close outside the zone as confirmation before you enter, and always place a stop loss in case it is a false break.