On this page
In forex, currencies are always traded in pairs, yet there is one index that does not come in a pair and is still extremely important: it is a measure of value against 6 other foreign currencies. That index is the USD Index. The article that follows introduces you to how to read the USD Index and looks at the place the USD Index holds in forex trading.
What is the USD Index?
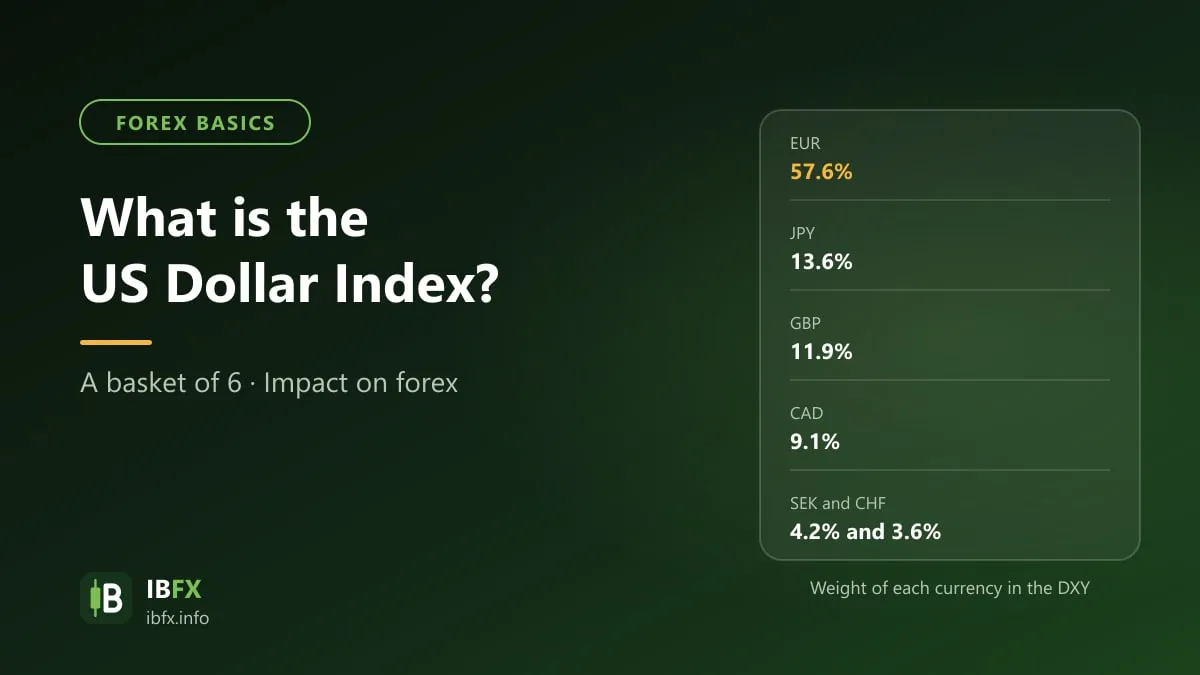
The USD Index is a measure of the value of the dollar against 6 other foreign currencies, a group of leading countries in the world that are major trading partners of the United States, and the rise and fall of each member of the index (the 6 currencies) affects the rise and fall of the USD Index to some degree.
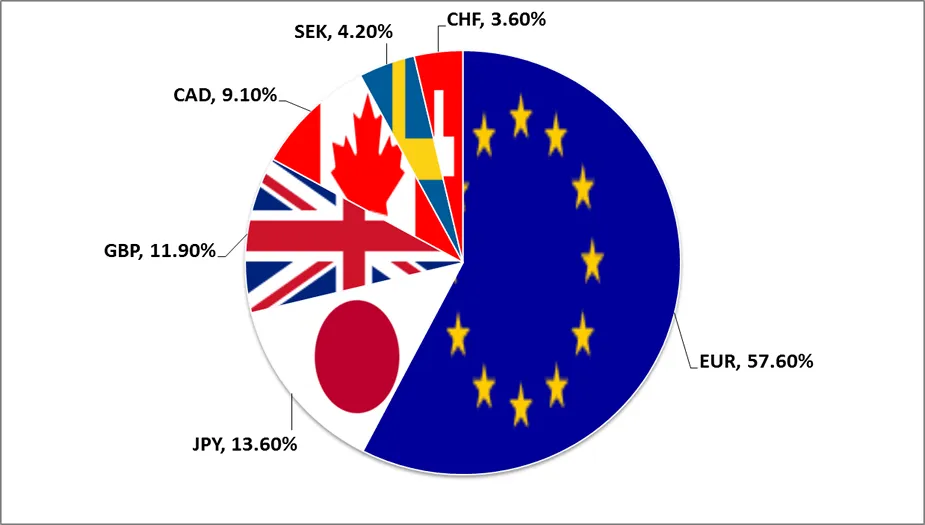
Of the 6 foreign currencies listed above, the value of the USD Index is most heavily influenced by the EURO, at (57.6%). The other five currencies are the Japanese yen JPY (13.6%), the British pound GBP (11.9%), the Canadian dollar CAD (9.1%), the Swedish krona SEK (4.2%) and the Swiss franc CHF (3.6%).
That shows why the USD Index is seen as the index that reflects the “health” of the USD. A rising USD Index means the USD is getting stronger; the other way round, a falling USD Index reflects a USD that is weakening.
In forex trading, on TradingView charts or in the MT4 and MT5 trading platforms, you can find the USD Index under symbols such as DXY or USDX (depending on whether your broker offers it).
The formula for the USD Index
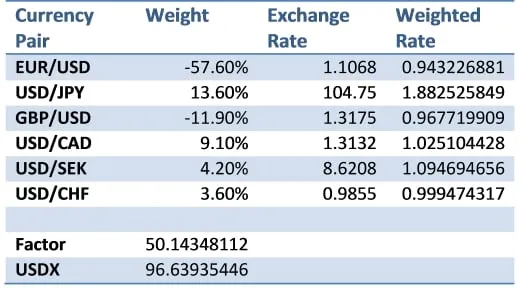
The dollar index is worked out with the following formula:
USDX = 50.14348112 × EURUSD-0.576 × USDJPY0.136 × GBPUSD-0.119 × USDCAD0.091 × USDSEK0.042 × USDCHF0.036
Looking at the formula and the table above, you can see that the value of each currency is multiplied by a weight. The weight is a positive number when the US dollar is the base currency. The weight is a negative number when the US dollar is the quote currency.
Of the 6 currency pairs, only EUR/USD and GBP/USD have the US dollar second, as the quote currency, so those carry a negative weight; the other 4 pairs have the US dollar as the base currency, so they carry a positive weight.
The history of the USD Index
The Federal Reserve, the FED, created the USD Index in 1973 to track the value of the dollar. That came right after President Nixon abandoned the gold standard, letting the value of the dollar float on the foreign exchange market. Before the USD Index was created, the dollar had always been fixed at 35 USD an ounce of gold from 1944, which is also when the Bretton Woods agreement was made.
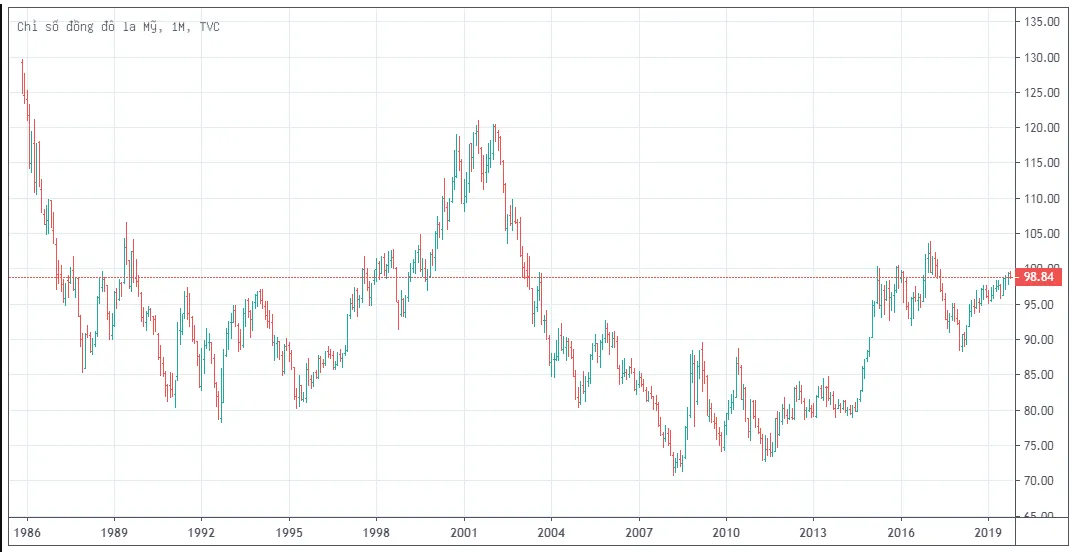
On that basis, the USD Index was marked at the 100 level. And this percentage figure has changed a great deal since its base value was set. The all-time high of the USD Index is about 164 points in early 1985, meaning the USD was about 64% stronger than at the 1973 level.
The all-time low of the USD Index is about 70.7 points in March 2008, about 29% below the 100 level.
Futures on the USD Index began trading in 1985; the index is now run by ICE (Intercontinental Exchange, Inc.). “U.S. Dollar Index” is a registered trademark.
Historical data for the USD Index
The screenshot shows the Vietnamese interface; the buttons and labels sit in the same places in the English version.
Here are some of the levels of the USD Index from 2007 to 2019 (values rounded); the latest figures can be seen on TradingView under the symbol DXY.
2007: The value of the USD Index is 76.70 at the spot price taken on Dec 31.
2008: on the last day of the year the USD Index was 82.15, after falling to around 71 in the middle of March (the all-time low), right after the bank Bear Stearns had to turn to outside help, when the other banks all refused at once to lend Bear Stearns money for fear that Bear Stearns already held too many bad debts tied to subprime real estate. At that moment investors thought this would hit the USD, and they decided to buy the Euro. Right afterwards, to steady the financial market, the FED cut interest rates several times and went on to carry out QE on Nov 25. A quantitative easing program (QE) usually makes the USD weaker; the USD Index rising to around 82 at the end of the year was mainly because the financial crisis spread from the middle of the year and investors pulled money back into the USD as a safe haven.
2009: DXY ended the last session of the year at a price of 77.92. As the market panicked less, the Fed held interest rates near 0% and carried on with QE, so money left the USD and the index fell.
2010: The USD Index had a jump on Jun 4 to 88.26, the highest level of 2010. By the end of the year, though, it had fallen to 78.96, despite the FED launching QE2 (quantitative easing) on Nov 3.
2011: DXY fell to around 73 in early May. However, the crisis in the Euro area brought investors back to the USD with some enthusiasm, particularly right after the FED started “Operation Twist”, worth 400 billion USD, to revive the US economy, which helped DXY close the books at 80.21 on the last day of 2011.
2012: The FED announced QE3 on Sep 13 and QE4 in December. DXY closed at 79.77.
2013: In June the FED announced it would cut the size of its monthly bond-buying program and of its mortgage-backed securities program, which panicked investors into selling bonds. That was what let DXY close the year at a price of 80.04.
2014: The dollar was still steady over the first six months of the year, touching 80.12 on Jul 10. The Ukraine crisis and the Greek debt crisis sent investors to the dollar as a safe haven. The FED announced the end of its monetary easing package (QE) at the end of October. By then the FED’s balance sheet had reached about 4.5 trillion dollars.
After that, the FED announced it would raise its lending rate in 2015. That took the USD Index up 15%, to 91.92 on Dec 29.
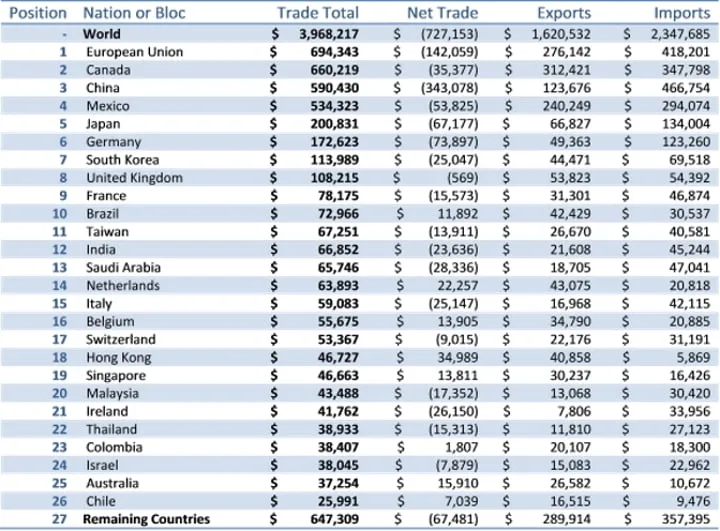
The trading partners of the United States, in order from highest to lowest.
2015: The European Central Bank announced it would start QE in March and the Euro fell to 1.0524 USD on Mar 12. The USD Index reached its highest level, up 25% from 2014, at 100.18 on Mar 16. The FED then raised its base rate from 0-0.25% to 0.25-0.5% on Dec 17. That took the dollar to 98.69 on the last day of 2015.
2016: The FED raised interest rates to 0.50-0.75% in December, and the USD Index went to around 103 at the end of the year, about 28% above July 2014.
2017: The European economy improved and the euro was strengthened. Hedge funds began to “short” (sell) the dollar. The FED decided to raise interest rates on Mar 15. After that, the European Central Bank announced it might end QE on Jul 20 of that year. The dollar ended the year at a price of 92.12.
2018: DXY fell to its lowest level of the year, 88.59, on Feb 15, down 14% from 2016. Investors were no longer keen on the USD as the European economy went on strengthening. But the US economy then showed many signs of improvement, which took the USD Index to its 2018 high of 97.54 on Nov 12 and to a close for the year at 96.17.
2019: The dollar went up to 98.20 on Apr 24. However, it fell to its low for the year, 95.98, on Jun 24. Then, when the FED announced a cut in interest rates to 2.00-2.25% on Jul 31, the USD Index was still around 98.5.
After that period, in 2022, when the Fed raised interest rates very fast to fight inflation, the USD Index went to about 114 at the end of September 2022, the highest level in about 20 years.
Why do investors need to pay attention to the USD Index when trading forex?
The USD Index really is an extremely important index that forex traders should not pass over, for the following reasons:
- Thanks to the growth of the US economy, the USD has become the most traded currency in the world. So moves in the USD have a huge effect on the forex market, and other currencies or commodities such as gold, silver and crude oil move along with it.
- As said before, the USD Index reflects the health of the USD. If the USD Index rises, the USD is getting stronger, and an investor may favor scenarios that buy USD against other currencies; the other way round, if the USD Index falls, the USD is weakening, and an investor is careful with trades that buy USD. The USD Index is only background information about the general trend, not an entry signal.
- One more point: because the USD Index is built out of a basket of 6 foreign currencies, you can use the USD Index as a basis for reading a great many other currencies that contain the USD, and the most notable of these is EURUSD, which takes up more than half the weight at 57.6%, meaning USDX moves in the opposite direction to EUR/USD. So the trend of the USD Index helps you check your read on the pairs that contain USD.