On this page
Beyond the candles with names as poetic as the Evening Star, the Morning Star and the Shooting Star, which show how rich the Japanese imagination was, the Hanging Man candle is probably the most haunting name of the lot. At bottom, it is a fairly common bearish reversal candle.
Standing on its own, the signal from a Hanging Man is usually not as strong as that of many other patterns. Put the Hanging Man candle together with a resistance zone and with indicators such as RSI and MACD, though, and you have more to go on in weighing up the signal.
What is a Hanging Man?
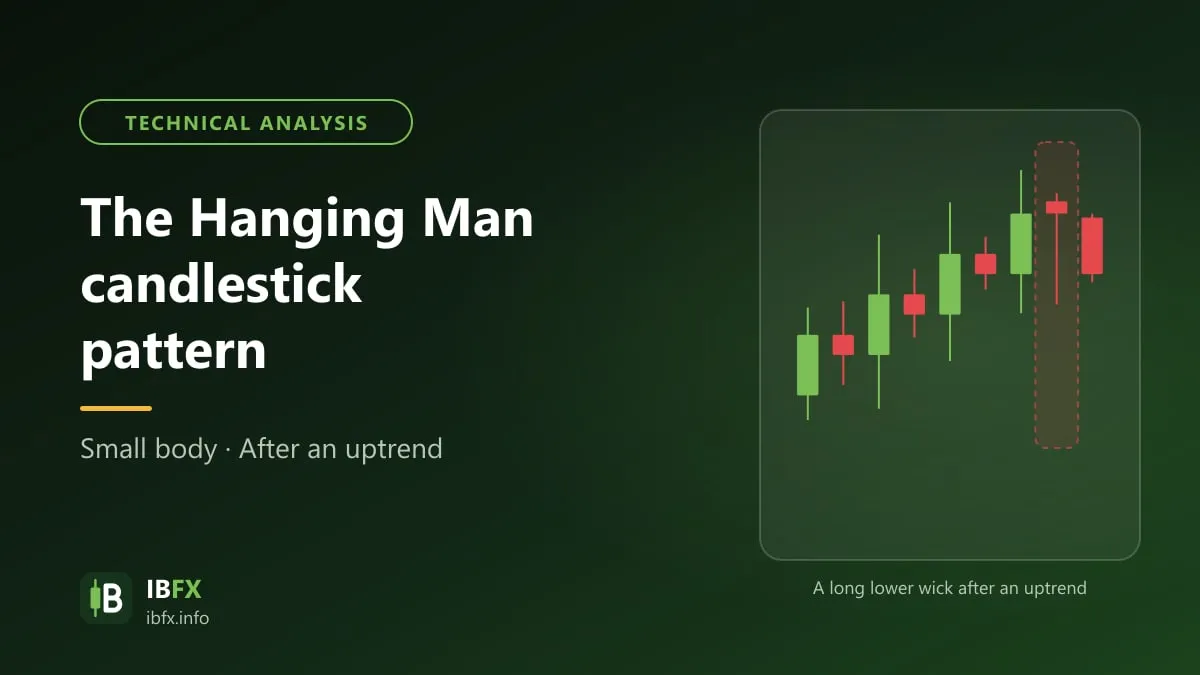
The Hanging Man candle is a candle that looks rather like an umbrella: a small body sitting in the upper part of the candle, an upper wick that is very short or absent, and a very long lower wick like the handle of an umbrella.
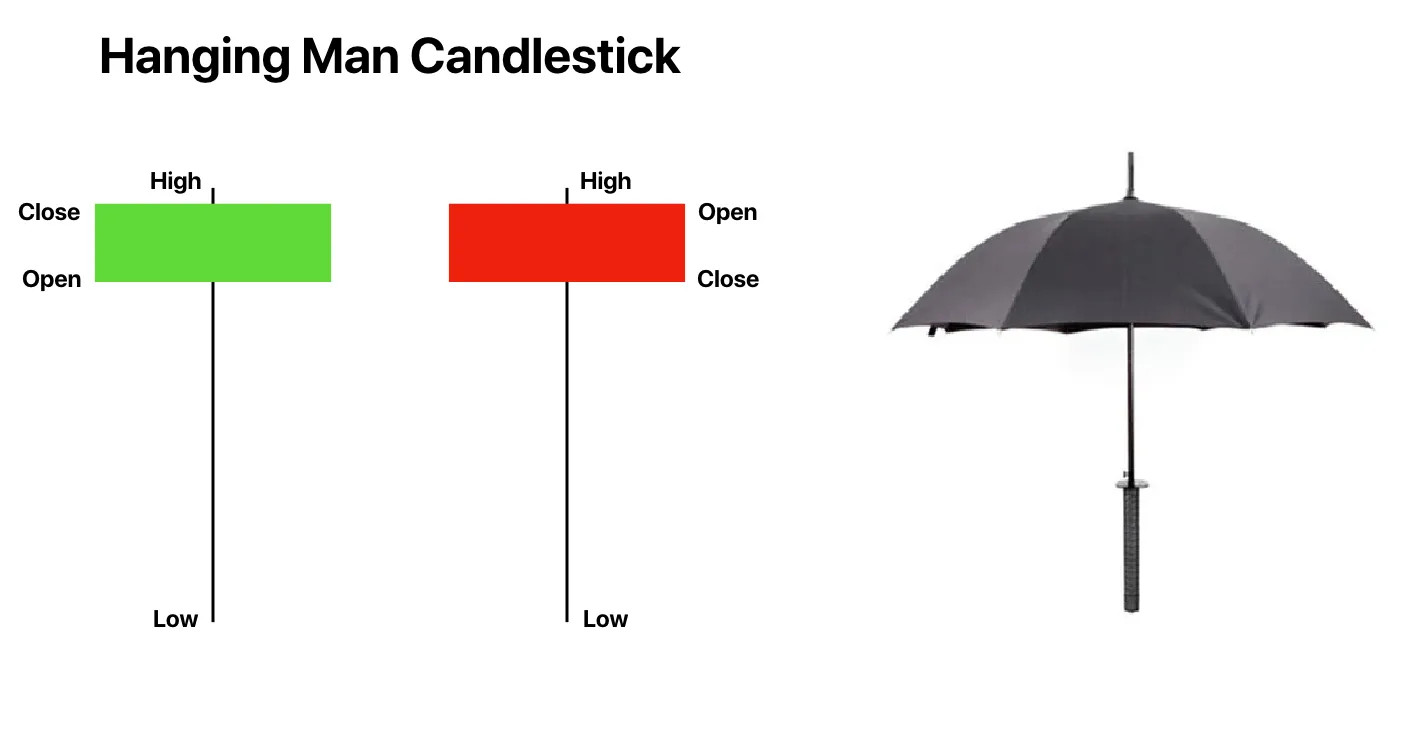
With a name like the hanging man, you can tell this is no happy omen. When this candle appears after a rise in price, near the top of an uptrend, it warns that the rise may be about to end and that price may reverse downward.
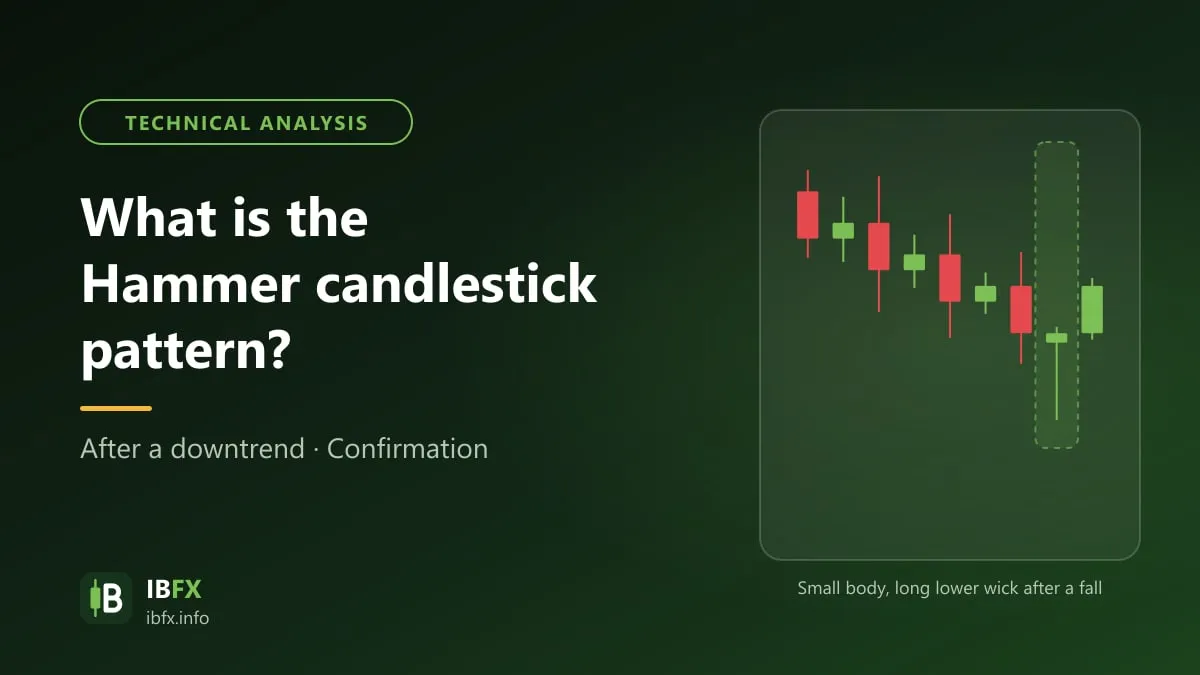
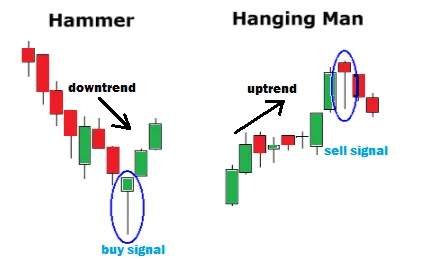
Note carefully: the color of a Hanging Man does not matter much, green or red is fine. What matters most is that you do not confuse this candle with the Hammer, because the two have exactly the same shape. The difference lies in where they appear: the Hanging Man appears after a rise in price (near a top), while the Hammer appears after a fall in price (near a bottom).
What marks out the Hanging Man candle
Where it appears: after a clear rise in price, near the top of an uptrend or of a stretch of rising price.
Length and size of the candle: a small body, a short upper wick or hardly any at all, and a lower wick at least twice the body, clearer still at 3 times.
Color of the candle: it does not matter much. According to Steve Nison, a Hanging Man with a red body (a bearish candle) gives a clearer bearish signal than one with a green body (a bullish candle).
What it warns of: a possible downward reversal, and it needs a confirming candle.
The market psychology as a Hanging Man forms
The Hanging Man appears inside an uptrend, while buyers are in control of the market. During this session, though, selling drove price quite far below the open. Even though buyers pulled price back up near the open by the end of the session (which is what makes the long lower wick), the fact that price was sold off hard in the middle of an uptrend shows that selling has begun to show up and that buying is showing signs of weakening.
Buyers still managed to hold their ground, though, so a Hanging Man by itself is not enough to conclude anything. You need to wait for a confirming signal: the next candle closes below the body of the Hanging Man candle.
Do note this: a candle of this shape turns up in a great many places on the chart. As said above, the reversal signal it gives is fairly weak, so it is only worth paying attention to when it sits near the top of an uptrend, ideally at a resistance zone.
As in the picture comparing the Hanging Man with the Hammer in the section above, a candle shaped like a Hanging Man but sitting inside a downtrend (where it is called a Hammer) is not a signal to Sell. If you still try to Sell on the strength of that candle, you can easily end up with a loss.
A strategy for trading the Hanging Man candle
Before you look for an entry, you need to analyze several timeframes: start with the large ones such as the daily (D1) or the weekly (W1) to see the long-term trend of the market, then look at smaller ones such as H4 or H1 to find an entry.
Step 1: Establish the long-term trend
Look at the chart on the large timeframes such as D1 or W1 to work out the long-term trend and the important resistance zones.
The Hanging Man is a reversal signal, so trading it means going against the rise in price that came before. The signal is more reliable when: the uptrend has been running for a long time and is showing signs of weakening, price is at a resistance zone of the higher timeframe, or the Hanging Man appears at the top of a rally inside a downtrend on the higher timeframe. For a new trader, the last of those is the one to prefer, that is, trading with the main trend, because going against the main trend is very hard to keep under control.
Step 2: Find an entry
Use shorter timeframes such as H1 or H4 to work out where to enter.
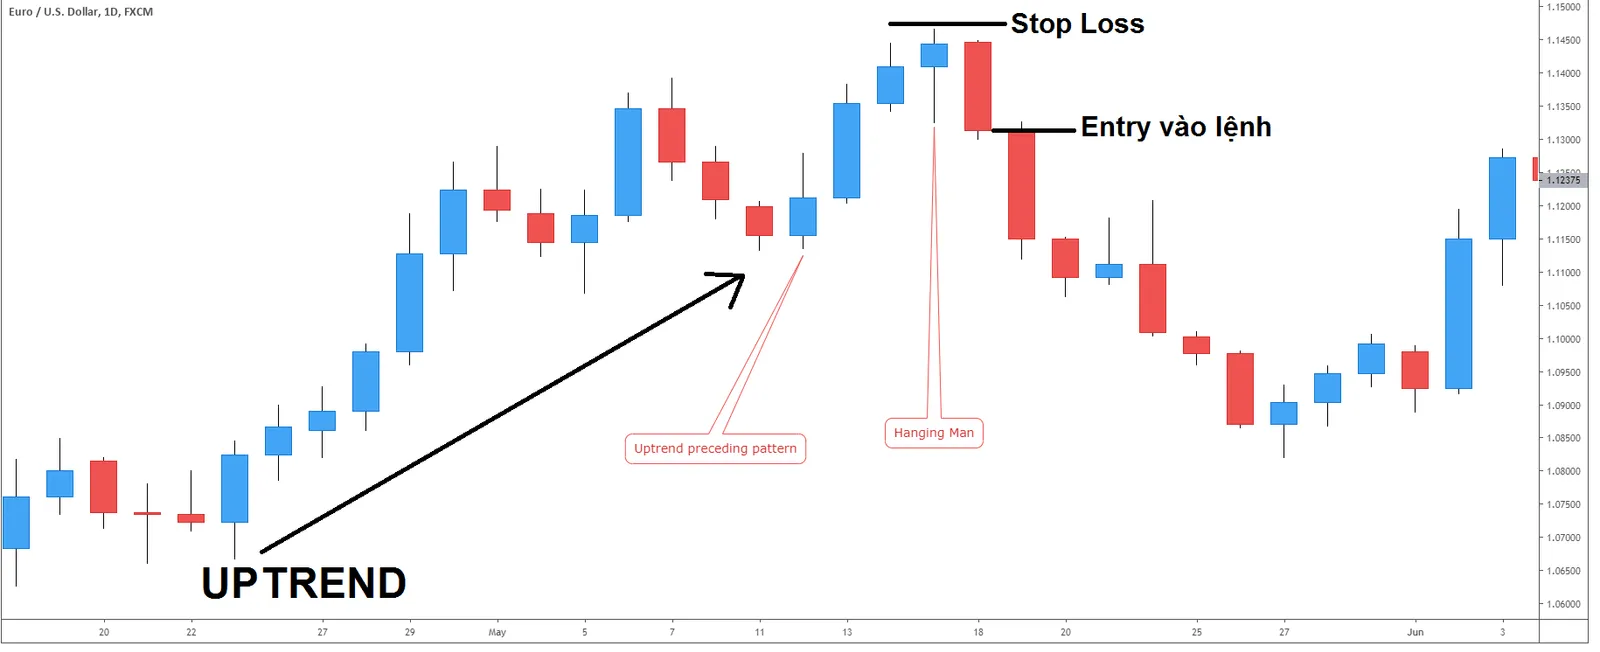
The screenshot shows the Vietnamese-language interface; the buttons and labels sit in the same places in the English one.
Entry: after the confirming candle. Once the Hanging Man has formed, wait for the next candle to close below the body of the Hanging Man (a bearish candle), and only then enter a Sell; by that point the reversal signal is clearer.
Stop loss: above the high of the Hanging Man candle (which is also the top of the rise), by enough of a distance to stay out of the noise.
Step 3: Add supporting indicators
If you use nothing but the Hanging Man, you can very easily run into a false signal. It is better to add other indicators such as RSI in the overbought area (above 70), or a bearish divergence signal on MACD.
Step 4: Place the trade
Once the steps above are met, you place the Sell order with the stop loss a small distance above the highest wick.
Step 5: Manage the risk
However sure a signal may look, the risk of a loss is always there, so never “all in”. Work out your position size from the stop loss distance, so that if the trade loses you only lose a small part of the account.
Step 6: When should you close the trade?
Before you enter, you should pick a target such that the risk/reward ratio (R:R) is at least about 1:2, for example setting the target at the nearest support zone below. See also: The 2% money management rule.
Once price has moved some way in your favor, you can take part of the profit, move the stop loss back to the entry or use a trailing stop on the rest. That way, if price turns around, you still do not end up with a loss. What matters most is that you stick to the plan you set out and do not let your emotions take over.
An example of the Hanging Man candlestick pattern in forex trading
A typical situation: after a sharp rise in price, one Hanging Man candle appears and right after it comes a strongly bearish candle. That second candle is the signal confirming a downward reversal, showing that buyers have weakened and are not strong enough to stand against the selling.
At the Hanging Man candle, buyers were still holding their ground, which is why the lower wick is long; but at the red candle right after it, buyers failed and price started to fall.
You can enter a Sell when the confirming candle closes, with the stop loss a small distance above the high of the Hanging Man candle so that it is not swept. Take profit by the plan you set out beforehand, and there is no need to regret it if price keeps going after you have closed the trade.