On this page
RSI is simple enough in structure, just one line winding up and down, but it is one of the momentum indicators most used by traders today. If you are not yet clear on what RSI is or on how to trade with RSI, read on.
What is RSI?
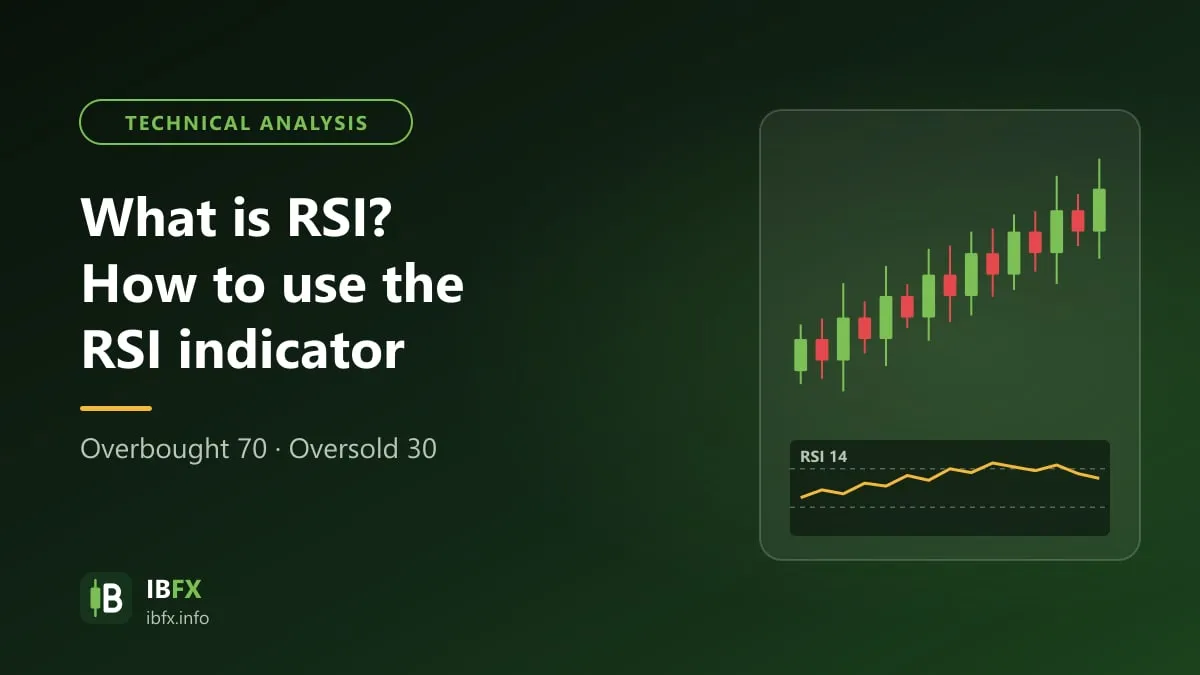
The Relative Strength Index (RSI for short) is a momentum indicator that measures the size of recent price changes in order to judge overbought or oversold conditions for stocks, forex or other assets. RSI is shown as an oscillator (a graph that moves between two extremes) with values from 0 to 100
Keep in mind that RSI also belongs to the momentum family, and in the article introducing the Stochastic Oscillator we already said a few words about the single most important building block of this family of indicators, whatever formula the people who created them used, namely: MOMENTUM.
Who created RSI?
RSI was developed by J. Welles Wilder Jr. and introduced in the book New Concepts in Technical Trading Systems, published in 1978.
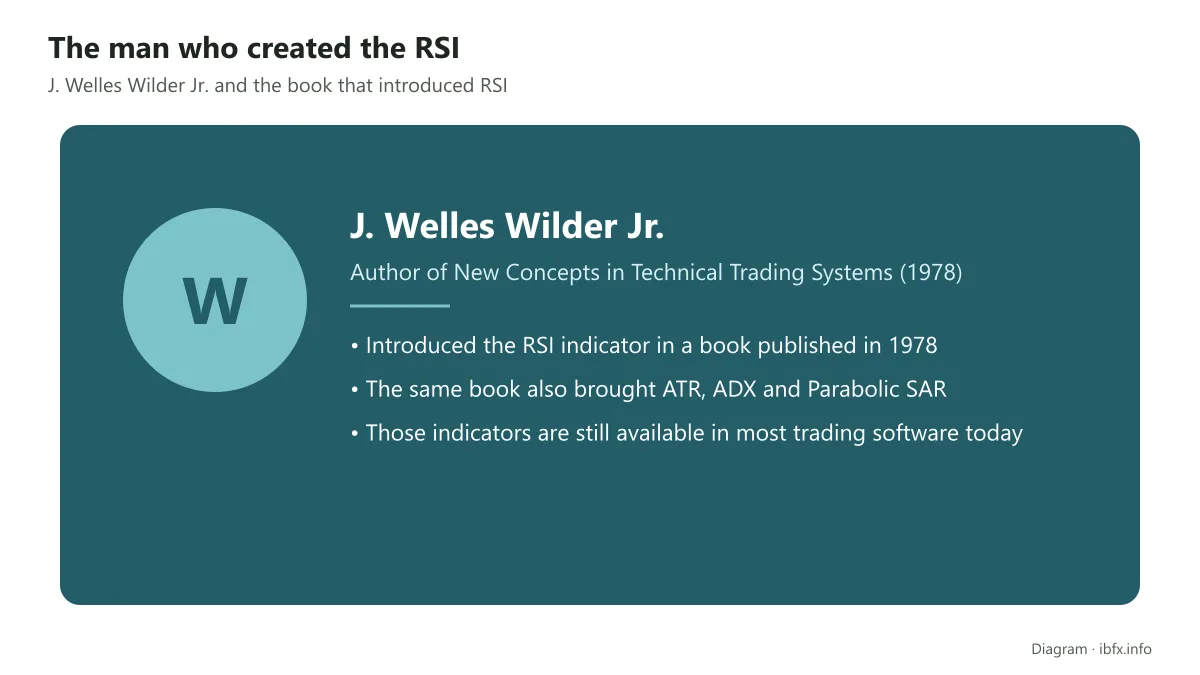
The book quickly became a classic of technical analysis, and many of the indicators introduced in it (RSI, ATR, ADX, Parabolic SAR) are still available in most trading software today.
As far as we know, the book mainly exists in English. It is not a thick book, and if you already have some trading experience it is not too hard to read Wilder’s conclusions about how RSI works in the original.
What signals does RSI give a trader?
RSI has 2 main parts: one winding line based on a formula that measures how much price has moved, and 2 boundary lines set by default at 30 and 70.
Because it belongs to the momentum family, RSI mainly gives information about: OVERBOUGHT and OVERSOLD conditions.
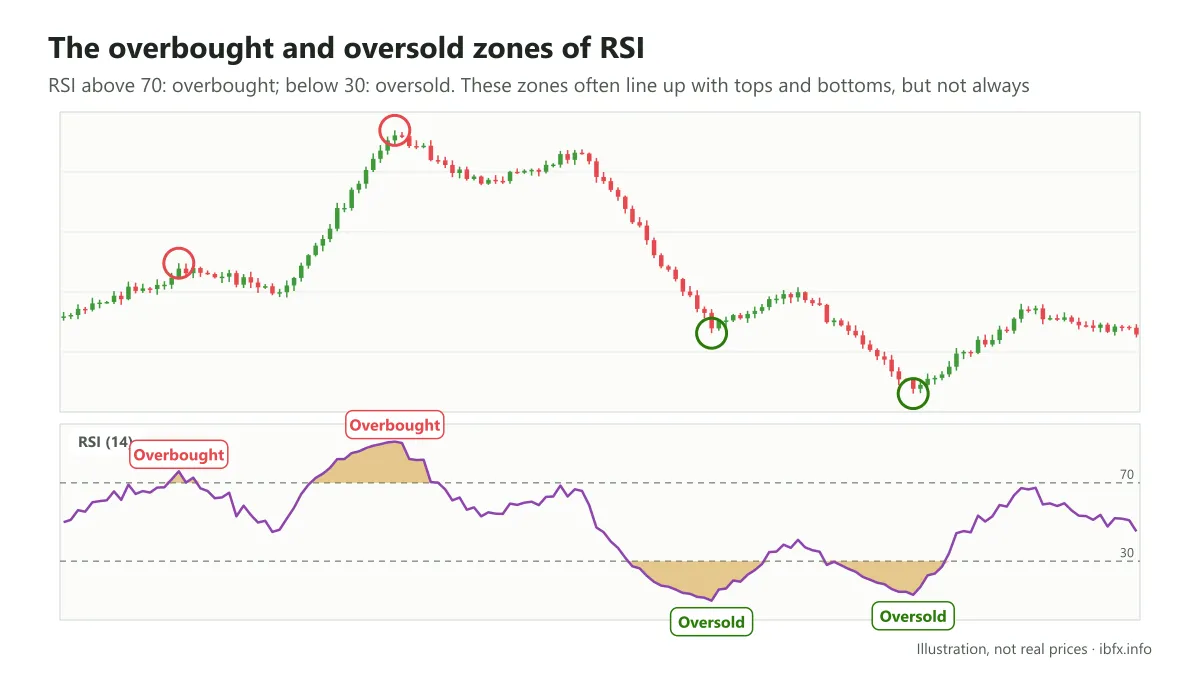
That information about overbought and oversold sits at those 2 boundary lines, but as mentioned, each indicator has a different formula. Where the Stochastic Oscillator gives an overbought or oversold signal when the indicator rises above 80 or falls below 20, with RSI it is when the RSI line rises above 70 or falls below 30.
The 30 and 70 levels are the 2 traditional ones; in practice they can be changed, and many traders prefer to set the boundaries at 20 and 80 rather than 30 and 70. One common way to trade is to work from these overbought and oversold zones, but remember that in a strong trend RSI can sit in the overbought or oversold zone for a very long time.
Still on the idea of overbought and oversold, in his book Wilder added one more RSI technique, called the Failure Swing. He stressed that when a Failure Swing appears above the 70 boundary, also called a Top Swing Failure, or below the 30 boundary, a Bottom Swing Failure, it is a reversal signal you can trade on.
We cover the Failure Swing in detail in the next part, where we go through the ways of trading with RSI.
Besides the Failure Swing, the RSI indicator also gives some further information:
- In an uptrend RSI tends to stay in the 40-90 range, with the 40-50 area acting as support.
- In a downtrend RSI tends to stay between 10 and 60, with the 50-60 area acting as resistance.
These ranges vary depending on the RSI settings and on how strong the underlying market trend is.
How to set up RSI on MT4 and TradingView
Now that you have the basic idea of the RSI tool, the next step is to set it up on the chart in MT4.
The steps to set up the RSI indicator are as follows:
Step 1: open MT4
Open a chart of any instrument
Step 2: Go to Insert -> Indicators -> Oscillators -> Relative Strength Index
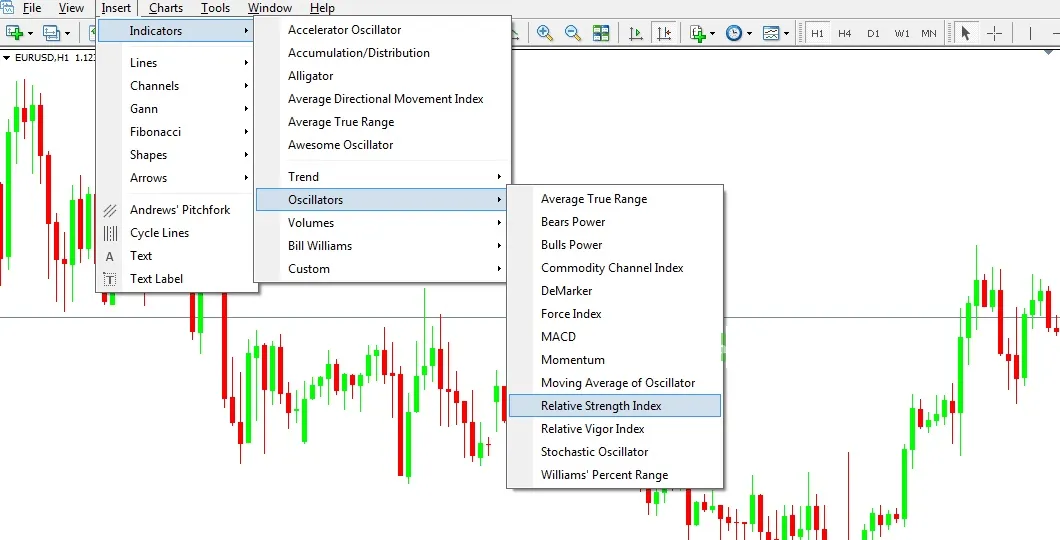
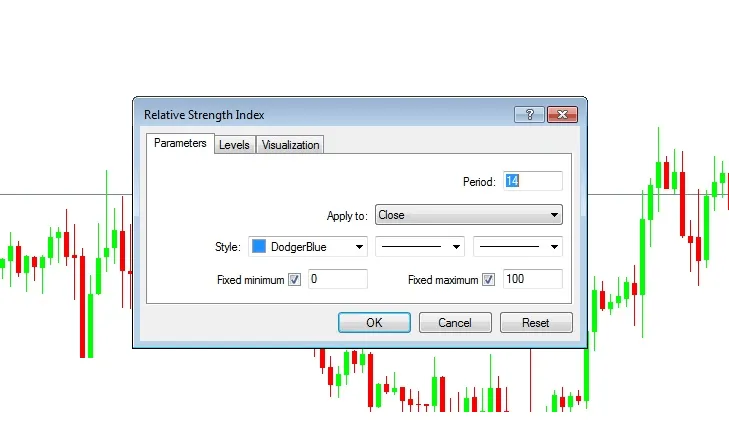
A window with the settings of the RSI tool then appears, as follows:
The Parameters tab: this shows the basic parts of the RSI tool.
As follows:
+ Period 14 – RSI is worked out from 14 candles, and you can change the number of candles it is worked out from as you like.
+ Apply to: “Close” means RSI is worked out from the closing price of those 14 candles. You can also choose to work it out from the opening price (Open), the high of the session (High) or the low of the session (Low), as you like.
+ Style: here you can choose the color and the line style of RSI.
+ Fixed Minimum and Fixed Maximum: the 2 boundaries of the RSI indicator, with the lower boundary at 0 and the upper boundary at 100.
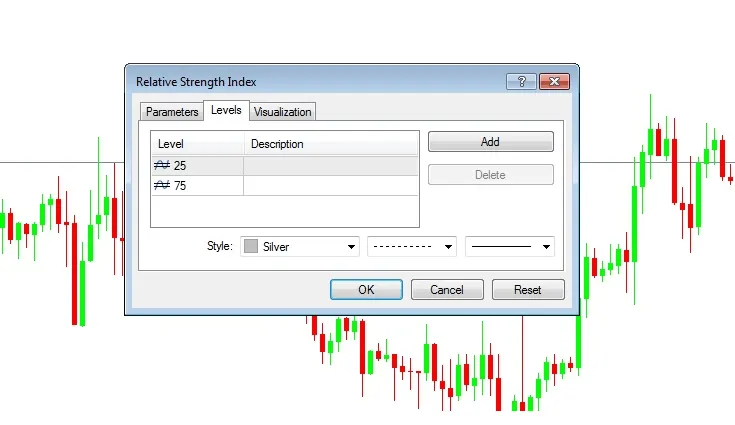
The Levels tab: this shows the levels of the overbought and oversold zones; you can change the values of these 2 levels as you like, and the common default is 30 and 70.
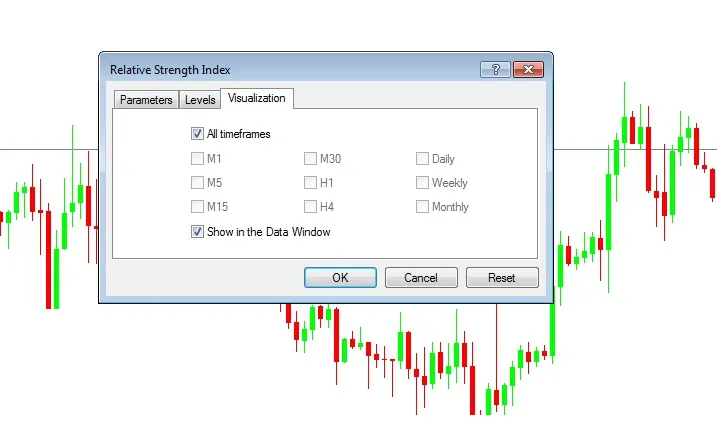
The Visualization tab: the last tab is an easy one, the part where you choose which timeframes the RSI indicator is worked out on and whether it shows in the window.
The advice here is to tick the timeframe you actually trade on, so that nothing distracts you while you trade.
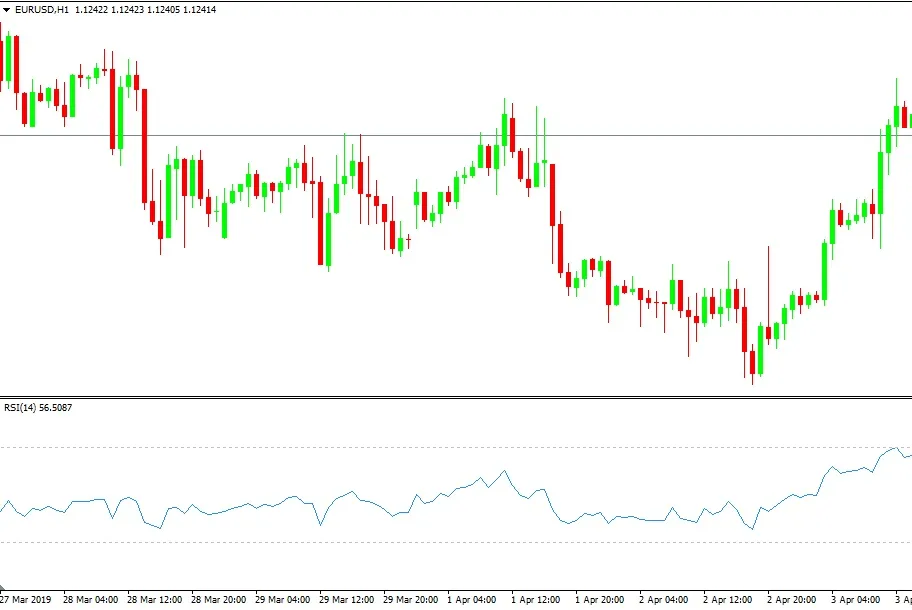
Then click OK, and you finally have the RSI indicator shown on the MT4 screen, as in the picture below.
How to use the RSI indicator sensibly
The RSI formula:
RSI = 100 – 100 / (1 + RS)
RS = Average gain / Average loss of the closing price over N sessions (N = 14 by default)
According to Wilder, this formula measures the relative strength between the up sessions and the down sessions: when the up sessions dominate, RSI moves toward 100; when the down sessions dominate, RSI moves toward 0. You do not have to work it out yourself, as the software already does it.
Besides the boundaries mentioned above, another thing to watch is the period of 14 (14 days, 14 weeks and so on), the period Wilder suggested. These days, though, many traders use 2 different periods at once, such as 5 and 7, 9 and 14, or 21 and 28.
One thing to note is that the shorter the period, 5 and 7 for example, the more sensitive the oscillator and the more easily it reaches the overbought and oversold zones.
So shortening the period makes it touch the upper and the lower boundary more often, and the swings are larger, so the information can be noisier and never as “smooth” as with longer periods. Look at the comparison of RSI period 7 and RSI period 14 below to see it more clearly:
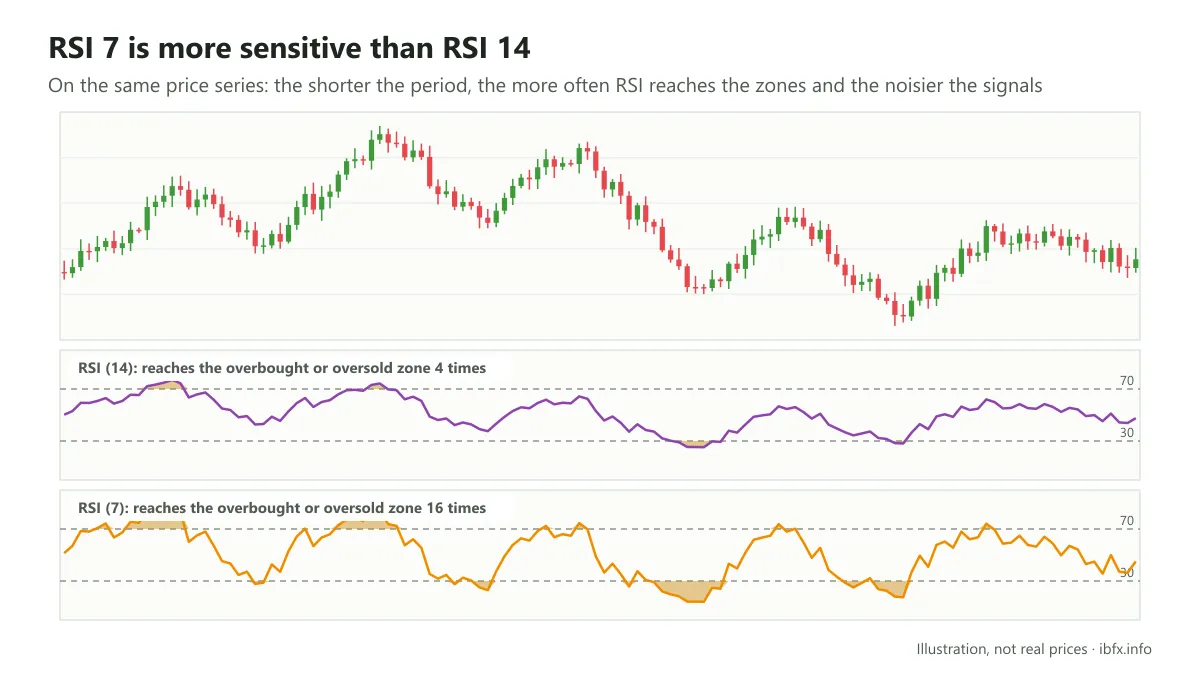
You can clearly see that RSI 7 touches the upper and the lower boundary more often than RSI 14, so for short-term trades RSI 7 suits better than RSI 14.
That is why, if you are a new trader, you can use the default period of 14, but once you have plenty of experience you can adjust the period to fit your own trading strategy.
How to trade with RSI
So, in essence, RSI mainly gives a trader signals about momentum, overbought and oversold. RSI is a useful tool but it still gives wrong signals often, so you should combine RSI with other tools to confirm it and to cut down the noisy signals. Note that you should pick tools that measure different things (trend, price zones, candlestick patterns); using several indicators of the same kind only repeats the same signal. Here are a few typical combinations:
Using RSI as a divergence or convergence signal
This is one of the key points most used by traders. Divergence comes in 2 main types, regular divergence and hidden divergence. Put simply, divergence happens when price and RSI move in 2 opposite directions, like 2 cars driving the other way.
For example, price makes a higher high but RSI makes a lower high, or price makes a lower low but RSI makes a higher low. Both regular divergence and hidden divergence are a mismatch between price and the RSI indicator.
So, to keep things simple, a new trader can just watch for the direction of price and the direction of RSI running the opposite way, as in the picture below; there is no need yet to go into detail or to tell regular divergence apart from hidden divergence.
Case 1: Divergence
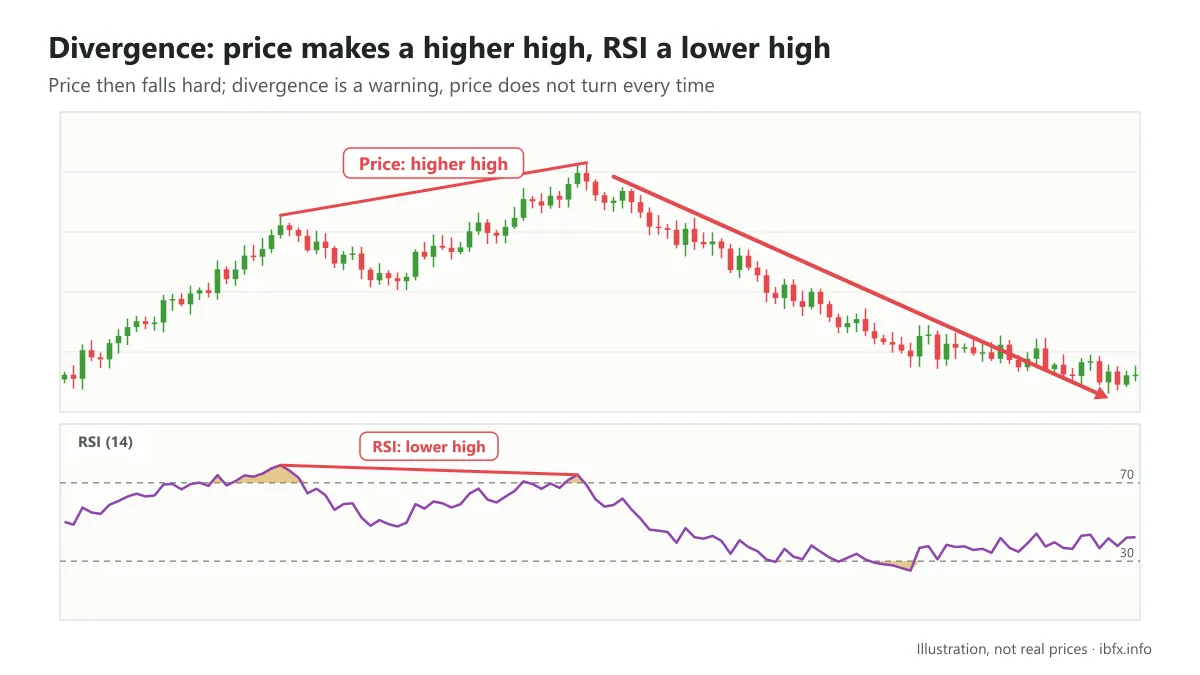
Looking at the example above, you can see that price made a new higher high, but RSI was out of step and made a lower high, and price then fell quite hard.
Case 2: Convergence
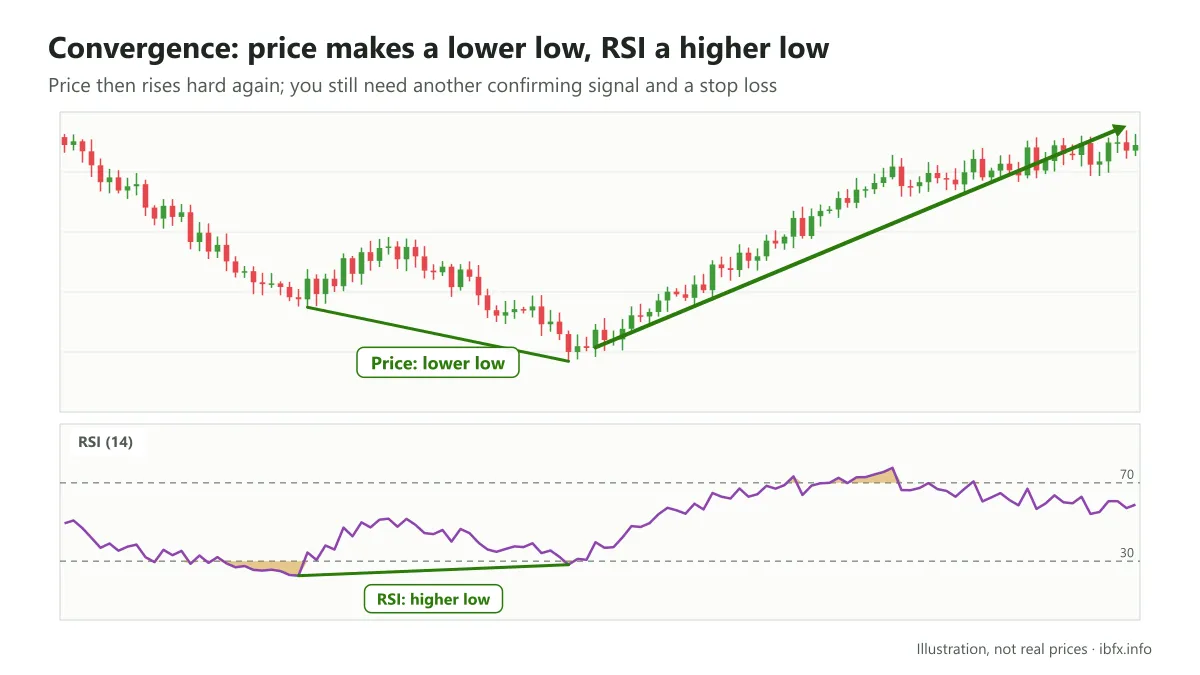
In the same way, price made a lower low but RSI made a higher low, and as you can see in the example above, price then rose hard again.
What divergence means
Divergence shows that the side that is winning no longer has enough force to push price as far as before, even though price still manages a higher high or a lower low. Keep in mind that BEARISH DIVERGENCE DOES NOT ALWAYS MEAN PRICE WILL FALL and that CONVERGENCE (BULLISH DIVERGENCE) DOES NOT ALWAYS MEAN PRICE WILL RISE.
First of all, divergence is a warning: this is not the moment to chase the trend with a buy (or a sell), but it is not yet the moment to rush into a trade against the trend either. If you want to trade divergence, wait for further confirming conditions (much like Wilder’s Failure Swing), as follows:
If RSI falls into an oversold state:
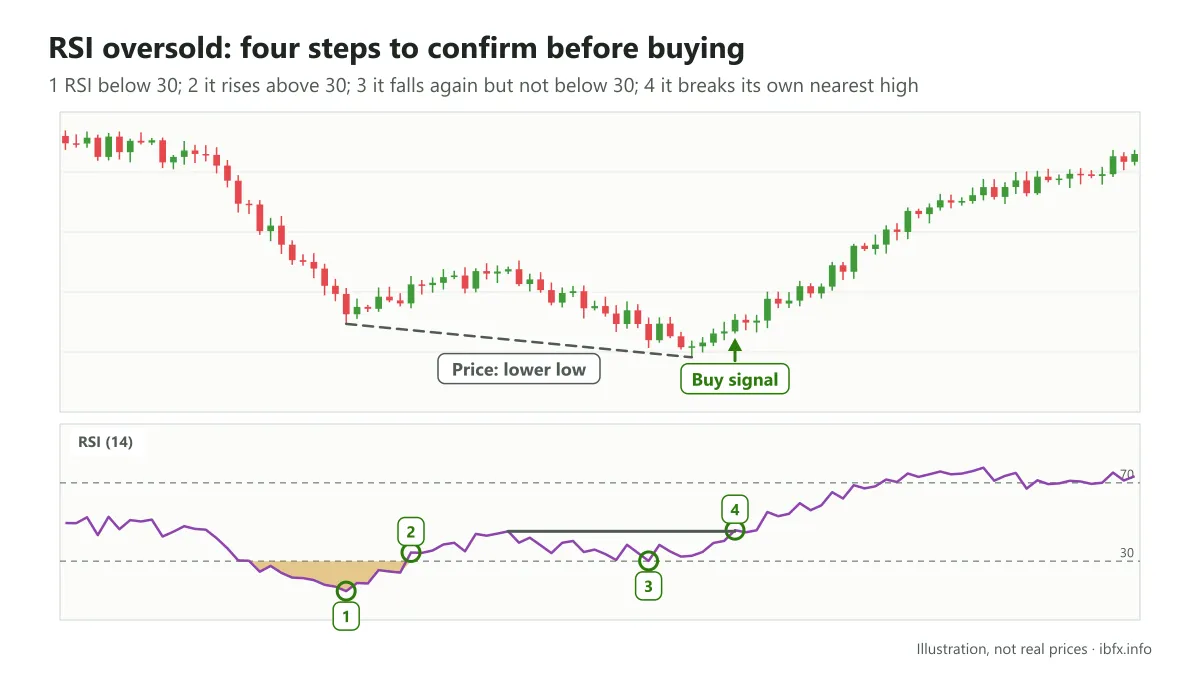
- RSI falls into an oversold state (below 30).
- RSI then rises, shooting up above the 30 boundary.
- RSI forms another leg down without going back into the oversold zone.
- RSI then breaks its own nearest high and moves up.
If RSI runs into an overbought state:
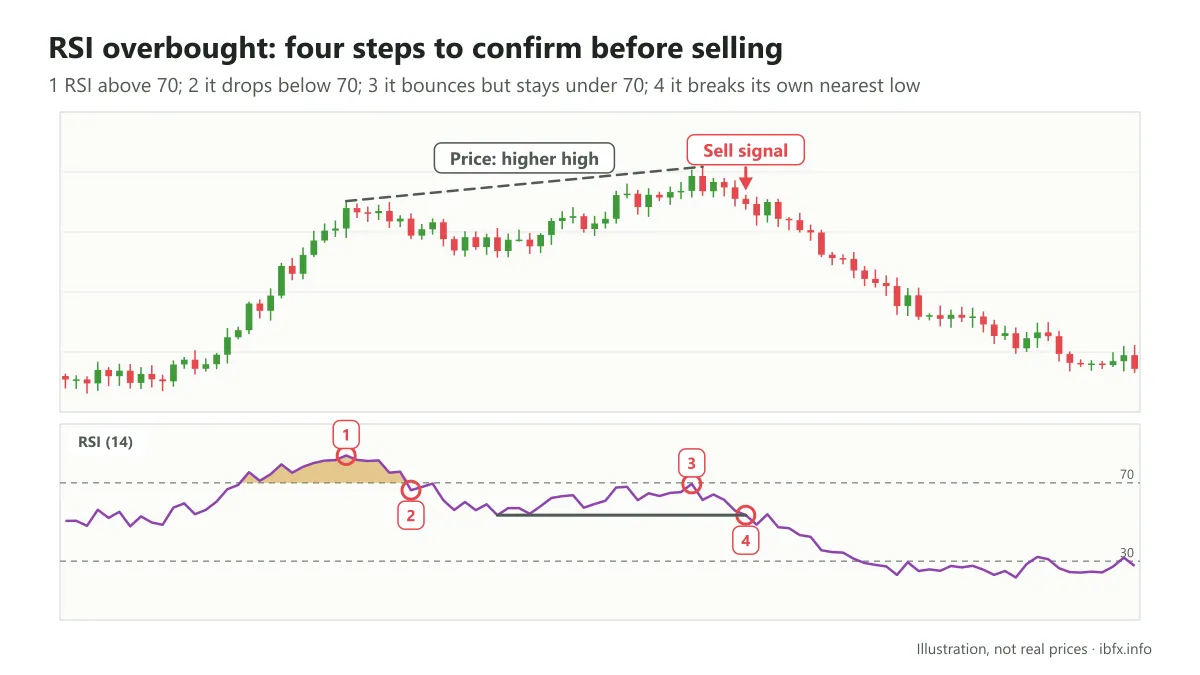
- RSI moves into the overbought zone.
- RSI drops and sits below the 70 boundary.
- RSI rises again to form another high but cannot get back above the overbought zone
- RSI then breaks the nearest low below it and drops.
So you need to combine several other factors and always place a stop loss, because divergence can still fail.
Combining RSI with reversal candlestick patterns
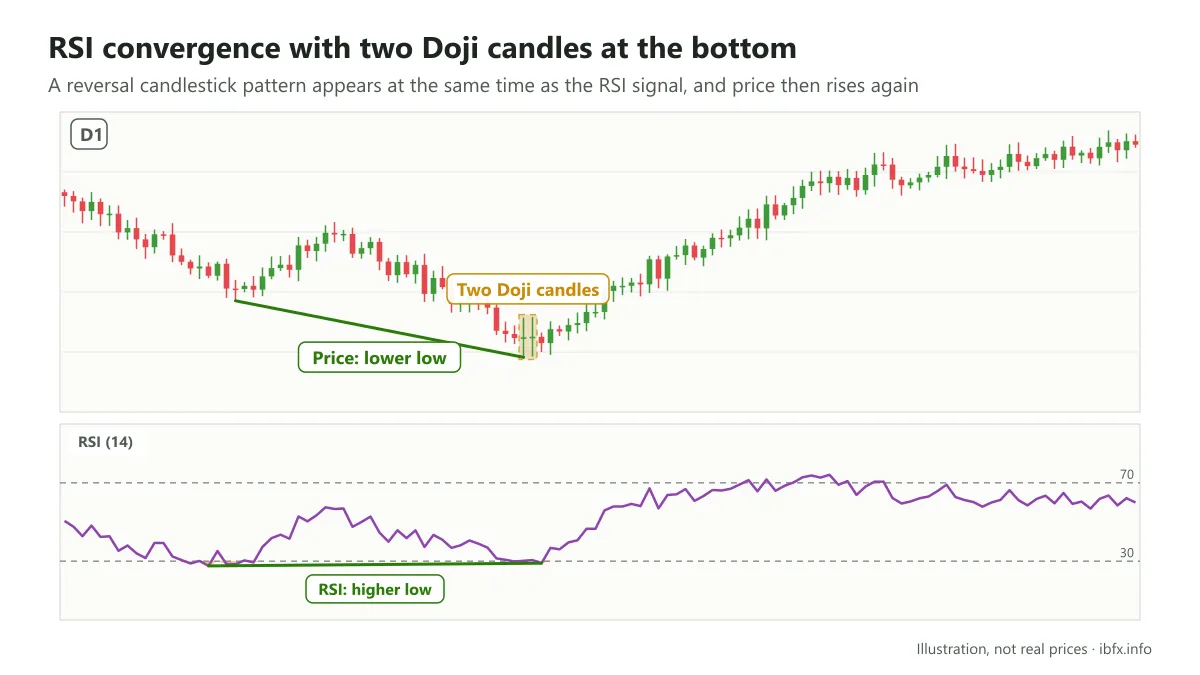
Look at the example above: on the D timeframe, besides the RSI convergence signal, 2 Doji candles also appeared, and price then reversed and rose again.
A reversal candlestick pattern shows how price actually reacted, so when it appears at the same time as a signal from an oscillator such as RSI, Stochastic or MACD, the signal is usually more reliable. Keep an eye out for these signs when you trade.
Combining RSI with MACD
MACD is a momentum indicator based on moving averages, and it is used a little differently from RSI.
MACD shows the relationship between two moving averages of price: the MACD line is the difference between the 12-period EMA and the 26-period EMA, while the signal line is the 9-period EMA of the MACD line itself, used to produce buy and sell signals.
RSI, meanwhile, is worked out from the average gain and the average loss of the closing price over a set period of time (14 periods by default) and moves between 0 and 100.
If MACD measures momentum from the gap between the 2 EMA lines, RSI measures the relative strength between the up sessions and the down sessions.
That is why combining these 2 measures gives traders a more complete picture of the market.
Although both of them signal a coming change of trend by showing divergence from price, in a great many cases MACD and RSI do not point the same way, meaning RSI may say price has diverged while MACD gives no signal at all.
For that reason, if you combine both indicators to look for divergence (which is also the simplest approach), you can wait for both of them to give the same signal, then wait for price to confirm it as well (for example by breaking the nearest high or low) before you enter. Look at the example below to see it more clearly.
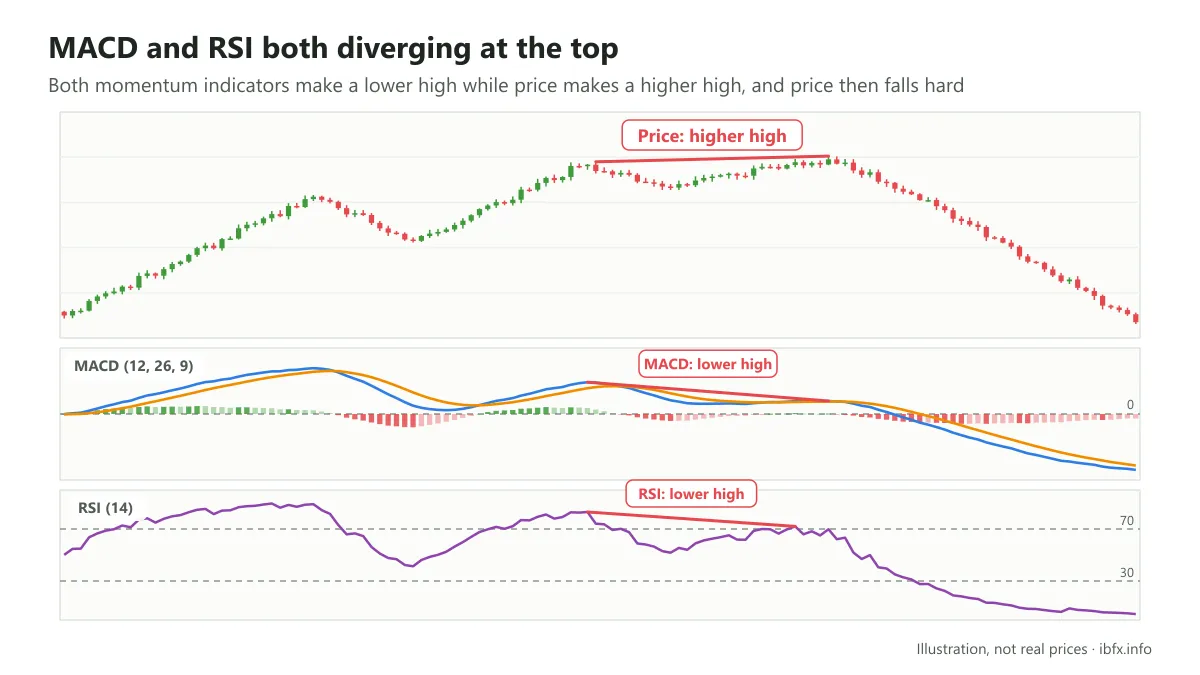
You can see that when RSI and MACD both gave the same signal, price, after making a higher high, met buyers who no longer had the strength to push it any higher, a clear sign of cooling off.
As mentioned, combining these 2 indicators calls for agreement on the trend; when RSI and MACD each go their own way and do not point together, you need to bring in other factors, for example using the EMA lines to work out the trend.
For how to use the EMA line to work out the trend, you can read more here:
Using RSI as a trendline, support and resistance
This is one of the methods I find quite effective, because RSI is in essence just a band that moves with price, so it also forms its own highs and lows.
From those highs and lows a trader can use RSI itself to draw a trend, as in the example below:
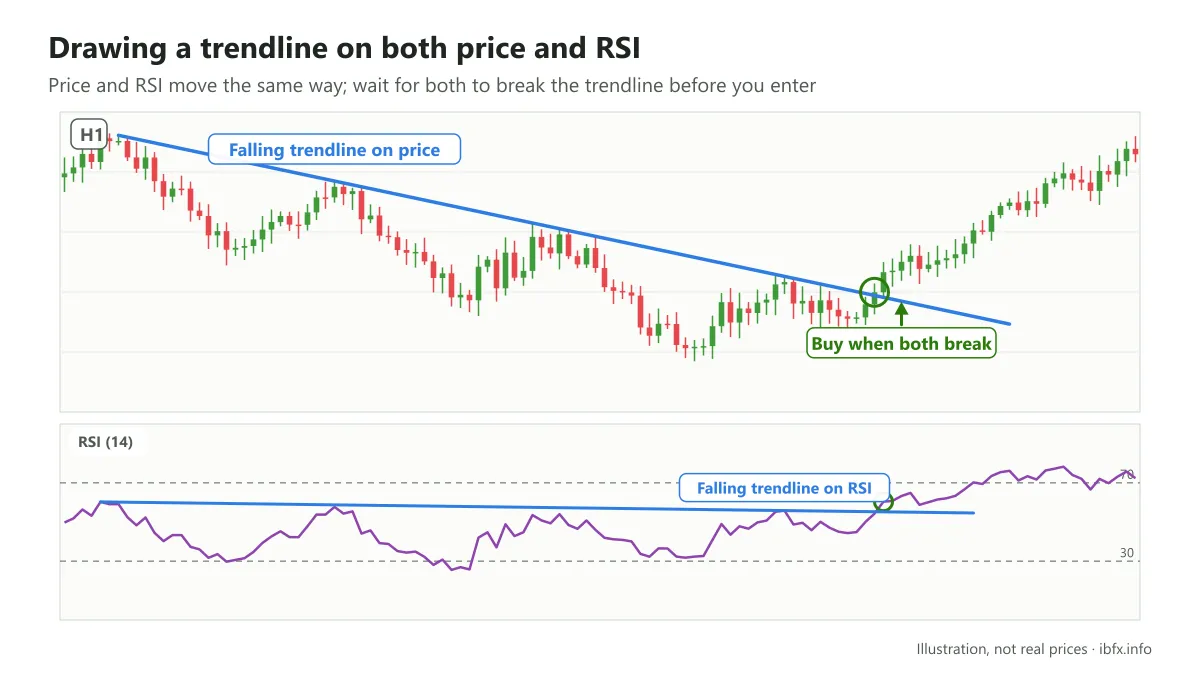
As you can see, price and RSI move the same way, so once you have drawn trendlines on price and on RSI you can wait for price to break both of them at the same time before you enter.
On top of that, because RSI picks up price moves especially at times when the trend is clear, RSI polarizes easily, that is, it runs to the upper boundary (overbought) or the lower boundary (oversold). As mentioned above.
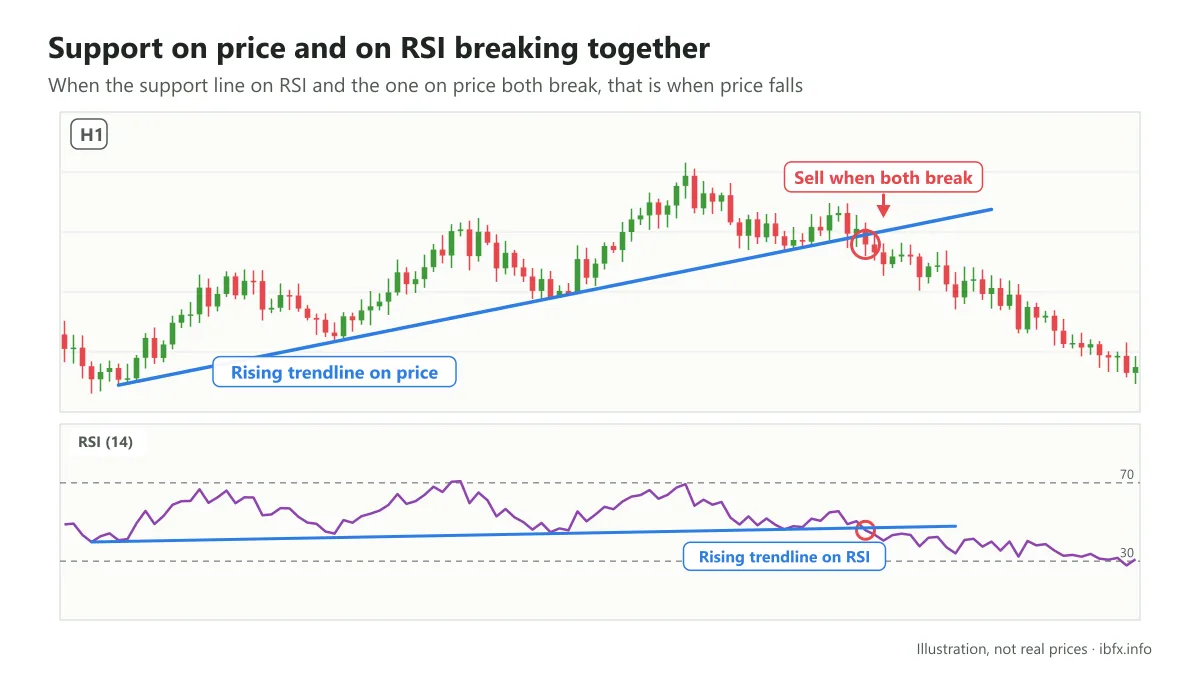
You can see that price formed a fairly strong support line, and RSI did the same; when the support line on RSI and the one on price both broke, that was also when price fell.
Look at the next example to see it more clearly: the resistance level on the price chart is marked by the blue horizontal line, and the RSI value at each touch of resistance is written on the picture.
Price came back to this level several times. A strong resistance level is usually not easy to break and needs a strong enough push to get through.
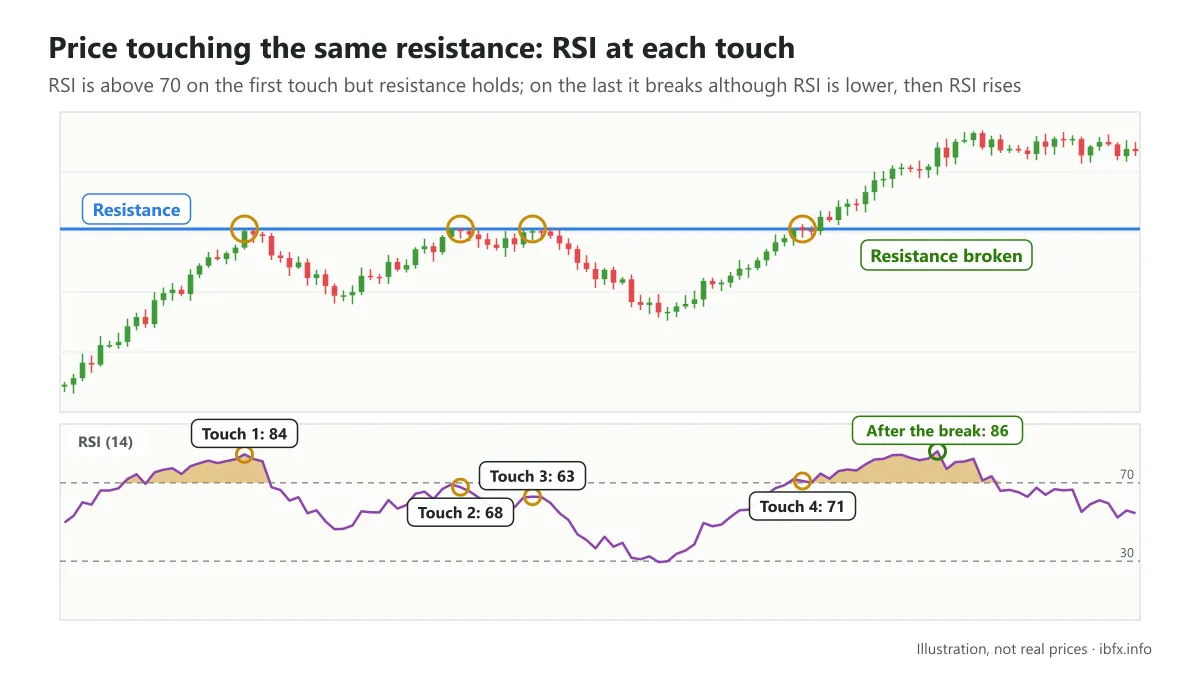
RSI is useful for judging the strength of price, because that is exactly what RSI measures: the momentum and the relative strength of price.
In the example above, price came back to the resistance zone four times: on the first touch RSI was above 70 but resistance still held; on the next two touches RSI was lower each time, showing that the upward push was weakening; on the last touch RSI ticked up and resistance broke even though RSI was still lower than on the first touch, and RSI then rose hard. So the RSI value at the moment price touches resistance does not always tell you in advance whether resistance will break; RSI is only one factor in the judgment, and you need to read price action as well.
Using RSI Failure Swings
As mentioned, the Failure Swing is the signal Wilder himself thought most of when he introduced RSI.
At heart the Failure Swing is still about the overbought and oversold zones, but applied to RSI it works a little differently.
According to Wilder, a Failure Swing Top forms when: RSI rises above 70, then falls to make a low (called the Fail Point), then rises again but cannot get past the previous RSI high, and finally falls through the Fail Point. The moment RSI breaks below the Fail Point is the sell signal. This signal rests entirely on RSI, with no need for price to make a higher high; if price does make a higher high at the same time, that is also a bearish divergence signal.
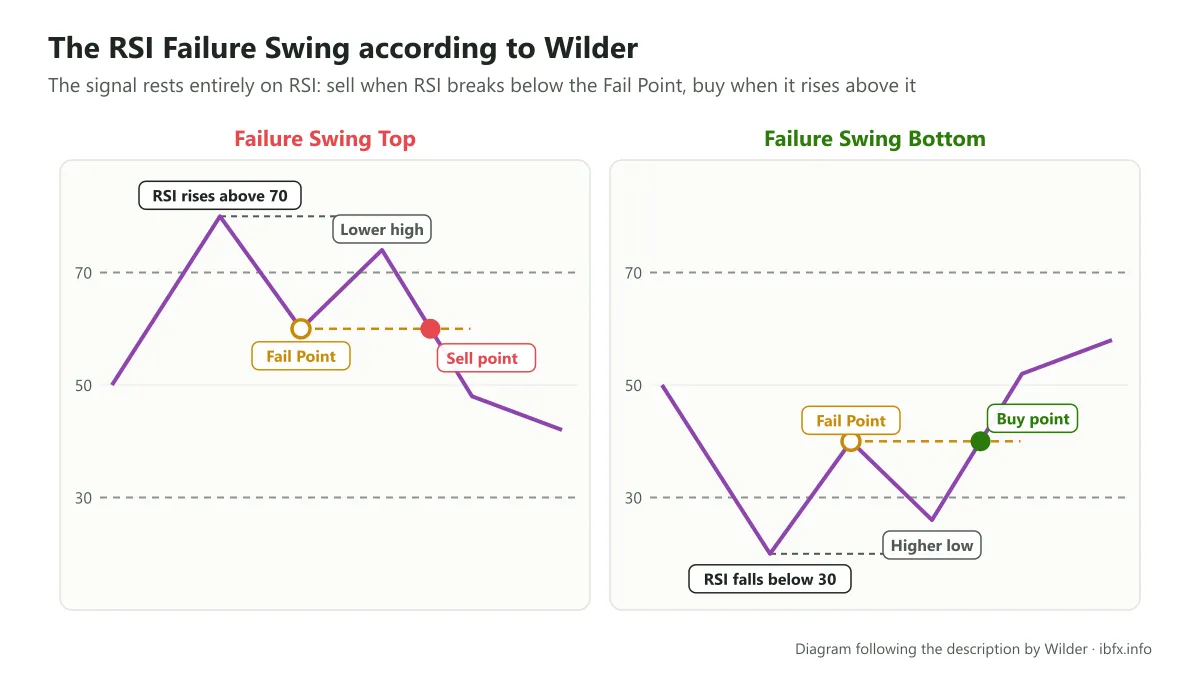
Wilder’s explanation of Failure Swings
The other way round, a Failure Swing Bottom forms when: RSI falls below 30, then bounces to make a high (the Fail Point), then falls again but does not break the previous RSI low, and finally rises through the Fail Point. The moment RSI rises above the Fail Point is the buy signal.
A summary and a few things to keep in mind about RSI
RSI giving an overbought or oversold signal does not mean price will reverse. This is true not only of RSI but of every indicator, so weigh it up to avoid being caught out.
You should combine RSI with at least 1 other tool (trend, support and resistance, candlestick patterns) to cut down false signals.
Overbought and oversold zones on a larger timeframe are worth more.
The RSI indicator is a single band moving between three zones:
- The overbought zone: 70-100
- The oversold zone: 0-30
- The neutral zone: 30-70
The basic signals that come from the RSI indicator:
- An overbought signal – the RSI line sits in the 70-100 zone.
- An oversold signal – the RSI line sits in the 0-30 zone.
- The Failure Swing – as set out above.
RSI divergence
- Bullish RSI divergence – price makes a lower low while RSI makes a higher low.
- Bearish RSI divergence – price makes a higher high while RSI makes a lower high.
A basic RSI trading strategy has these rules:
- Only consider entering when the RSI signal (leaving the overbought or oversold zone, divergence, a Failure Swing) is confirmed as well by the trend, by support and resistance or by a candlestick pattern.
- Place the stop loss beyond the high or the low made at the moment of the reversal, and work out your position size from that distance.
- Hold the trade until RSI or price gives the opposite signal, or until price reaches the target you set.
The RSI indicator can give a lot of false signals, and it is best not to use it on its own. Combine RSI with candlestick chart analysis and with other tools, and practice on a demo account before you trade for real.