On this page
The fakey is a price action pattern that many traders watch, because it shows a false break in price. So what is a fakey, and how do you spot it and trade it? Let’s go through the article below.
What is the fakey pattern?
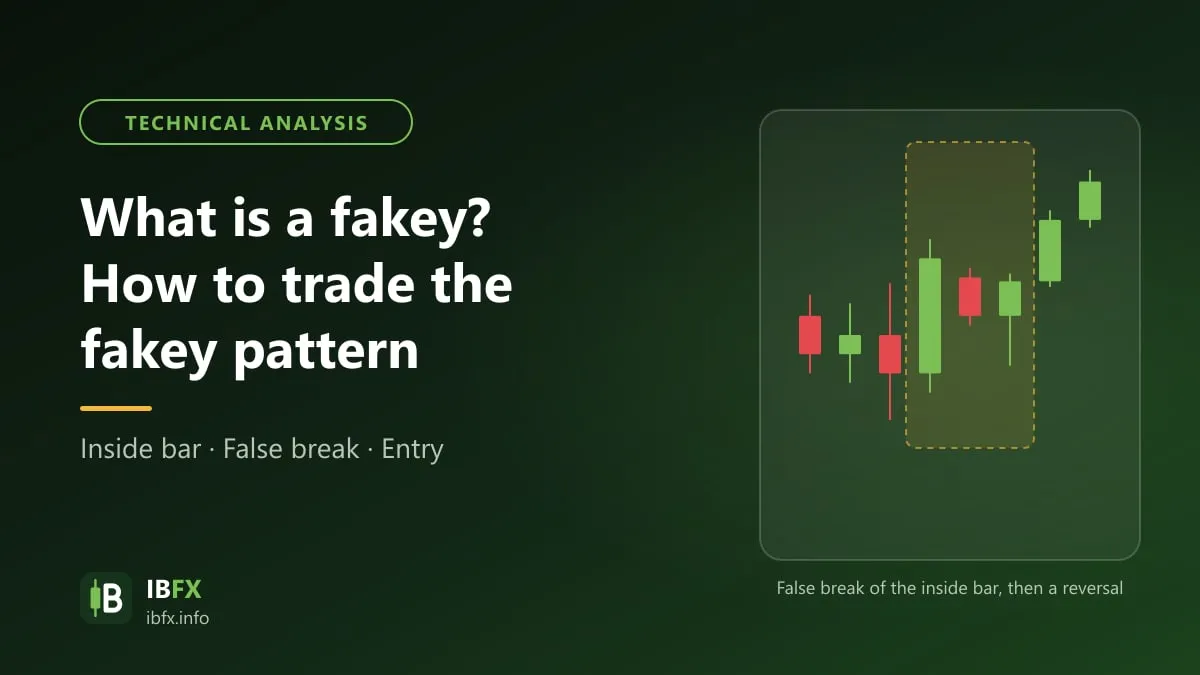
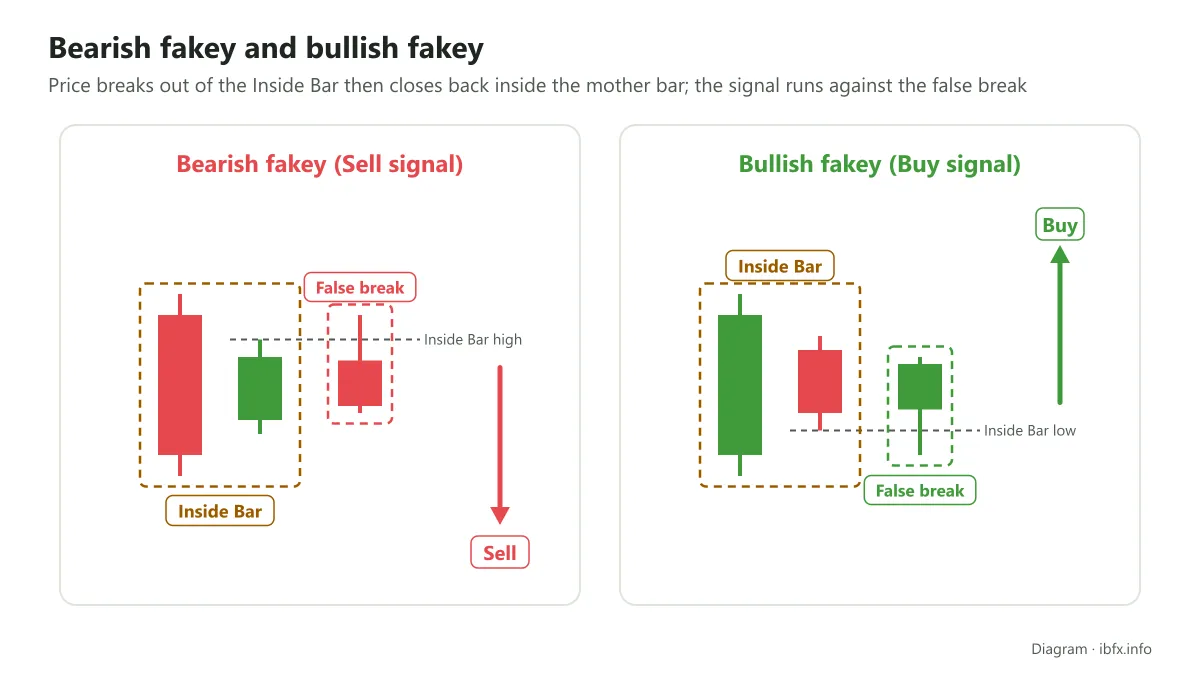
The fakey is a price pattern that forms out of a false break in the market. The basic structure is: a mother bar, an inside bar that sits entirely within the mother bar, then a bar that breaks above or below the edge of the inside bar but is quickly snapped back and closes again inside the price range of the mother bar, producing a false break.
So the fakey pattern stands for a false break in price. Many traders see these breaks as a trap set by the large players in the market (banks, hedge funds): price is pushed outside to sweep stop losses and trigger the orders that retail traders have placed in the direction of the break, and then it turns back.
That is why the fakey signal runs against the direction of the false break: if price breaks up falsely and then turns down, that is a bearish fakey (a Sell signal); if price breaks down falsely and then turns up, that is a bullish fakey (a Buy signal). A fakey is usually more reliable when the signal runs with the main trend, or when it appears at an important support or resistance zone.
Example:
In the example below you can see a bearish fakey signal and a bullish one. Note that the fakey pattern usually has one inside bar sitting within the mother bar, after which price breaks out but quickly turns back, producing the false break.
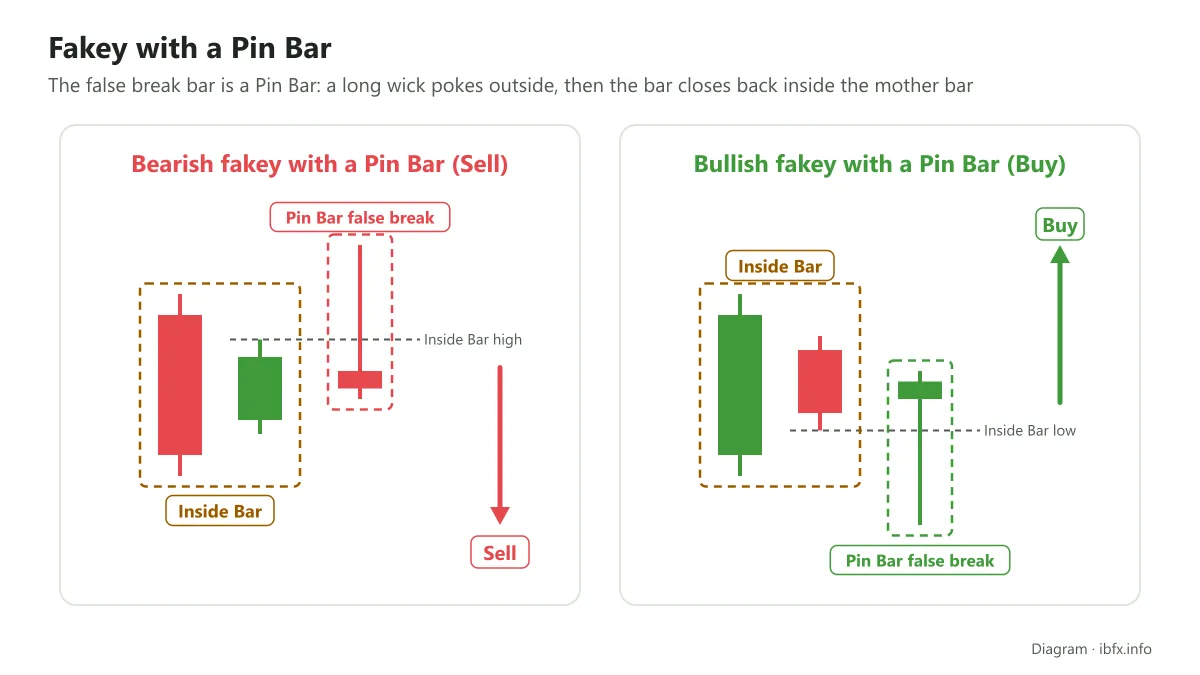
Note: not every fakey signal looks exactly like the model pattern above; there can be a great many variations. For instance you may come across a fakey combined with a pin bar. You may also come across a fakey with 3 false break bars, although those cases are fairly rare. Even so, you need a firm grasp of the fakey from the basics through to the more advanced cases in order to trade it well.
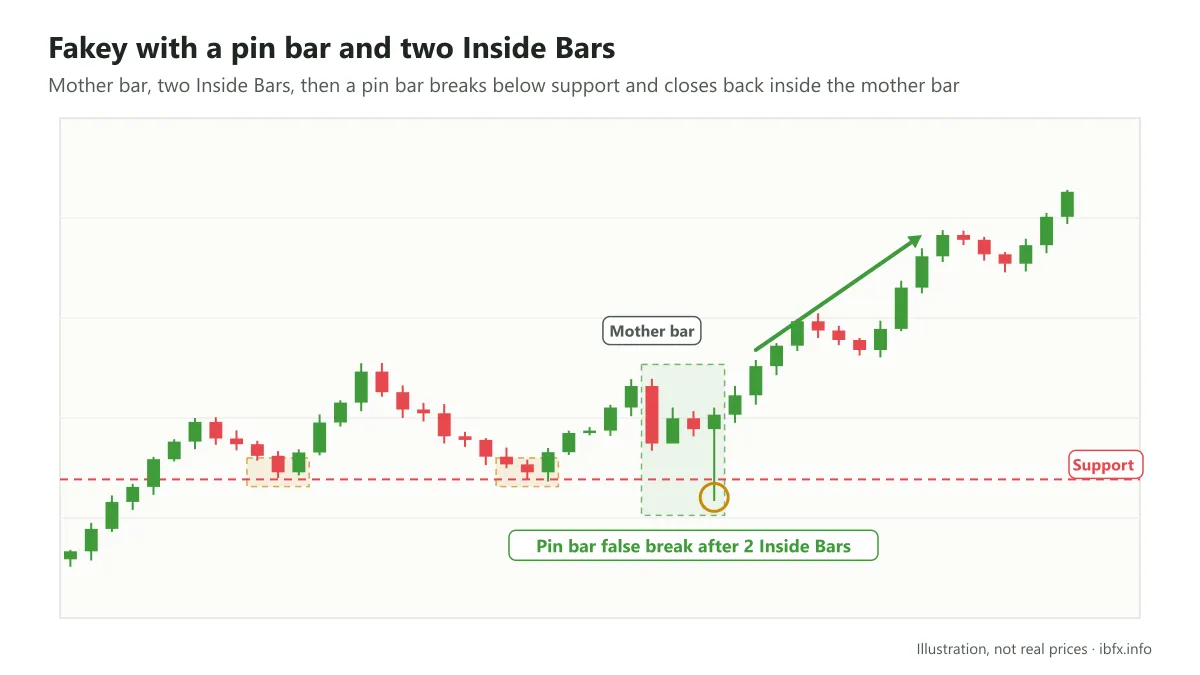
In the example below you can see the fakey pattern combined with a pin bar:
How to trade the fakey signal
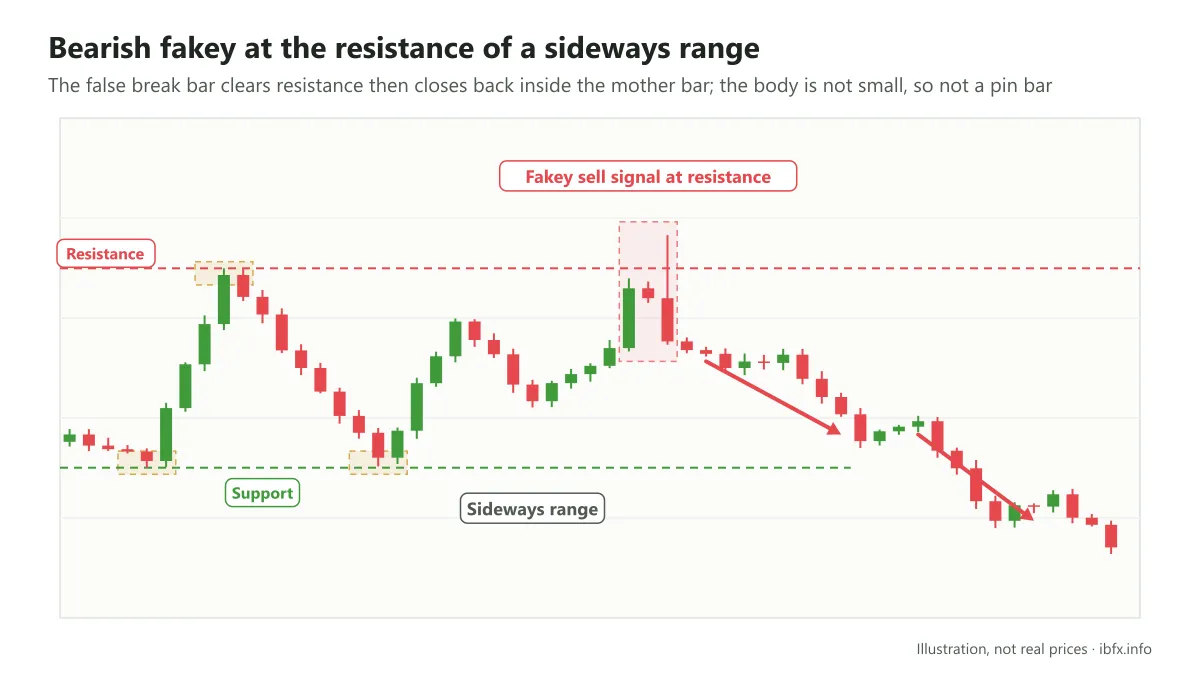
The fakey signal can appear in many market conditions, but it is used most in a trending market (trading in the direction of the main trend) or at the upper and lower edges of a sideways range.
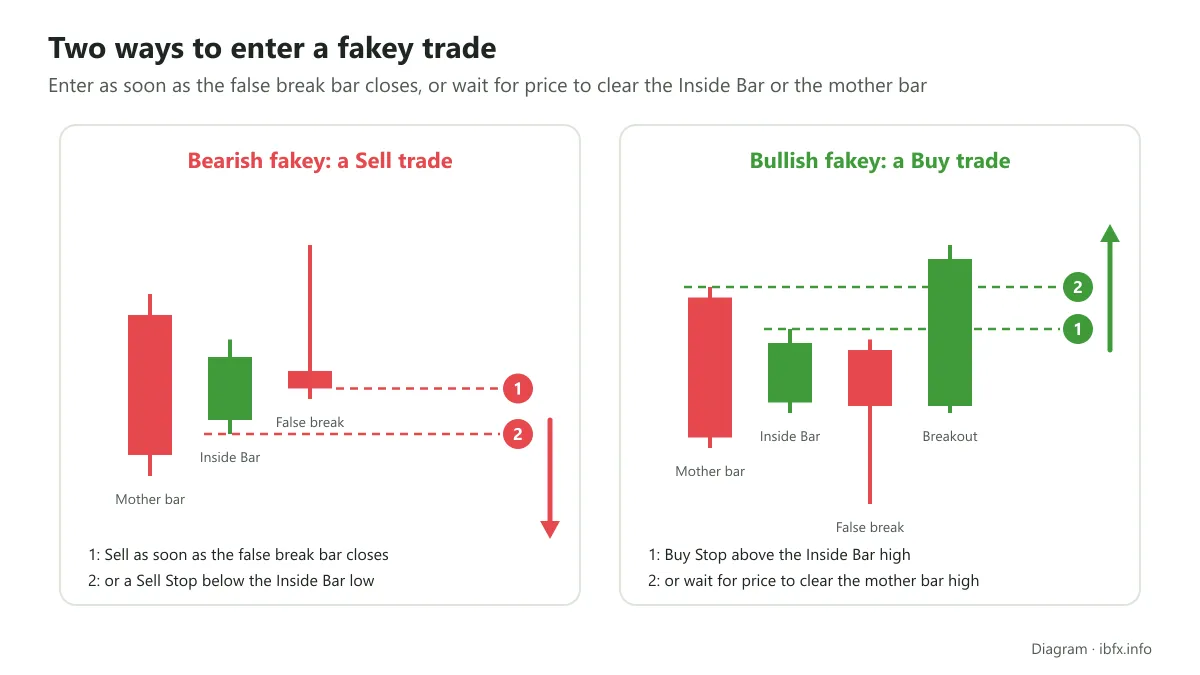
The fakey pattern gives a fairly clear entry point and stop loss placement:
- Entry: when the false break bar closes back inside the range of the mother bar, or wait for price to clear the opposite edge of the inside bar as confirmation.
- Stop loss: outside the wick of the false break bar (below its low for a bullish fakey, above its high for a bearish one).
- Position size: work it out from the stop loss distance so that the amount you can lose stays within your limit (1–2% of the account, for example).
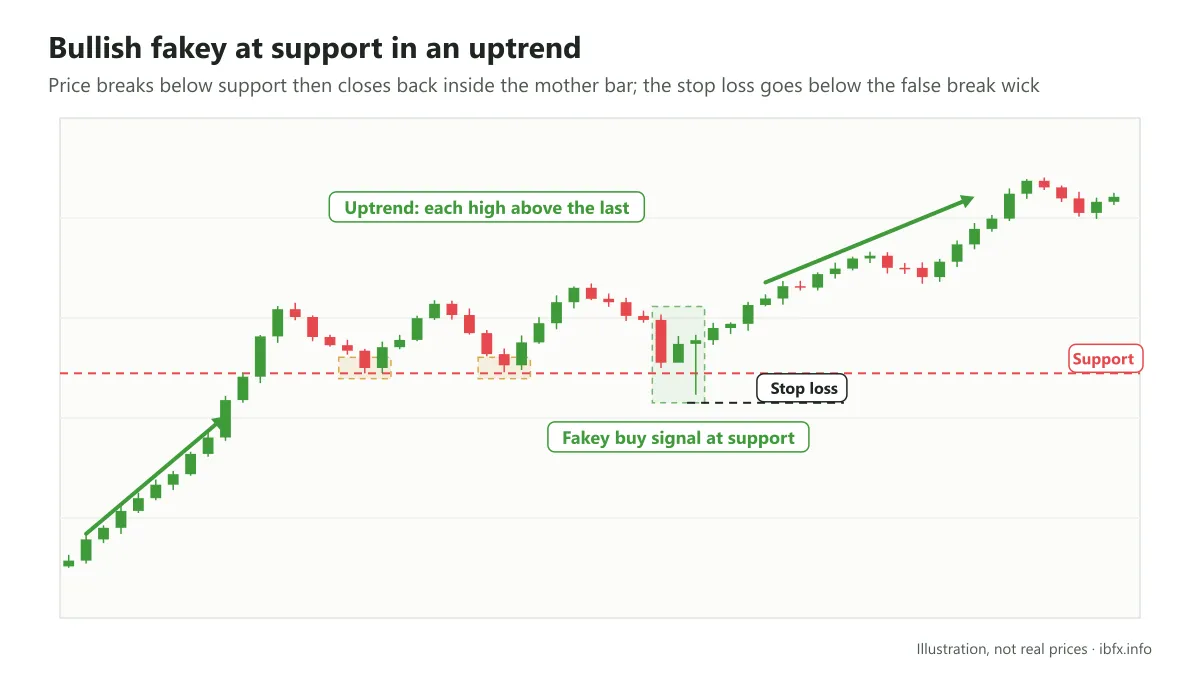
In the chart example below, the market is clearly trending, with each high above the last, and a fakey buy signal forms at an important support zone. Here a sensible stop loss can go below the support level or below the false break bar.
Let’s look at another example of a fakey signal, but this time it is a signal that forms at the boundary above and below a resistance level. Note: this fakey is not really combined with a pin bar, because the body of that bar is not small enough compared with its tail.
Be careful when you trade the fakey
The fakey pattern can never be completely perfect, so be cautious and build up a good feel for your trading. This is the quality that separates professional traders from amateurs.
For instance, you do not always see just one Inside Bar inside the price structure; sometimes you see more, as many as 2 or 3 such bars. In the example below you can see a pattern that combines a good pin bar with two inside bars before the false break happens.
What marks out a good fakey signal is a clear price structure. If you also take trades on patterns that are not really clear, over the long run your win rate can drop a great deal. Give priority to the zones where signals line up, such as a support or resistance level together with a pin bar, a trendline and a fakey; that makes the signal more reliable.
Final thoughts
The fakey pattern is a useful tool if you know how to trade it properly. What a fakey reflects is a reversal in market sentiment after a failed break. For traders without much experience, it is very easy to fall into the false break trap. The breakout strategy (trading the break of a barrier level) is very popular, so understanding false breaks and staying alert to them through the fakey pattern is necessary.
That said, a fakey can fail too: price can come back and break for real afterwards. Always place a stop loss, practice spotting the pattern on a demo account and learn from your mistakes, and you will gradually come to recognize the traps the market sets.