On this page
Just about anyone who trades forex knows the Doji candle, one of the classic candle shapes because it is so easy to spot. But seeing a Doji does not mean you enter a trade straight away: you have to weigh several more factors to guard against the risk. The article below will help you understand the Doji better, and how to trade the Doji candle.
What is a Doji candle? What a Doji looks like
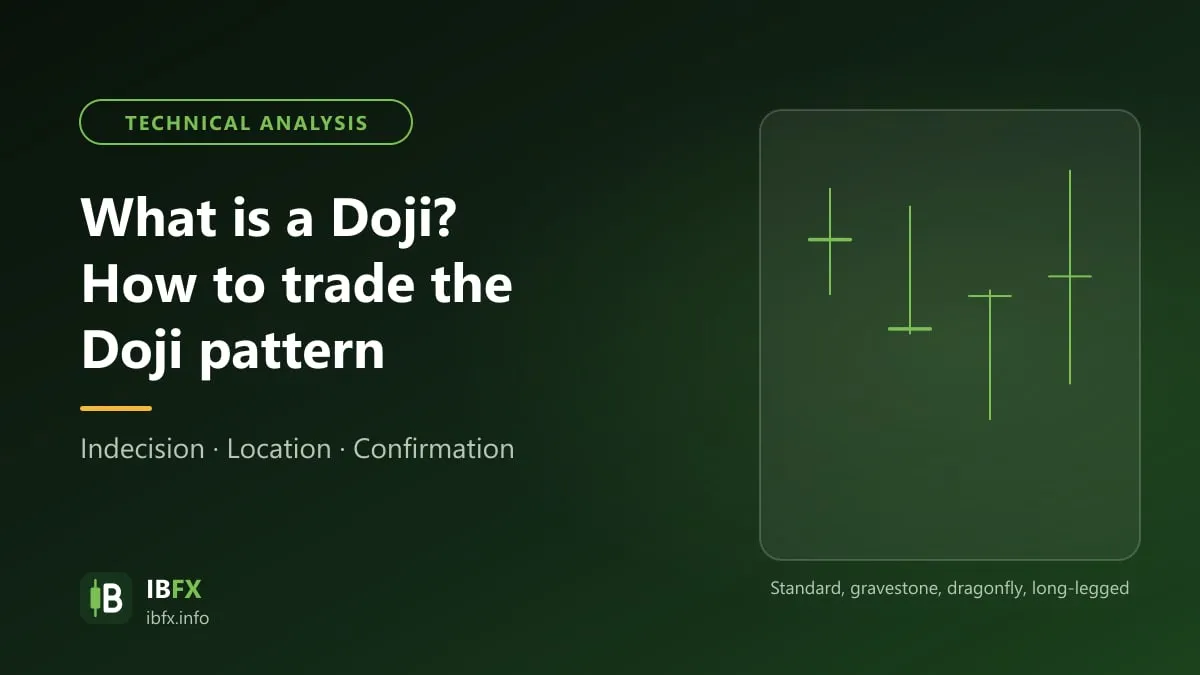
A Doji is a candle whose open and close are the same, or near enough the same, so the body of the candle is very thin, almost nothing more than a horizontal line. Together with the upper and lower wick (which can be long or short), a Doji usually looks like a + sign or a cross.
- Candle shape: a very thin body, almost no body at all
- Color: green or red
- Tone: neutral, it shows hesitation
- If the close is higher than the open >>> a green Doji candle
- If the close is lower than the open >>> a red Doji candle
Because the body of the candle is so small, the color of a Doji carries almost no meaning.
There are several explanations of the name “Doji” in Japanese: some sources translate it as “the same”, “at the same time”, pointing to the fact that however much price swings during the session, at the end of the session the close and the open are still near enough the same.
Other sources translate “Doji” as “a mistake”, “clumsy”, to speak of how rare it is for the open and the close to come out exactly equal.
Look at the illustration below to get a clearer picture:
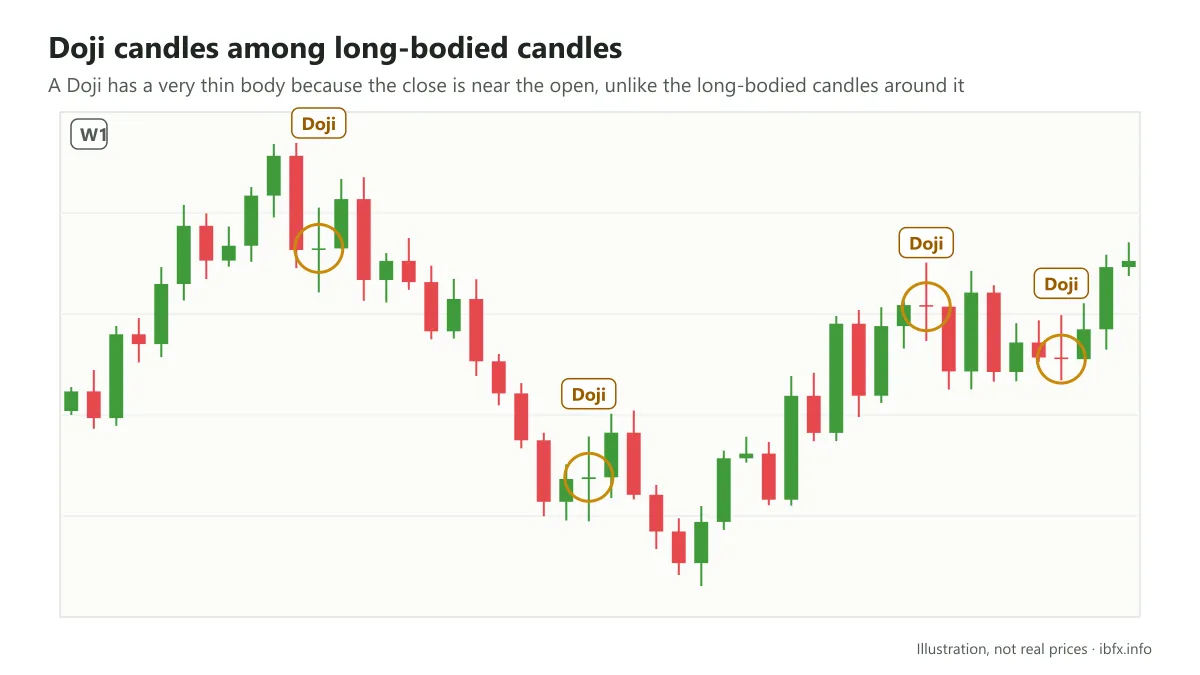
That is why a Doji is built quite differently from long-bodied candles such as the Marubozu. Simple as it looks, a Doji still says a fair amount about the mood of the market.
What a Doji pattern says about market psychology
A Doji is the candle that helps a trader filter out information about the balance between the two sides.
A resting place, a stop along the way for the side in control
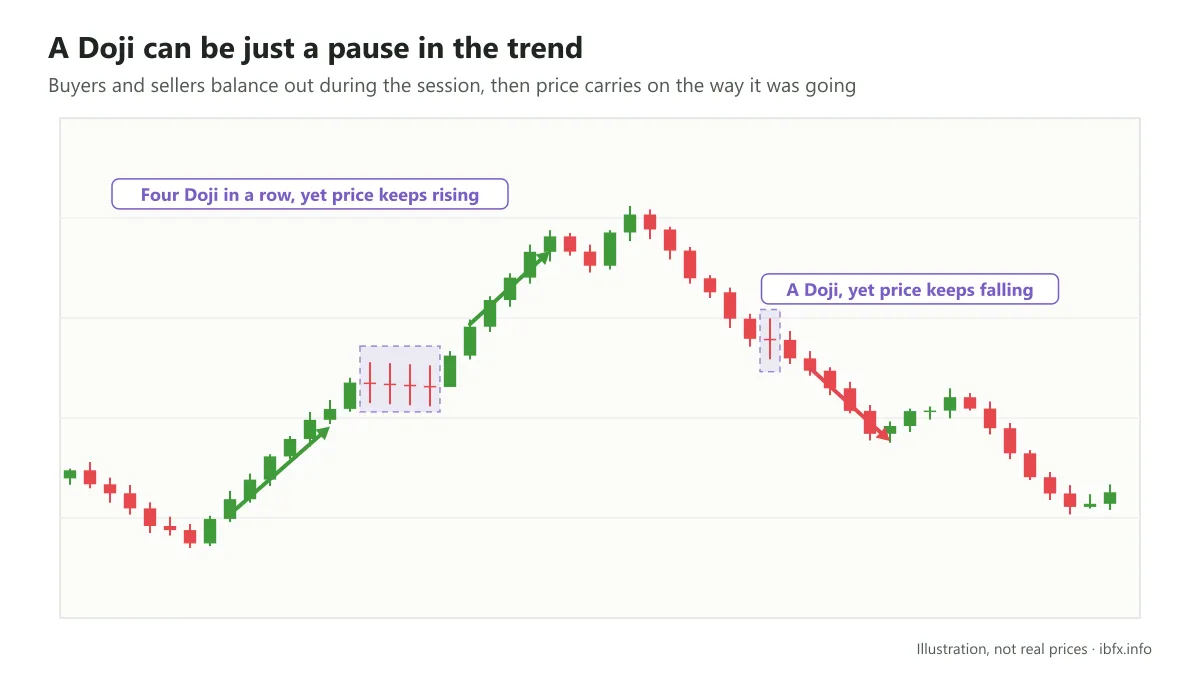
A trading session that closes with a Doji candle shows that buying and selling pressure were almost balanced during the session: at times price was pushed up, at times pushed down, but in the end the close came out near the open. That shows the market waiting and watching, and quite often a Doji is only a pause before price carries on in the direction it started in.
Looking at the picture above, when 4 Doji appear one after another, price does not reverse at all; it only pauses before rising further. On the right-hand side, when price falls, the red Doji candle marked out is not enough to turn price around either, and sellers stay in control.
It shows hesitation, a lack of conviction
From the angle of price action, a Doji stands for hesitation on the part of both buyers and sellers: the two forces are in balance, so price gets nowhere, and buyers and sellers are waiting for more information.
So a Doji only shows a sign that the strength of the trend may be easing, or that the original trend may have “cooled off” and is no longer as strong as before.
A possible signal of a trend reversal
This is the side of it that most traders pay attention to when a Doji appears. But as said above, it may also be no more than the moment when buyers or sellers take a rest before the trend goes on.
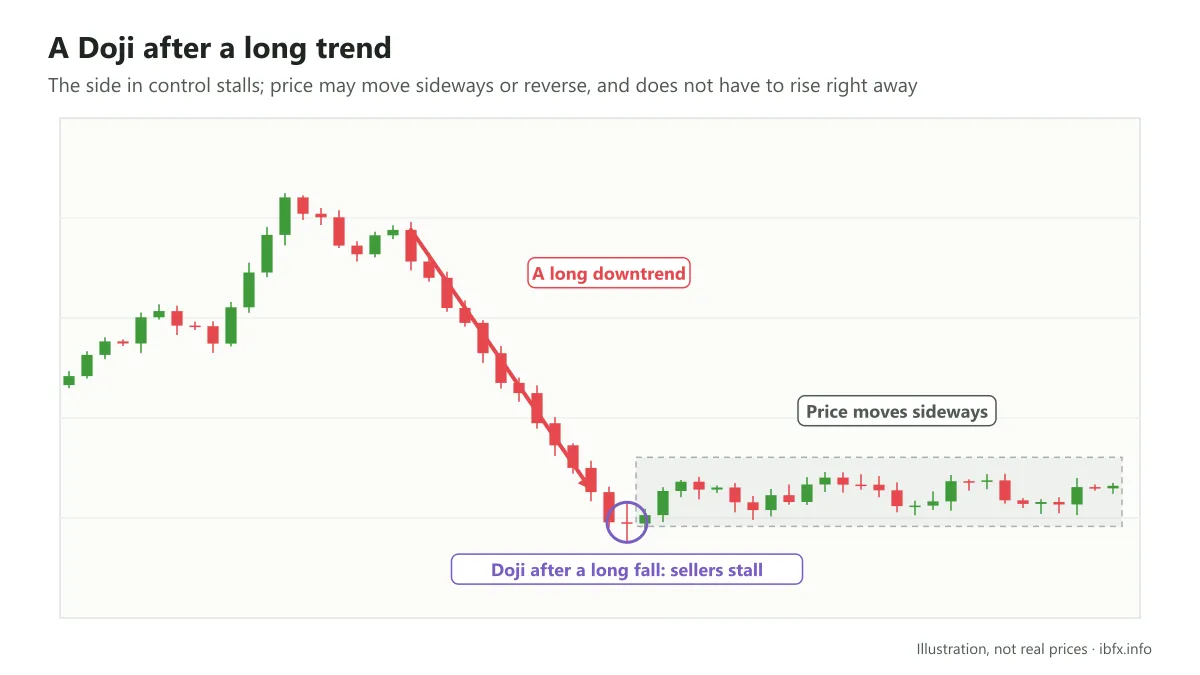
When a Doji appears after a long trend, especially at an important support or resistance area, it shows that the side in control has stalled, while the weaker side has grown stronger than it was.
In cases like these price may reverse, and if a reversal really does happen, the move the other way can be quite strong.
How does a Doji differ from a Spinning Top?
The Spinning Top candle looks very much like a Doji, but the body of a Spinning Top is larger than the body of a Doji.
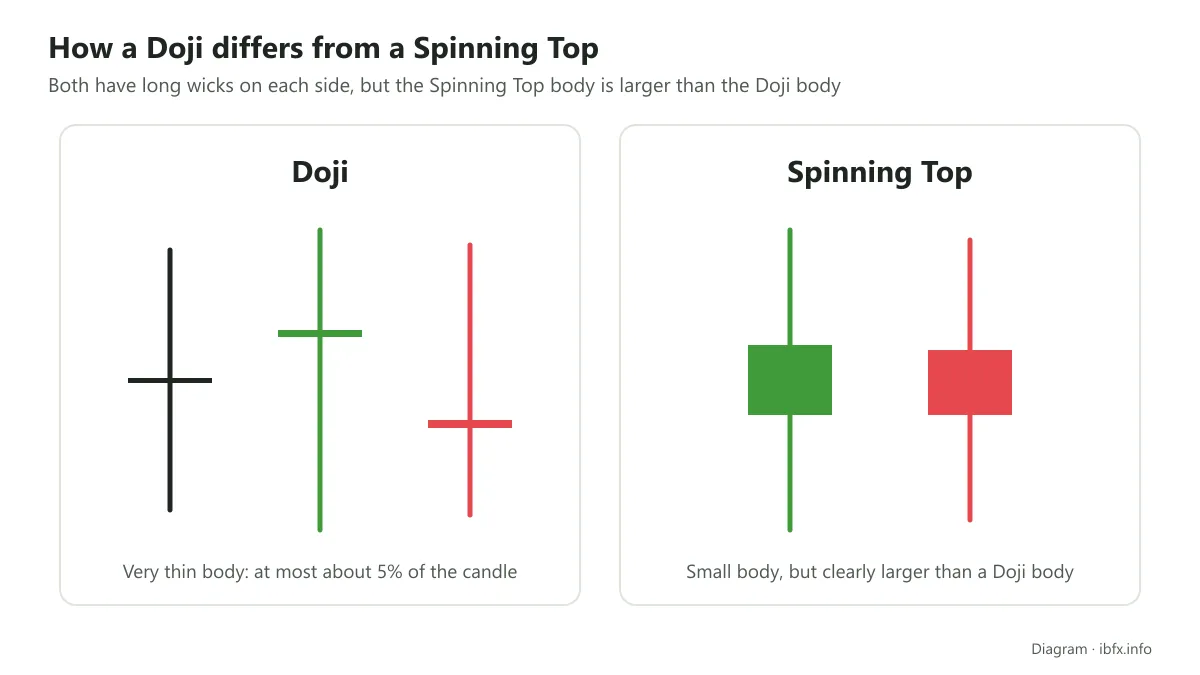
Many traders work to a rule of thumb: if the body of the candle is at most about 5% of the length of the whole candle (wicks included), it counts as a Doji candle.
The types of Doji candle
The Doji comes in several variants, the 5 most common being: the standard Doji, the long-legged Doji, the gravestone Doji, the dragonfly Doji and the four-price Doji.
| Type of Doji | Shape | Signal |
|---|---|---|
| Standard Doji | A very thin body, the close near enough the open, the upper and lower wick about the same length, looking like a + sign. | Hesitation, little meaning in itself if it stands alone |
| Long-legged Doji | The upper and lower wick are far longer than on a standard Doji, showing a session that swung hard while the close still came out near the open. | Hesitation, a lack of conviction |
| Gravestone Doji | A long upper wick, almost no lower wick; the open and the close sit at the low of the candle. Buyers pushed price up but could not hold it, and by the end of the session price was dragged back near the open. | A warning of a possible downward reversal when it appears after an uptrend (a confirming candle is needed) |
| Dragonfly Doji | A long lower wick, almost no upper wick; the open and the close sit at the high of the candle. Sellers pushed price down but could not hold it, and by the end of the session price was pulled back up. | A warning of a possible upward reversal when it appears after a downtrend (a confirming candle is needed) |
| Four-price Doji | Nothing more than a horizontal dash: open, close, high and low are all but equal. It usually turns up when the market is very quiet, for example on a small timeframe when liquidity is thin. | Almost no trading meaning |
The types of Doji candle
Things to keep in mind when you read a Doji
It is not over until it is over: seeing a Doji candle does not mean price is going to reverse!
The example above shows that clearly. Because the open and the close are all but equal, a Doji only gives you information about the hesitation, the indecision or the balance between the 2 sides. To know where price goes next, you have to look at the candles that form afterwards, and put other factors alongside them, before you know whether this is a Doji worth anything.
How to trade with the Doji candle
One tree does not make a forest: add a few indicators before you put a Doji to work!
A Doji is only a first condition; the context of the trend, the support and resistance areas and the indicators will help you filter the signal better. The basic steps:
- Look at the context: a Doji means more when it appears after a clear trend and at an important support or resistance area; a Doji in the middle of a sideways area is usually worth nothing.
- Wait for a confirming candle: with a Doji at a top, wait for a bearish candle that closes below the low of the Doji; with a Doji at a bottom, wait for a bullish candle that closes above the high of the Doji.
- Entry and stop loss: enter after the confirming candle; put the stop loss on the other side of the Doji wick (above the high of the Doji for a Sell order, below the low of the Doji for a Buy order), and work out your position size from that distance.
Putting a Doji together with momentum indicators: RSI, MACD, Stochastic Oscillator and so on
Momentum indicators such as RSI, MACD and Stochastic tell you about overbought and oversold areas, or give a divergence signal, showing that one of the two sides is weakening. Put together with a Doji candle, which shows hesitation, the chance of a reversal is usually higher than looking at the Doji on its own.
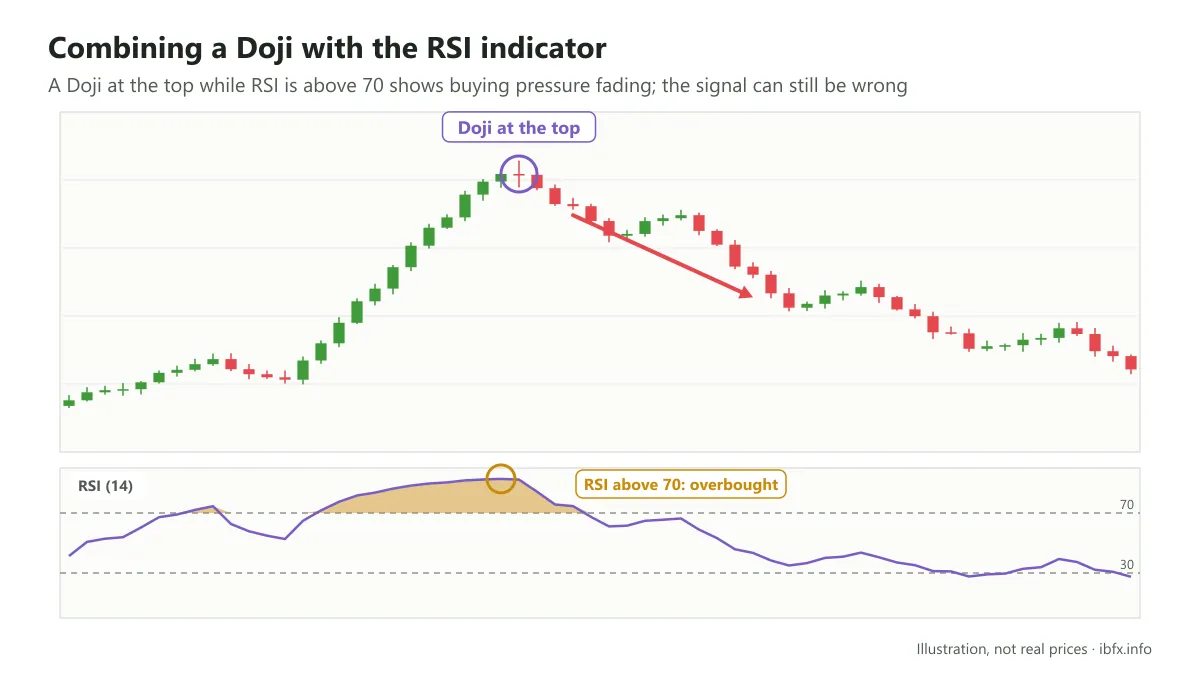
The picture above illustrates putting a Doji candle together with the RSI indicator. Even with several factors combined, the signal can still be wrong, so always place a stop loss and practice on a demo account first. See also one specific strategy: Trading with the Doji on the H4 timeframe.