On this page
The Pin Bar is one of the important candlestick patterns of the price action school of analysis. What the Pin Bar pattern stands for is the market rejecting a price: it shows the tug of war between the 2 sides, buyers and sellers, and it is a reversal signal that many traders watch.
In this article we will go through what marks out a Pin Bar, the market psychology behind the trading session that forms the candle, and how to trade the Pin Bar pattern.
What a Pin Bar is and what marks it out
What a Pin Bar is
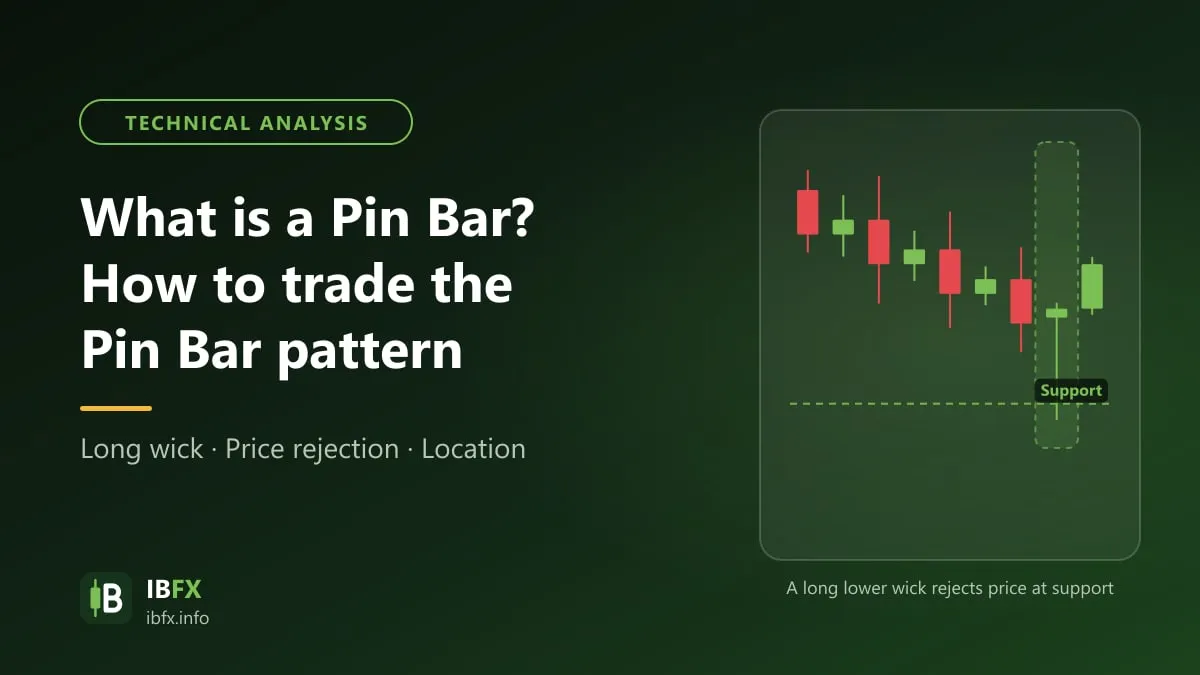
A Pin Bar is a Japanese candlestick with a distinctive shape; standing together with other candles and meeting certain conditions, it forms a reversal candlestick pattern. The first thing that identifies a Pin Bar is a wick that runs a long way to one side together with a short body. The long wick stands for the market rejecting a price: while one of the 2 sides, buyers or sellers, tries to push price the way it wants, the other side proves stronger and pulls price back the other way, and price can then carry on in the direction of the stronger side.
In price action analysis the Pin Bar is used as an important reversal candlestick pattern, and it can be applied in many financial markets such as stocks, foreign exchange and cryptocurrency. The Hammer candle is one form of a bullish reversal Pin Bar.
What marks out a Pin Bar
Some of the shapes a Pin Bar takes in the market
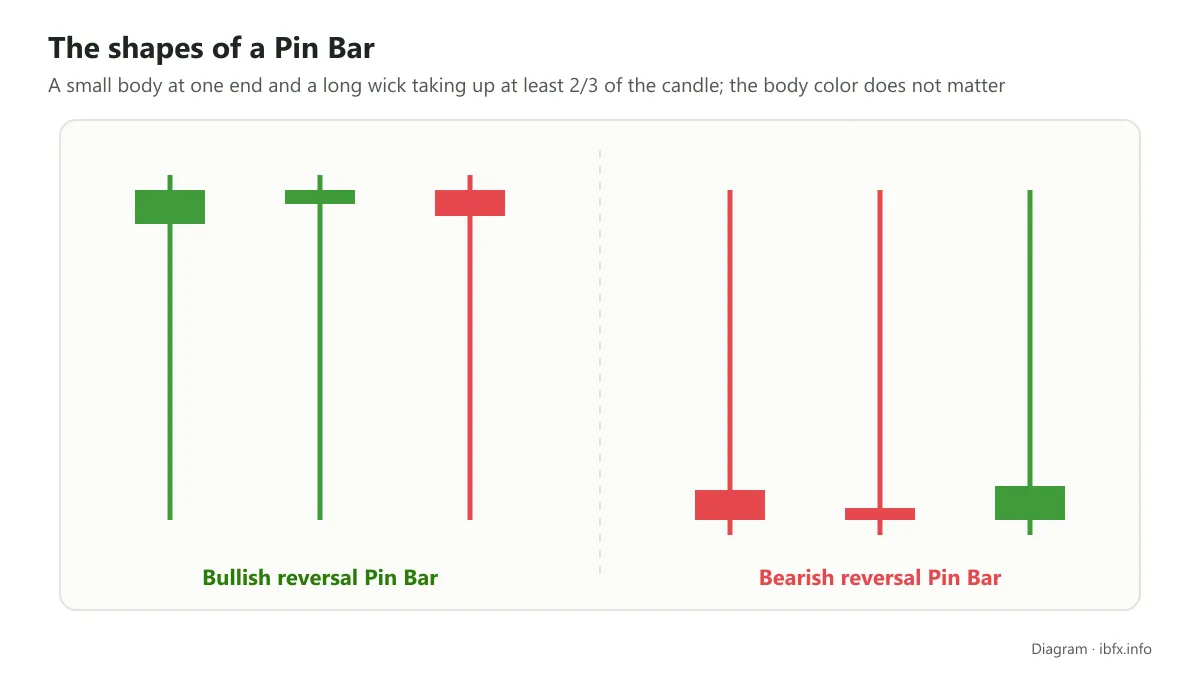
- The body of a Pin Bar is short, and the shorter the better; at times you will see the body as little more than a horizontal line. When the body sits right over to one side (the top or the bottom), that is, one wick is very long and the other very short, the pattern counts for more.
- The color of the Pin Bar body does not matter.
- One wick is very long (it is called the tail), at least 2 times the body, and the other wick should be as short as possible. The longer wick of a Pin Bar is the most important part of this pattern, because it is the part that shows the market rejecting a price. In some cases the long wick stands for a failed break of an important price level.
- Against the whole length of the candle, the tail of a Pin Bar has to be at least 2/3; if it is shorter, the candle is not counted as a Pin Bar, or, if you let it pass, the pattern counts for a great deal less. In practice, if a Pin Bar does not meet these conditions traders usually do not pay much attention when it shows up.
The types of Pin Bar and the market psychology behind each one
The types of Pin Bar
Going by the wick, the Pin Bar pattern is split into 2 types: the Bullish Reversal Pin Bar and the Bearish Reversal Pin Bar.
First of all, both types have to meet the marks of a Pin Bar set out above.
For the Bullish Reversal Pin Bar: the lower wick is very long and the upper wick is very short or absent. The color of a bullish reversal Pin Bar does not matter; it can be green or red.
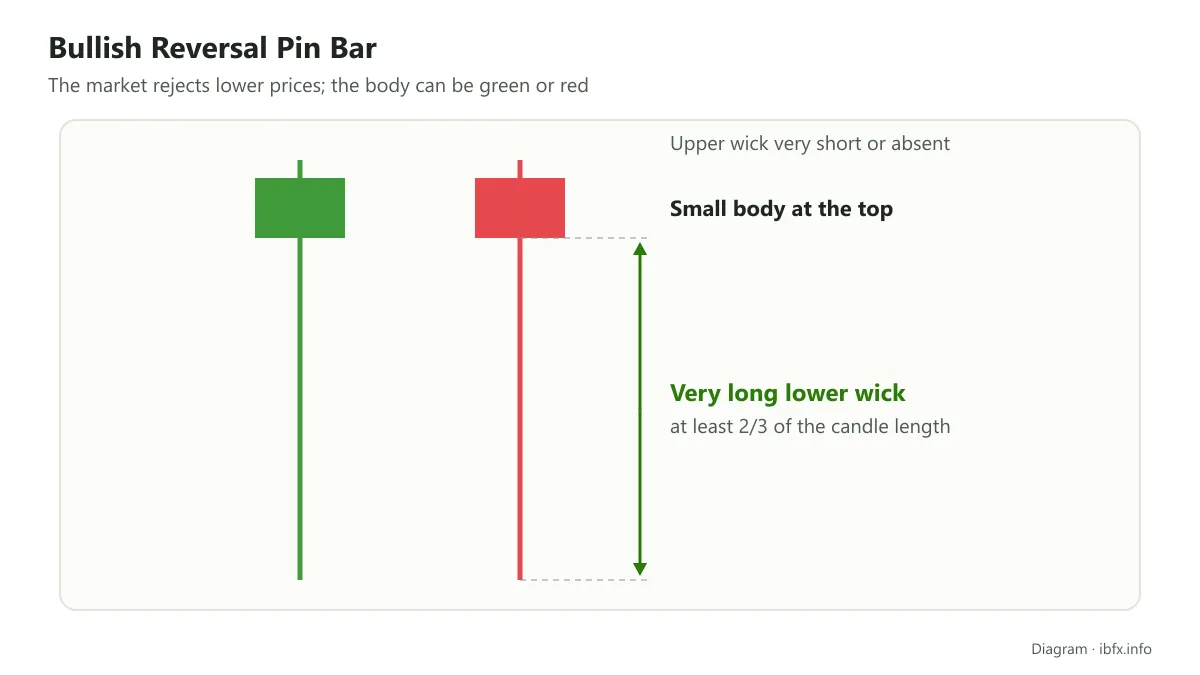
A long lower wick shows that sellers put in a great deal of effort to push price far down, but stronger buying pulled price back up close to the open → the market rejected the lower prices. In the session that forms a Bullish Reversal Pin Bar, the 2 sides, bulls and bears, fought it out hard, and in the end the bulls came out on top. In the sessions right after, buyers can carry on holding the upper hand.
For the Bearish Reversal Pin Bar: the upper wick is very long and the lower wick is very short or absent. In the same way, the color of a bearish reversal Pin Bar does not matter either.
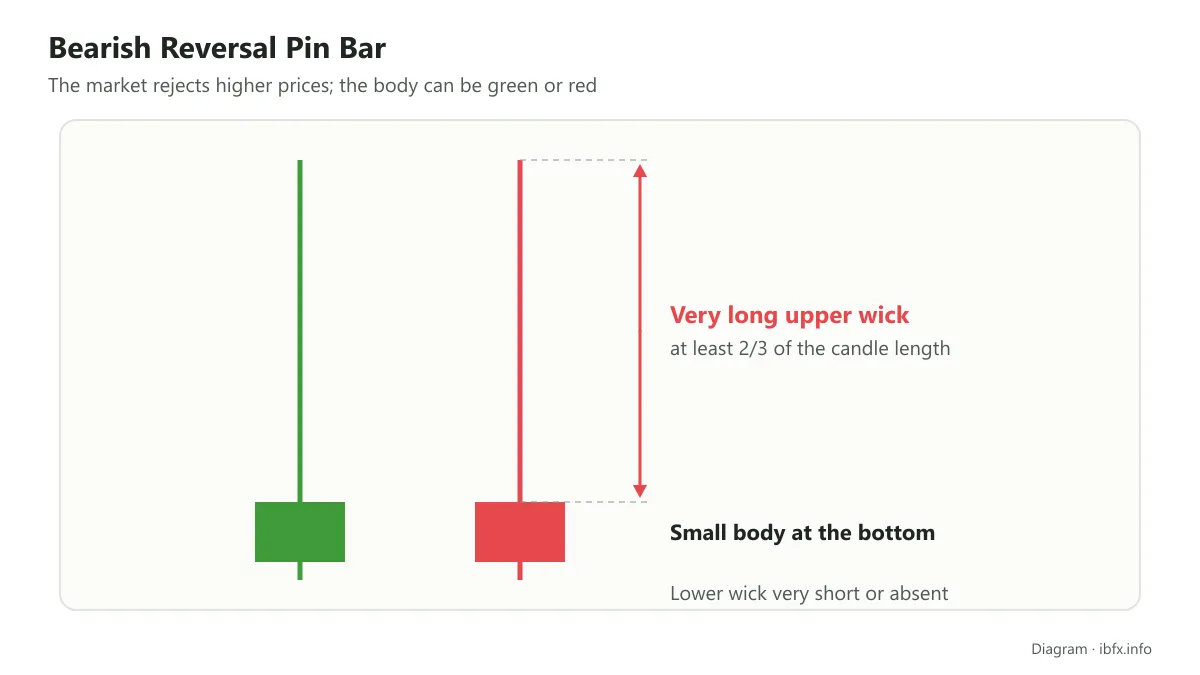
A long upper wick shows that buyers put a lot of force into pushing price up high, but at that point sellers struck back with stronger selling and pulled price back down close to the open → the market rejected the higher prices. In the session that forms a Bearish Reversal Pin Bar, the bulls looked to have the upper hand at first, but then the bears took it back. In the sessions after, the bears can carry on holding the upper hand.
The market psychology behind the Pin Bar pattern
As said above, when a Pin Bar shows up together with the candles before it and meets certain conditions, it forms a reversal candlestick pattern. With the 2 types of Pin Bar named above, the 2 Pin Bar reversal patterns have different marks, the market psychology behind each one is different, and the way each one bears on price right after is different too. In detail:
- The Bullish Reversal Pin Bar (the bullish reversal Pin Bar pattern)
The basic shape of this pattern is as follows:
- Before the Pin Bar shows up, the market is in a downtrend (long-term), a stretch of downtrend (medium-term) or a down wave (short-term).
- Next, a Bullish Reversal Pin Bar shows up
- After that, if the signal is right, the market reverses upward (long-term) and a new stretch of uptrend or a new up wave appears.
The Bullish Reversal Pin Bar pattern is modeled as follows:
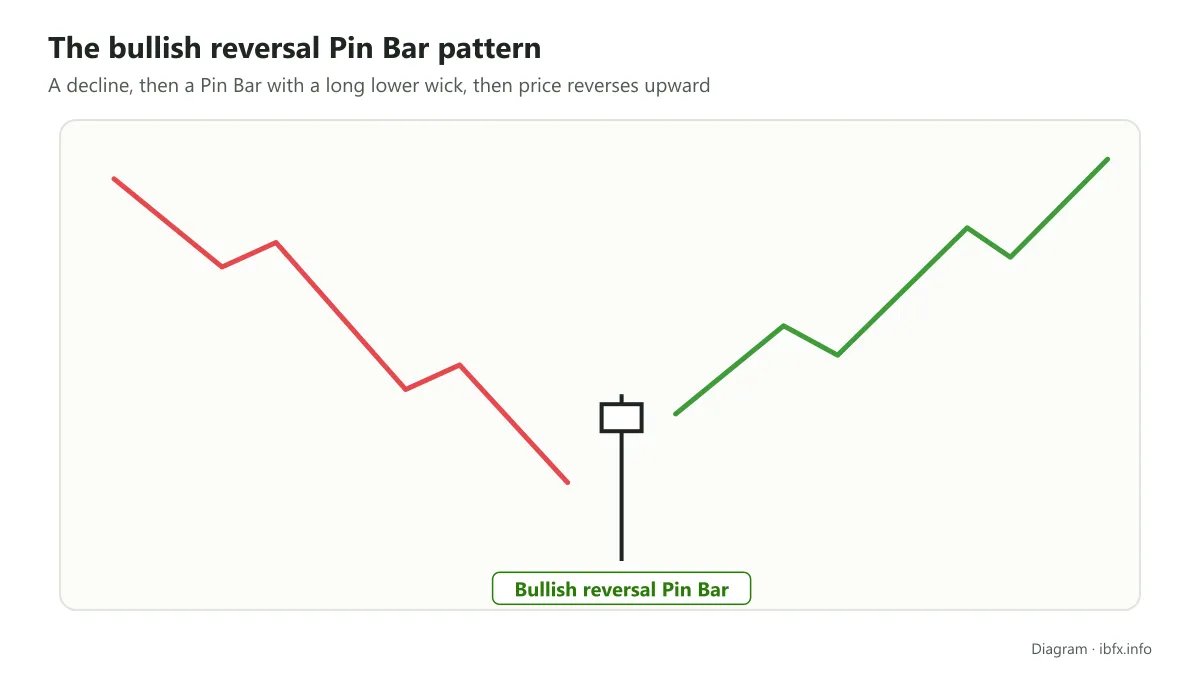
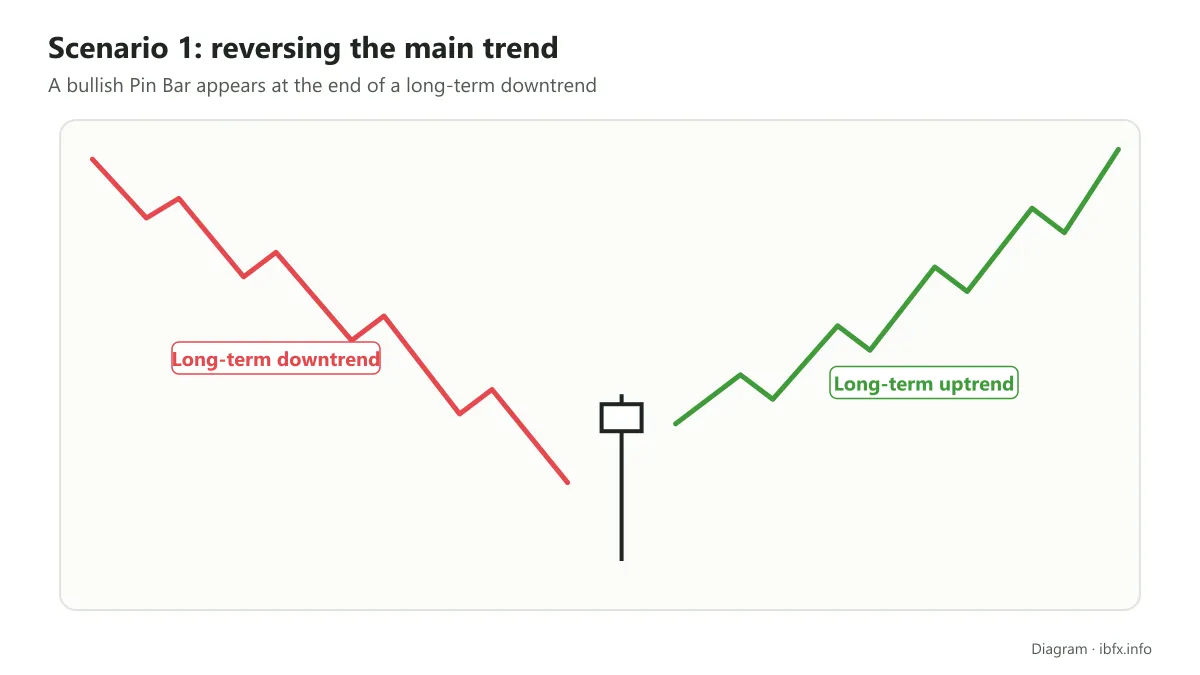
Scenario 1: a Bullish Reversal Pin Bar showing up at the end of a downtrend means that downtrend is gradually weakening, buyers may be strong enough to turn things around, and the market can reverse upward.
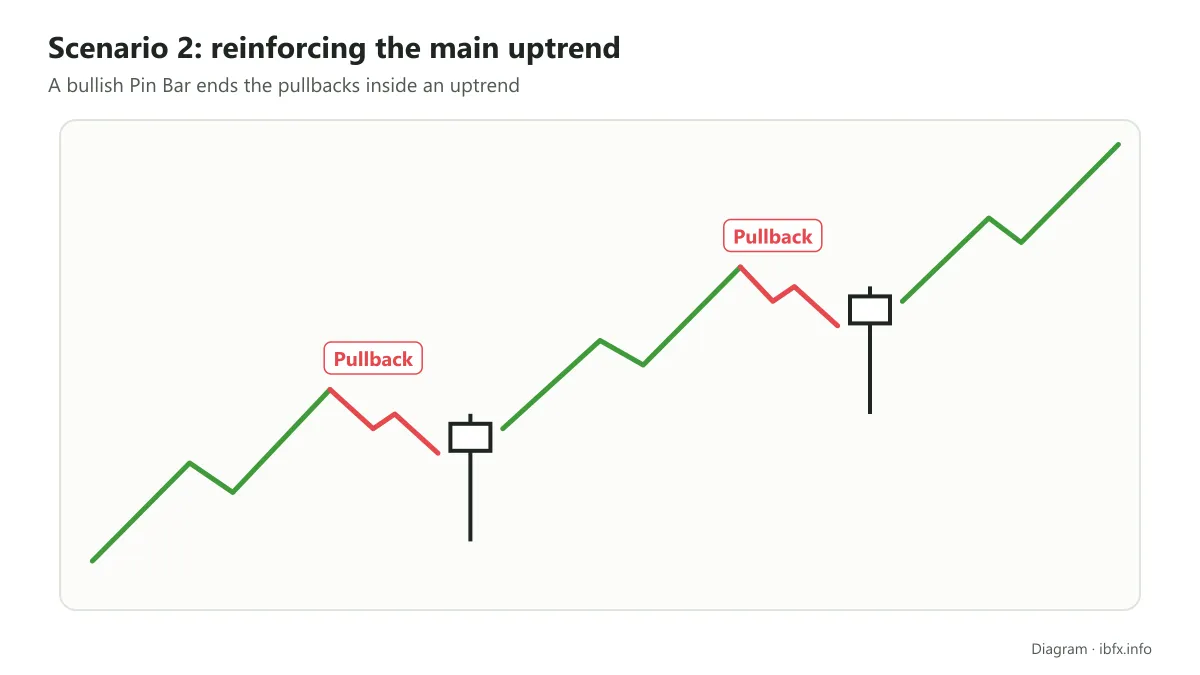
Scenario 2: if what came before is a stretch of downtrend or a down wave, and that stretch or wave is only a pullback within a rising market, then the Bullish Reversal Pin Bar that shows up does not let the market fall any deeper; buyers were only taking a rest to gather momentum to push price higher. Here the Bullish Reversal Pin Bar pattern plays the part of reinforcing the trend.
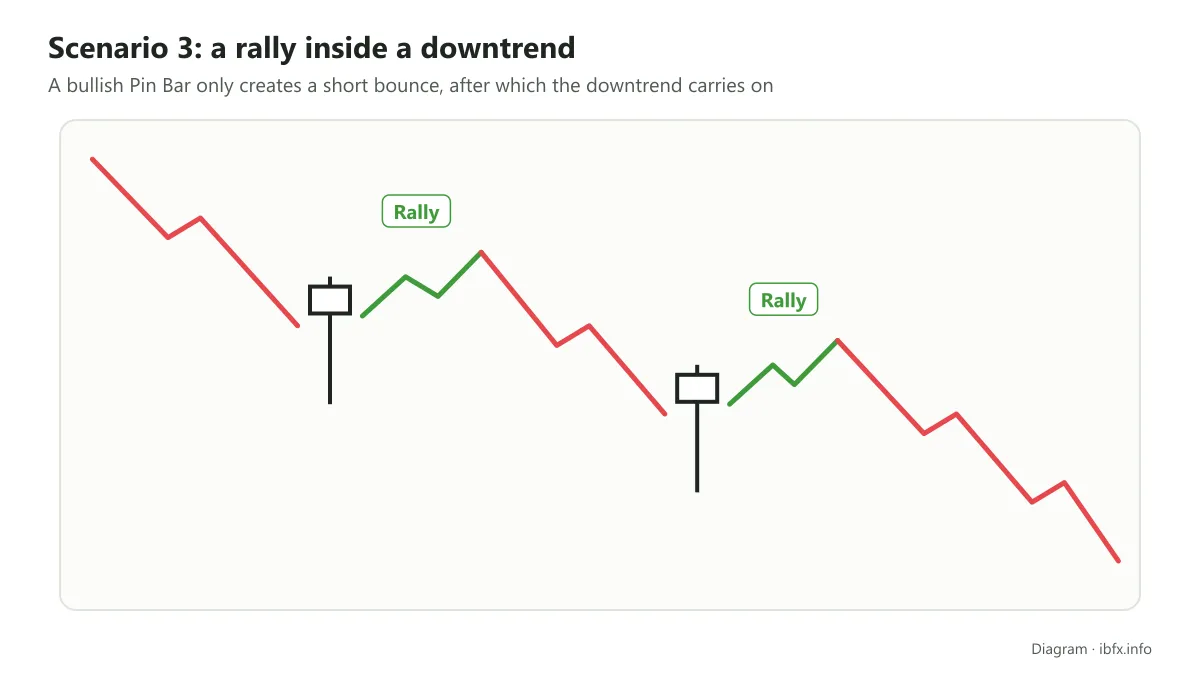
Scenario 3: if what came before is a stretch of downtrend or a down wave, and that stretch or wave runs with the main trend, then a Bullish Reversal Pin Bar showing up means sellers are resting for a while; buying is stronger than selling at that point and price reverses upward, but that is only a rally in the market, and once sellers have gathered their forces again they start pushing price lower and carry on with the original main trend. In this situation the Bullish Reversal Pin Bar pattern does no more than help a correction in the market take shape.
- The Bearish Reversal Pin Bar (the bearish reversal Pin Bar pattern)
The basic shape of this pattern is as follows:
- Before the Pin Bar shows up, the market is in an uptrend (long-term), a stretch of uptrend (medium-term) or an up wave (short-term).
- Next, a Bearish Reversal Pin Bar shows up
- After that, if the signal is right, the market reverses into a downtrend (long-term) and a new stretch of downtrend (medium-term) or a new down wave (short-term) forms.
The Bearish Reversal Pin Bar pattern is modeled as follows:
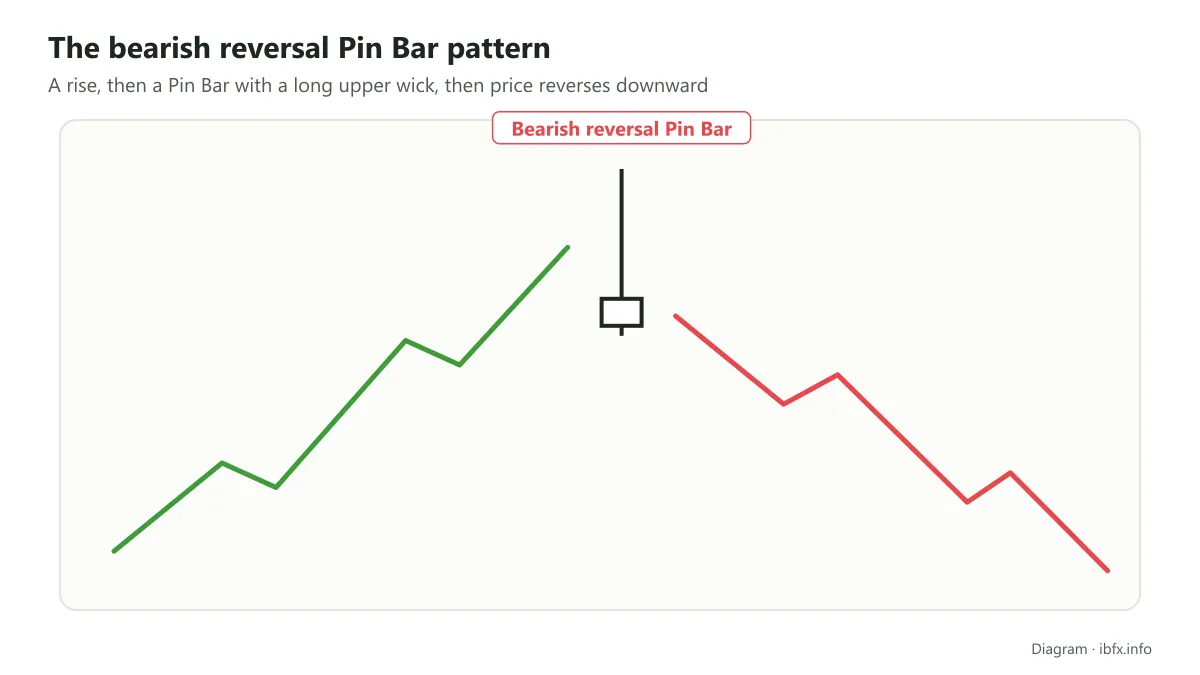
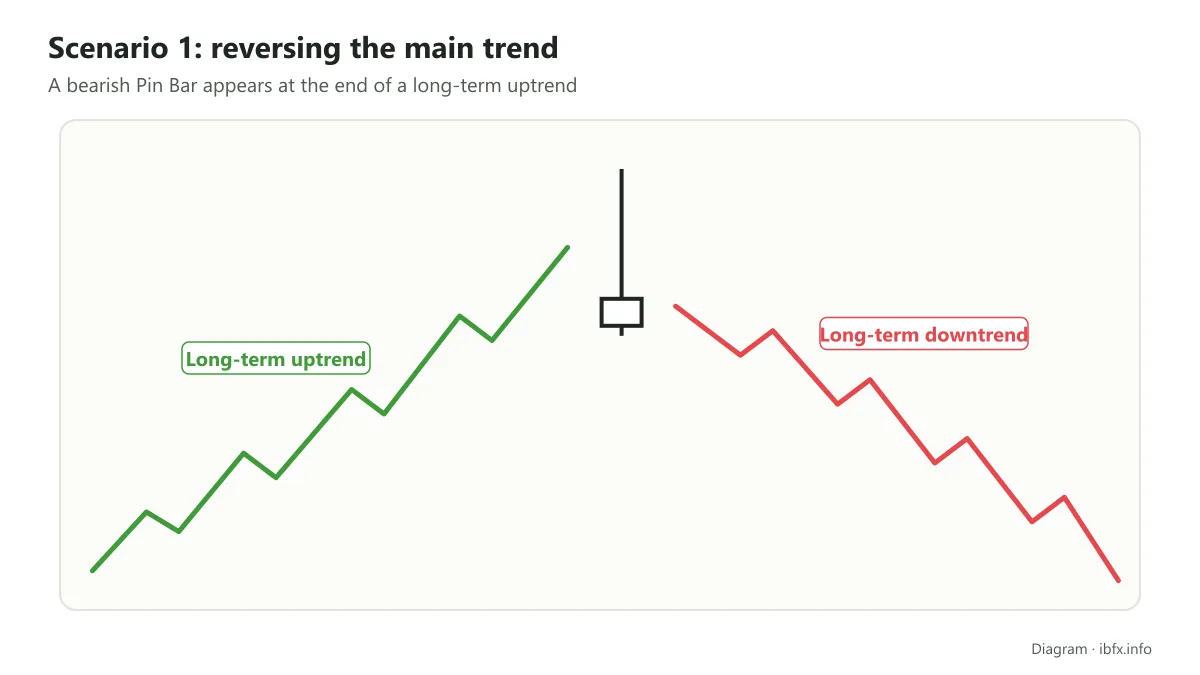
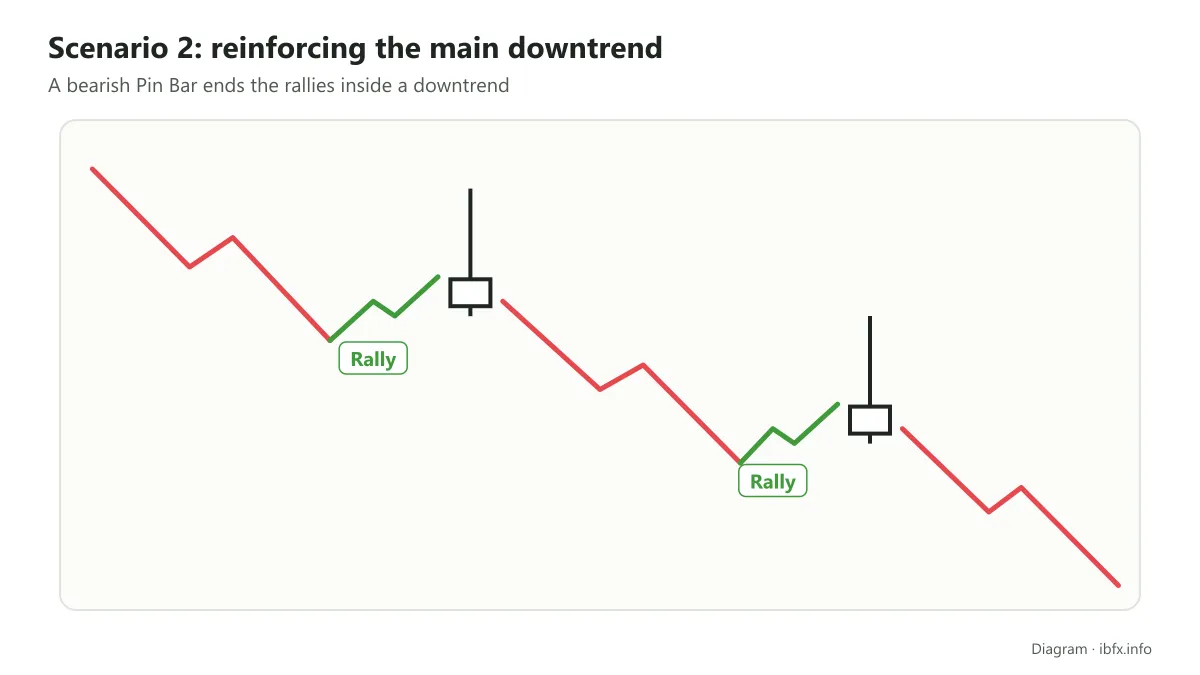
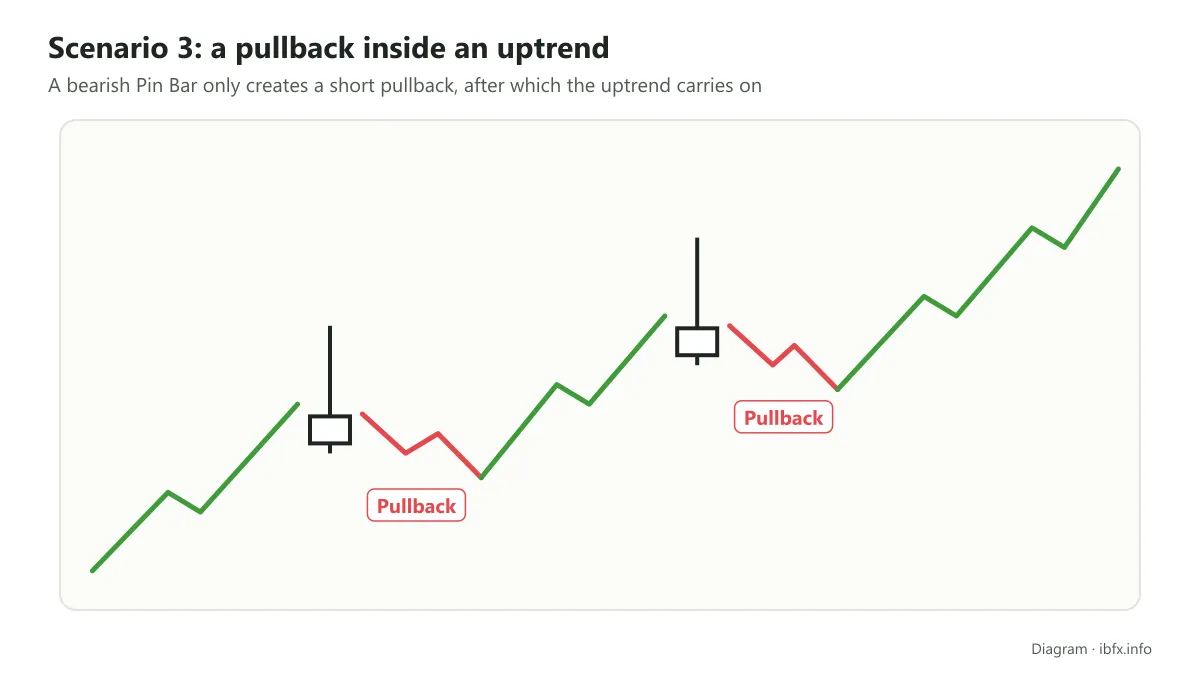
In the same way as the Bullish Reversal Pin Bar, the bearish reversal Pin Bar pattern can also show up in 3 different scenarios, each giving a reversal signal against the period before it, but the scale and the meaning of each reversal are different.
Scenario 1: the Bearish Reversal Pin Bar pattern reverses the main trend downward
Scenario 2: the Bearish Reversal Pin Bar pattern reinforces the main trend
Scenario 3: the Bearish Reversal Pin Bar pattern helps a pullback take shape within a rising market.
To sum up: traders can use the Pin Bar pattern in all 3 scenarios, which means you can trade the Pin Bar on many timeframes, from day trading through swing trading to position trading. That said, the smaller the timeframe (the ones used for scalping, for instance), the more noise there is in Pin Bar signals.
How to trade the Pin Bar pattern
The Pin Bar is a reversal pattern, so the direction to trade is very clear. A Bullish Reversal Pin Bar gives a signal to enter a Buy, and the other way round, a Bearish Reversal Pin Bar gives a signal to enter a Sell.
The trading strategy in detail is as follows:
Once you have worked out whether the Pin Bar pattern is a bullish or a bearish reversal (going by the trend before the Pin Bar showed up and the rough shape of the Pin Bar), check the marks of the Pin Bar more closely to confirm how reliable the pattern is.
One very important note when you trade the Pin Bar: the Pin Bar pattern only carries real weight when the long wick (the tail) of the Pin Bar runs well beyond the price range of the nearby candles before it. Only then does it show that the market is really rejecting the higher or the lower prices, and only then is the reversal signal more reliable.
- Enter a Buy as soon as the Bullish Reversal Pin Bar closes, and put the stop loss below the low of the Pin Bar.
- Enter a Sell as soon as the Bearish Reversal Pin Bar closes, and put the stop loss above the high of the Pin Bar.
- Work out the position size from the stop loss distance, because a long Pin Bar tail means a distant stop loss.
Although the way you enter is very simple, what matters is how you filter out the Pin Bars with a better chance of reversing. The signal a Pin Bar gives is not always 100% right. Reversal trading is hard, which is why new traders are wary of picking reversal strategies; most of the time they fall into the trap the market sets rather than call the trend correctly.
That is why, to trade the Pin Bar pattern better, you need to combine other tools and methods to confirm the reversal signal from the Pin Bar, such as Fibonacci and support and resistance price zones…
Examples of the Pin Bar pattern in the forex market
- Example 1: a Pin Bar pattern giving a signal that the main trend reverses
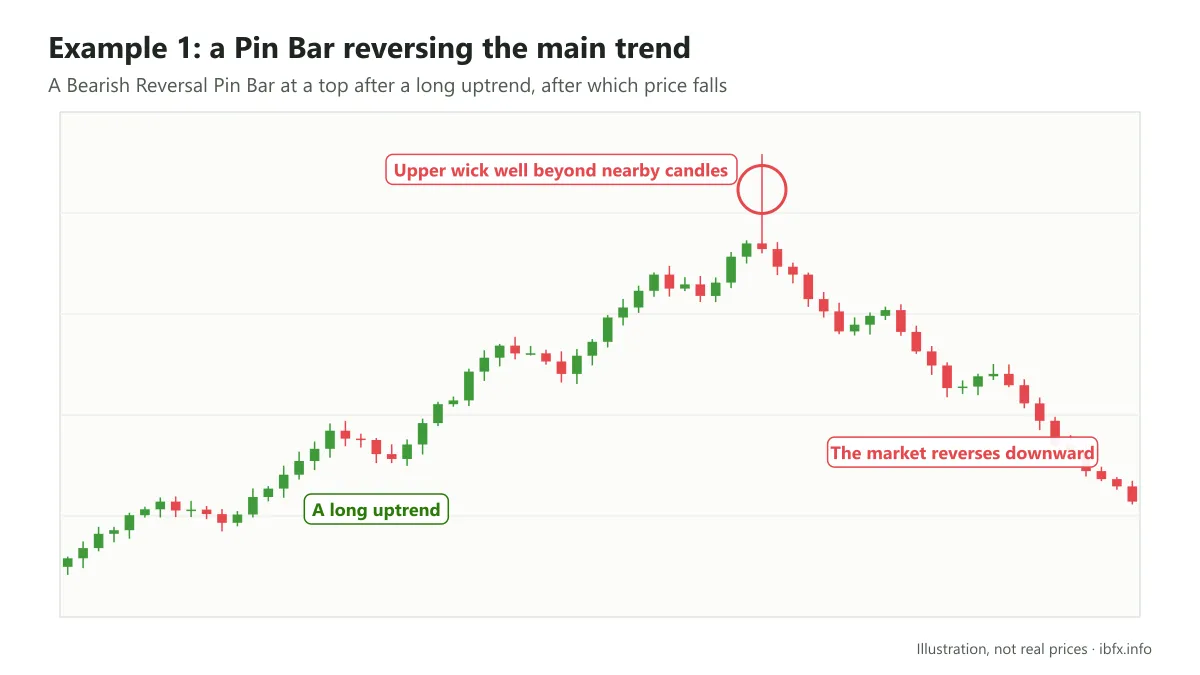
A Bearish Reversal Pin Bar shows up at the end of a long uptrend. This Pin Bar pattern meets all the conditions it needs, and in particular the wick runs well beyond the price range of the nearby candles. Right after it, the market reversed and fell for a long stretch.
- Example 2: a Pin Bar pattern giving a signal that reinforces the trend
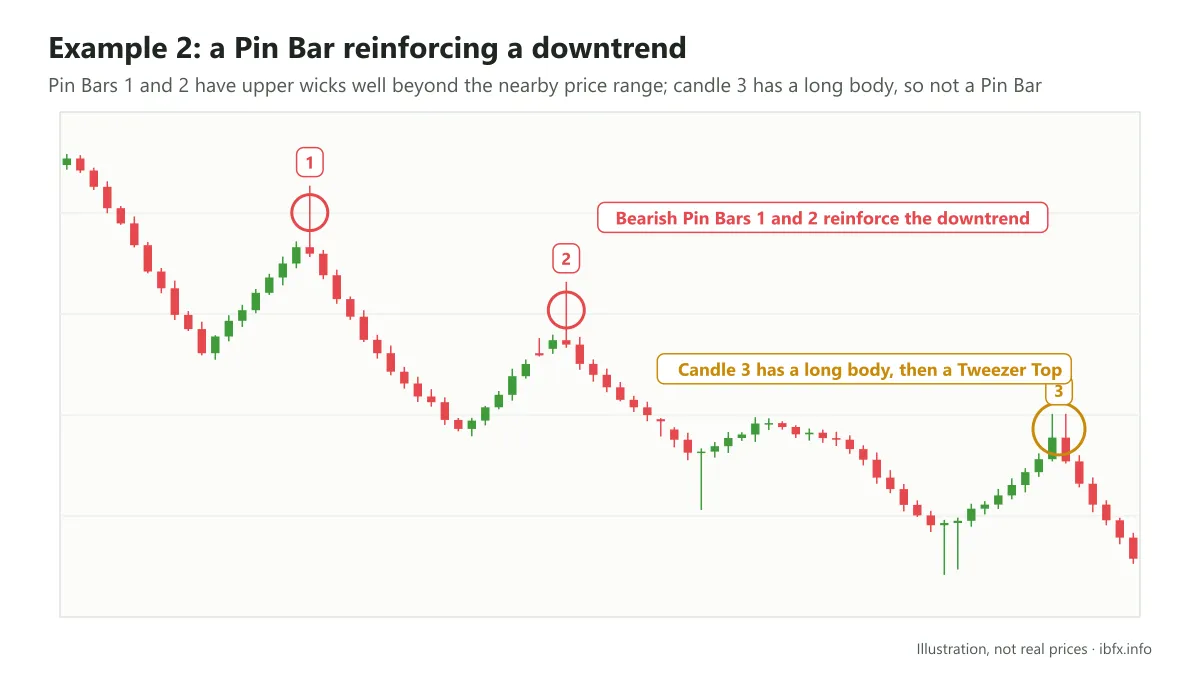
At positions (1) and (2), after the Bearish Reversal Pin Bar pattern shows up the market begins a run of falls that carries on the overall downtrend. The rises before them are simply rallies in the market.
Before Pin Bars (1) and (2) showed up, a few other Pin Bars appeared as well; the wicks of those Pin Bars, however, do not run well beyond the price range of the nearby candles, so they do not give a bearish reversal signal the way candles (1) and (2) do.
At position (3), a candle with a long upper wick shows up, but its body is fairly long too, close to 1/2 of the whole candle, so it cannot be confirmed as a Bearish Reversal Pin Bar pattern. Even so, the long upper wick still shows that sellers put a great deal of pressure on during that session; right after it the market went on to form a Tweezer Top, which confirmed the bearish reversal signal more strongly, and the result was that price fell. Had the Tweezer Top not shown up, price would not necessarily have fallen. That is why the marks of a Pin Bar matter so much in testing how reliable the signal the pattern gives really is.
- Example 3: a Pin Bar pattern helping a correction in the market take shape
The same situation of a market in a downtrend as in the example above, but here we look at the Bullish Reversal Pin Bar patterns that help rallies take shape within a falling market.
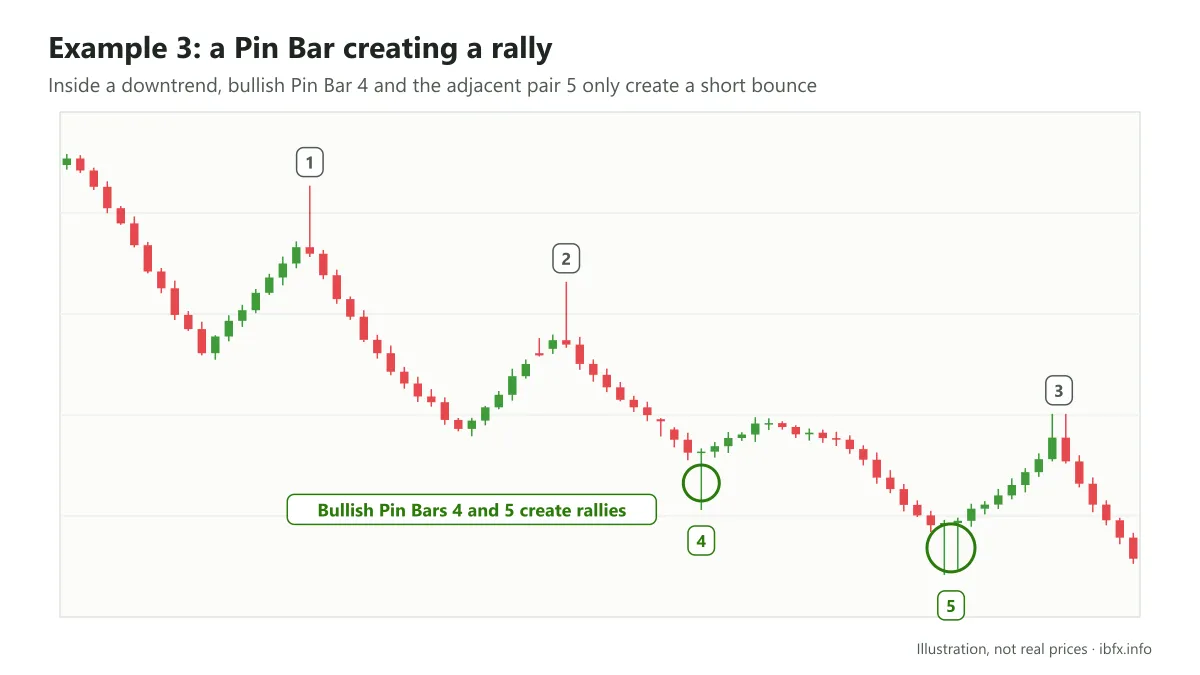
Look at the 2 positions (4) and (5).
At position (4), a Bullish Reversal Pin Bar shows up at the end of a stretch of downtrend and gives a signal that price will reverse upward. The result is that the market rose, but this is only a rally within the overall downtrend. Before it, a Bullish Reversal Pin Bar also appeared, but its wick stayed inside the nearby price range, so it did not give a reversal signal.
Position (5) is the same as position (4), but the 2 Pin Bars show up next to each other, so in this case the signal of a rally is confirmed more strongly.
Using other technical tools to confirm the reversal signal of the Pin Bar pattern
- Example 1: a Pin Bar pattern showing up at important Fibonacci retracement zones
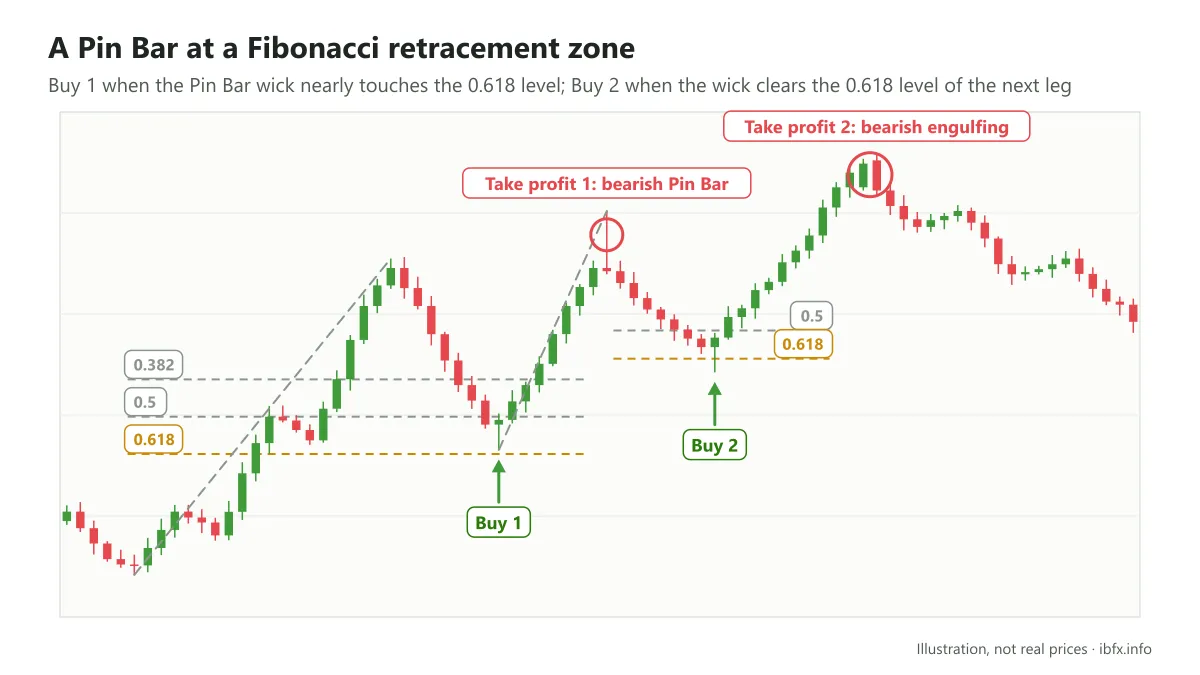
Buy 1: a Bullish Reversal Pin Bar shows up after a fall, and at the same time its lower wick nearly touches the FR 0.618 retracement level, which gives a strong bullish reversal signal. Place Buy 1 when the Pin Bar completes, with the stop loss below the low of the Pin Bar. Close the trade when it reaches your profit target or when a bearish reversal signal shows up. In this case a Bearish Reversal Pin Bar forms, and you can close the trade to take profit when that candle finishes.
Buy 2: this case is the same; after the fall, the market goes on to form a Bullish Reversal Pin Bar whose lower wick has cleared the FR 0.618 retracement level, which reinforces the bullish reversal signal, so place Buy 2 when the Pin Bar completes. In this case a Bearish Engulfing reversal pattern shows up and gives the signal to close the trade and take profit.
You can use Pin Bar patterns together with confirmation from other tools to find more trading opportunities, but every trade needs its own stop loss, and the examples above were picked once the outcome was already known.
- Example 2: a Pin Bar pattern showing up at a strong support or resistance zone
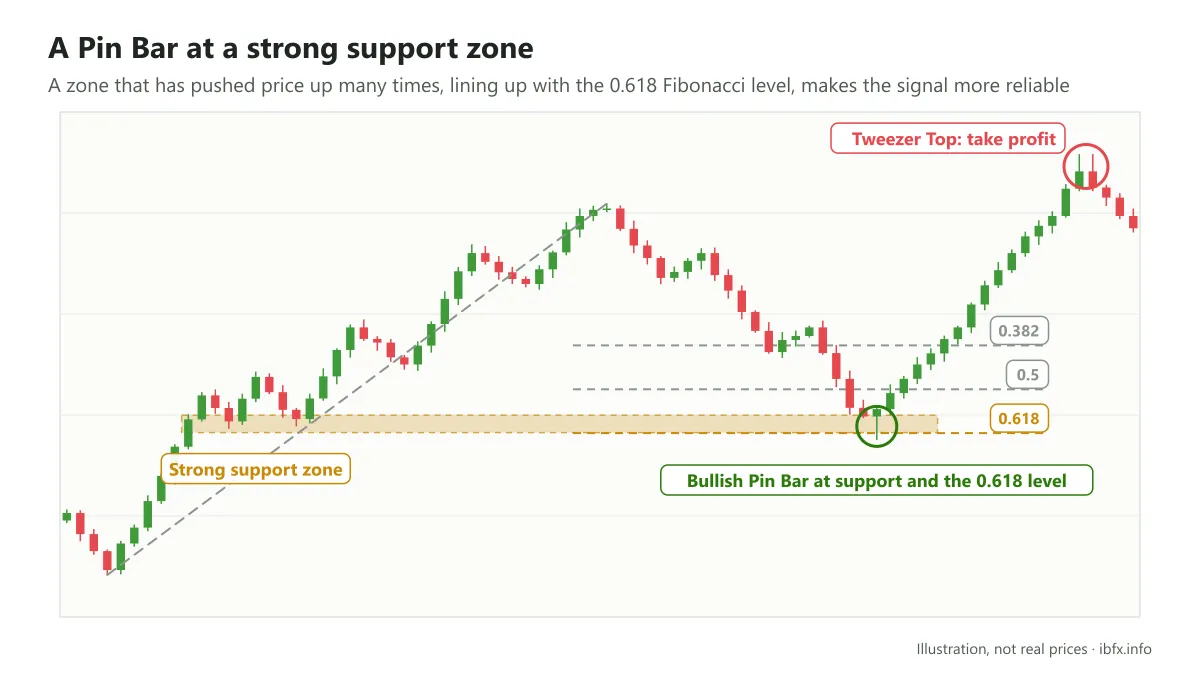
The Bullish Reversal Pin Bar pattern shows up at a strong support zone, because price had turned back up many times before when it touched this price zone; at the same time, when you apply Fibonacci Retracement to the long stretch of uptrend before it, this Pin Bar also lands at the FR 0.618 retracement level, which makes the signal that price will reverse upward even more reliable.
Place the Buy when the Pin Bar completes, and take profit when a reversal signal shows up, which in this situation is the bearish Tweezer Top reversal pattern.
- Example 3: confirming the Pin Bar reversal signal with a technical indicator
Technical indicators are useful tools for confirming the reversal signal of a Pin Bar too, and the overbought and oversold signals of RSI are a common way to confirm it.
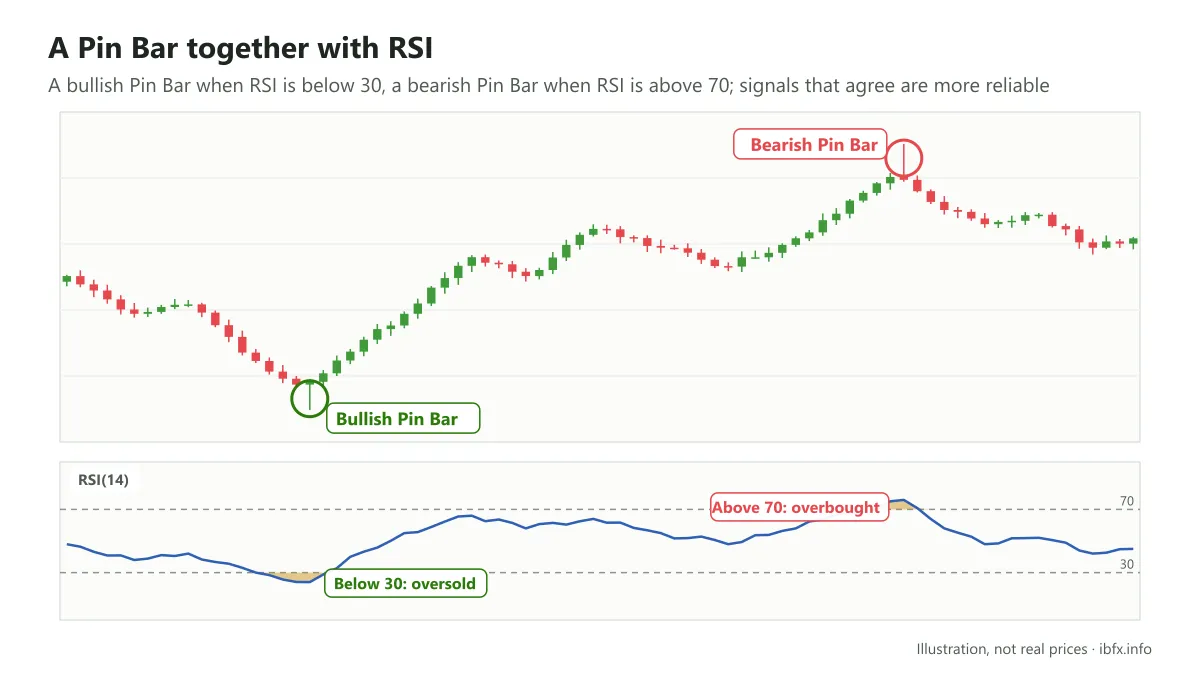
In the example above, first a Bullish Reversal Pin Bar pattern shows up, and at the same point the RSI indicator drops below 30 (the oversold zone), which makes the bullish reversal signal of the Pin Bar more reliable. In this example the market reversed upward right after.
In the same way, when a Bearish Reversal Pin Bar pattern shows up and RSI rises above 70 (the overbought zone), the bearish reversal signal is reinforced.
How to trade the Pin Bar pattern with pending orders
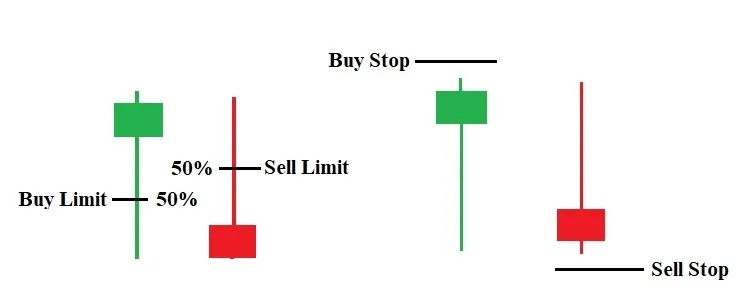
With a Limit order, the traders who use it hold that after the Pin Bar forms, price tends to come back part of the way before carrying on in the direction of the pattern. The Limit order goes at about 50% of the length of the tail (the long wick). Placing the order this way gives a better entry price and a nearer stop loss than a market order does (entering when the Pin Bar finishes, at an entry price equal to the close of the Pin Bar), but in return the order may not fill if price does not come back.
The other way round, with a Stop order, traders hold that after the Pin Bar forms, if price has not cleared a certain level the market will not go in the direction of the pattern. The Stop order goes above the high of a Bullish Reversal Pin Bar or below the low of a Bearish Reversal Pin Bar. Placing the order this way brings less profit than a market order, but it is also a way of being more certain about the reversal the Pin Bar points to.
Final thoughts
The Pin Bar is a reversal candlestick pattern favored by most traders of price action analysis. Understanding what it means in market terms will help you make better sense of every situation in which a Pin Bar shows up. Like every other trading method, the Pin Bar is not a holy grail either, and the reversal signal from a Pin Bar is not always right. What matters is that each trader picks the analysis tools that suit them and uses them alongside the Pin Bar to confirm the reversal signal more firmly; and to do that you have to practice a great deal on a demo account, build up your own experience, always place a stop loss and never stop learning.