On this page
Among the reversal candlestick patterns, the Evening Star cannot be left out: a bearish reversal signal that a great many traders watch. So what is the Evening Star pattern, and how do you trade with it? Read on through the article below.
What is the Evening Star pattern?
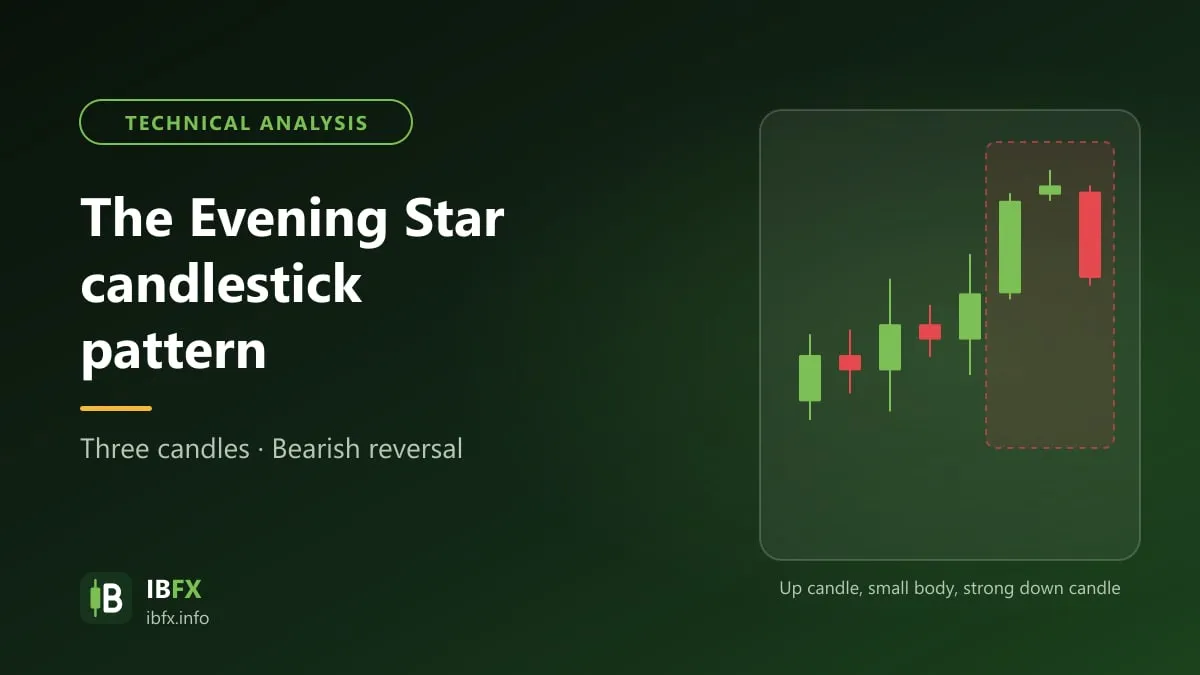
The Evening Star is one of those patterns built from 3 candles rather than the 1 or 2 candles of many of the Japanese candlestick patterns you already know. Its make-up is 1 large BULLISH candle, 1 small candle (which can be bearish or bullish, the color of the candle not mattering) and 1 large BEARISH candle.
The Evening Star is a bearish reversal pattern, and it usually happens at the top of an uptrend in price. The Evening Star pattern is quite like the Abandoned Baby pattern at a top, or you could call it the next version of the Bearish Harami pattern we have written about before.
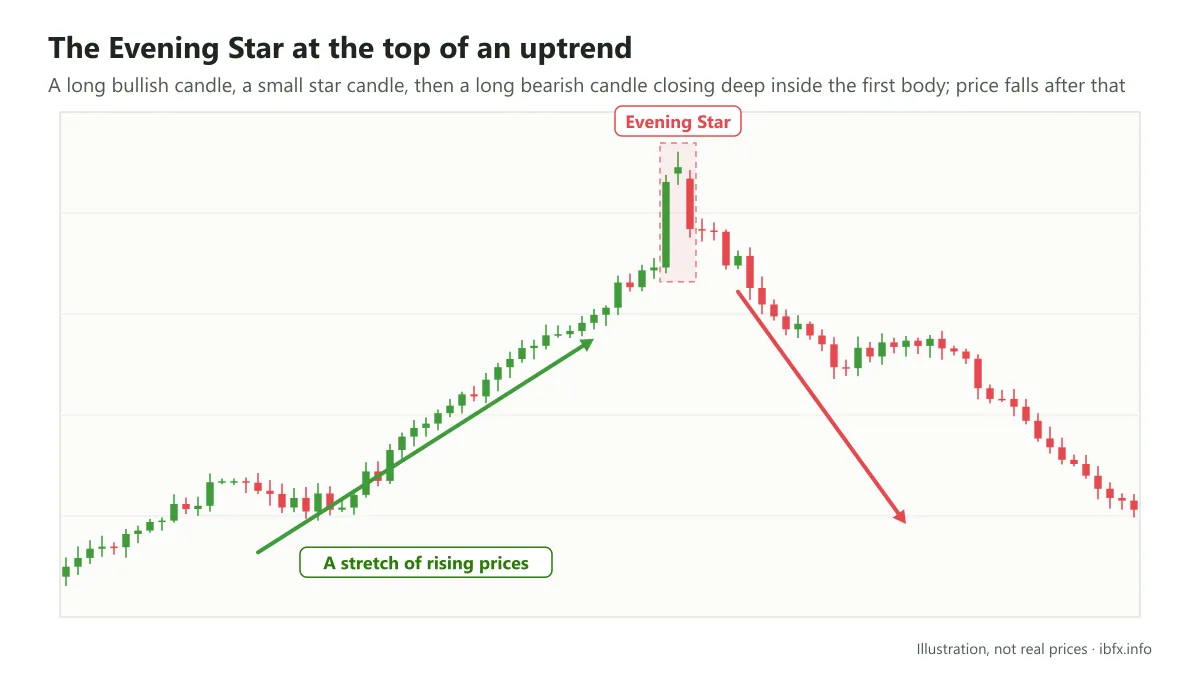
What marks out the Evening Star pattern
It takes its name from that very star: after a day of bright, brilliant sunshine, the moment the small stars begin to appear is also the moment that tells you thick night is about to fall.
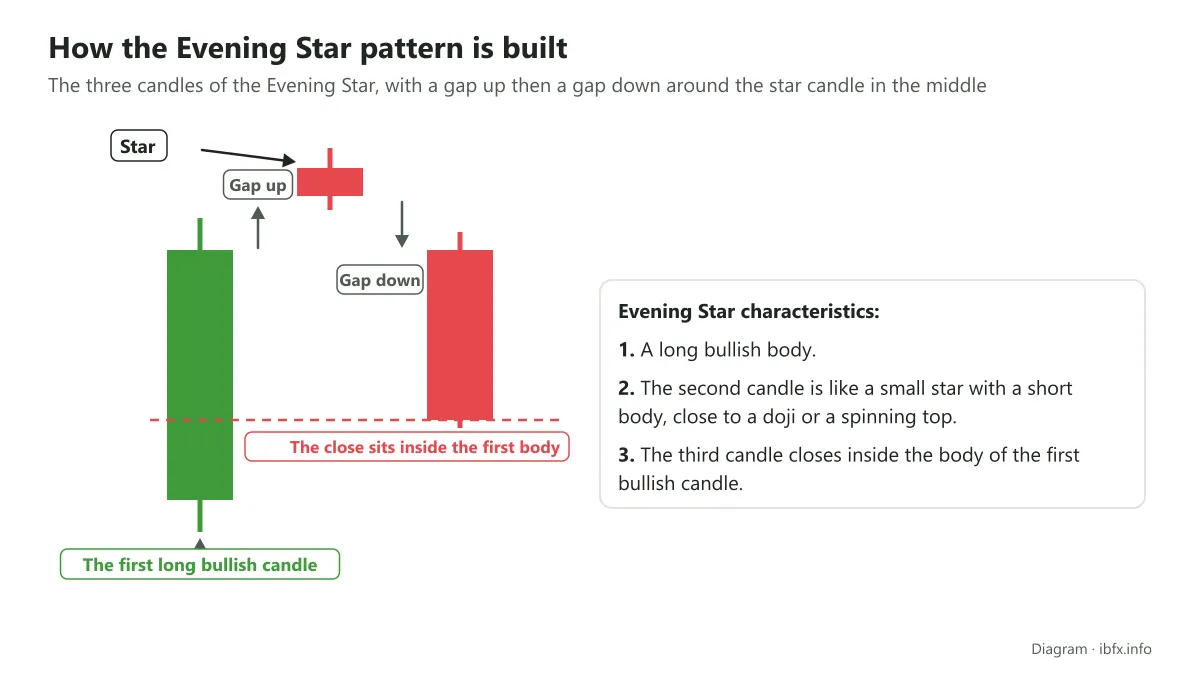
So, looking at the Evening Star pattern, you can make out the following marks:
Candle 1: has to be a large bullish candle.
Candle 2: is usually a small candle, much like a Doji or a Spinning Top, which the Japanese likened to a star. It is this candle, with its short body, or all but no body at all in the manner of a Doji, that reins in the buyers’ drive and leaves buyers and sellers close to level with each other.
Candle 3: is a large bearish candle that closes deep inside the body of the first candle, usually below the midpoint of the body of that first bullish candle. Which shows that sellers are looking for every way to take over and seize control, once the second candle before it has brought the 2 sides level.
There are a few other points to note about the Evening Star pattern as well:
- The longer the first and the third candle, the clearer the reversal signal.
- If there is a gap between the first candle and the second, or between the second candle and the third, the signal is reinforced (in forex a gap between candles is very rare).
- The deeper the third candle falls into the body of the first, the clearer the reversal signal.
- With the Evening Star pattern, pay more attention to the body of the candles than to the wicks.
How to find an entry with the Evening Star pattern
To trade with the Evening Star pattern you should be patient and wait for the pattern to form. That means you can look for your ENTRY just below the third candle, once that candle has formed, and put the stop loss a small distance above the highest point of the pattern (usually the upper wick of the second candle). Work out your position size from the stop loss distance.
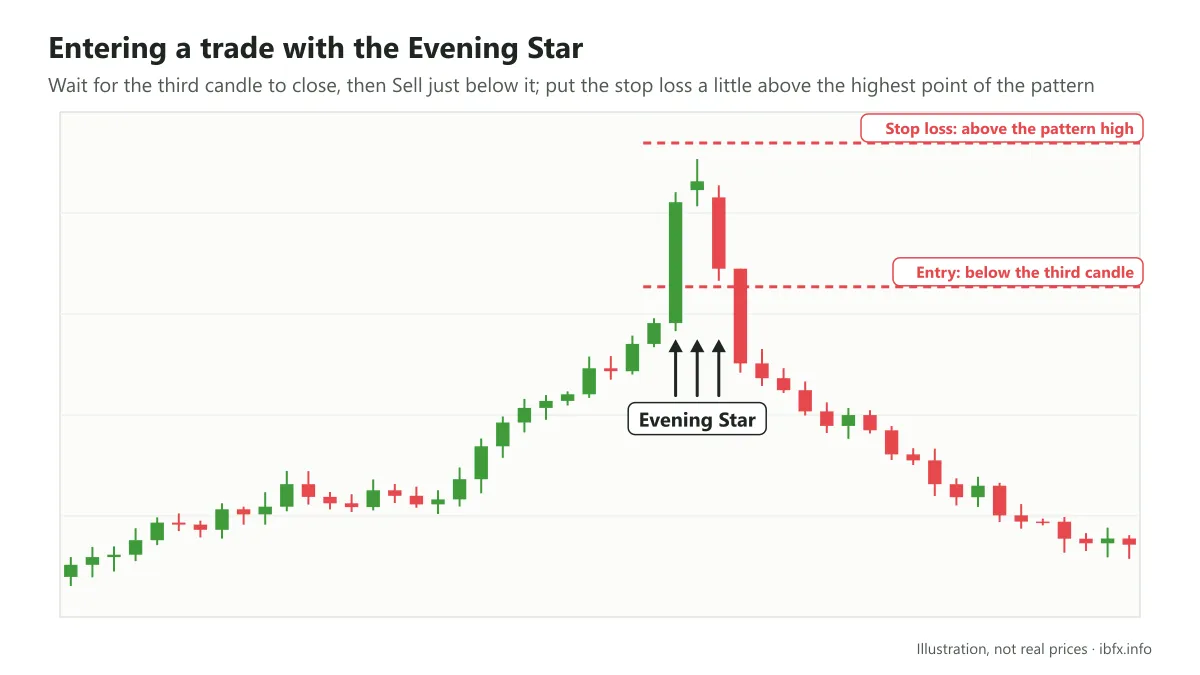
A point to keep in mind: while you trade, a few situations will come up, such as the third candle nearly engulfing both the first and the second candle. A case like that is usually treated as a stronger reversal signal, as in the picture below:
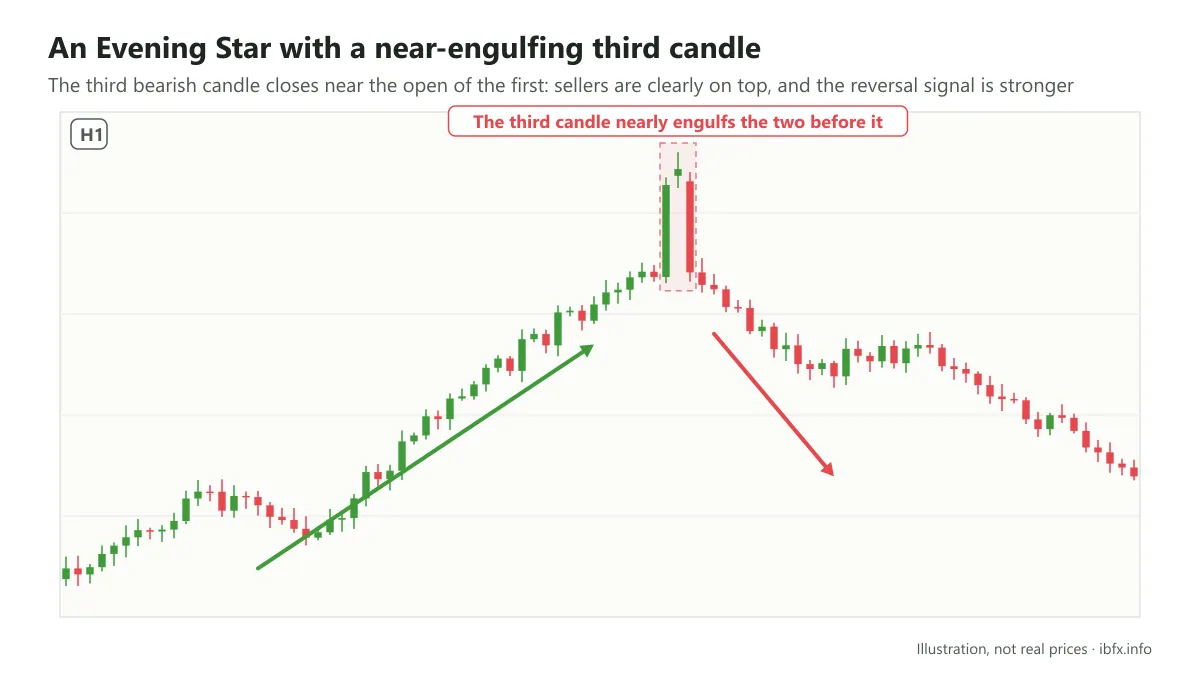
If, on the other hand, you get the case where the third candle does not engulf the 2 candles before it and has a body of only moderate length, the risk is fairly high. As we said above, this third candle is the candle that settles the sellers’ hold over the buyers. If the body of the third candle is short, it shows that sellers are not really all that strong, and you can watch for one more signal, whether the fourth candle is a candle that rejects the buying, before you enter, which is safer.
An example of the Evening Star
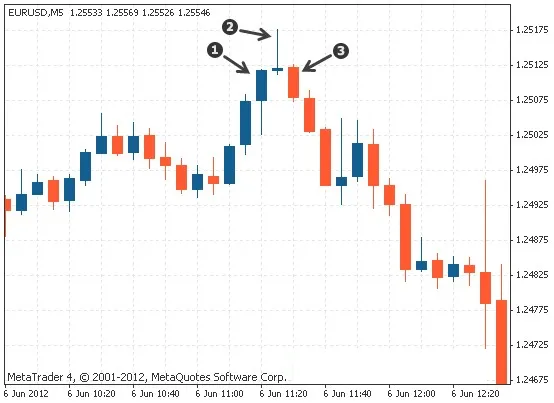
On EURUSD on the M5 timeframe, as you can see, the group of candle 1, candle 2 and candle 3 that we numbered so you can pick them out easily is precisely the Evening Star pattern, is it not? In practice, the length of the third candle did not engulf green candle number 1, but with a length beyond 50% of candle number 1 you can see that this is a reversal signal worth noting all the same. In this example, even on nothing more than the M5 timeframe, EUR/USD then fell more than 40 pips; that said, the pattern does not turn out that way every time.
Things to keep in mind when you use the Evening Star pattern
So the Evening Star is a useful reversal pattern, but it only means something when it happens after an uptrend in price.
You should wait for the pattern to form before you start trading. The second candle in this pattern has to have a small body (a Doji, or a small bullish or bearish candle, either will do). As for the third candle in the Evening Star pattern, its body needs to be close to the size of the bullish candle. Or, better still, the third candle is long enough to engulf the first 2 candles, which is a stronger bearish signal, though you still have to place a stop loss because no signal is a certainty.
To trade it better, even Steve Nison, the well-known author on Japanese candlesticks, advises combining it with other tools (the trend, resistance, indicators) rather than using the Evening Star pattern on its own. See also: An introduction to candlestick patterns in price action.