On this page
To trade with steady results, a trader needs at least 3 skills:
- Reading the chart
- Following the news
- Managing risk (position size, stop loss)
For someone starting out, these skills are not hard to get to know, but they take a great deal of practice to master.
In this article we will focus on the skill of reading a chart with the price action method, and you will come to understand how to read a Japanese candlestick chart. Candlestick patterns are one of the most common ways of reading a chart. Many traders read nothing but the candles and use no technical indicator at all, though neither way assures a profit. Naturally, you still have to put in plenty of study to become fluent in using candlestick patterns in your trading.
What is a Japanese candlestick?
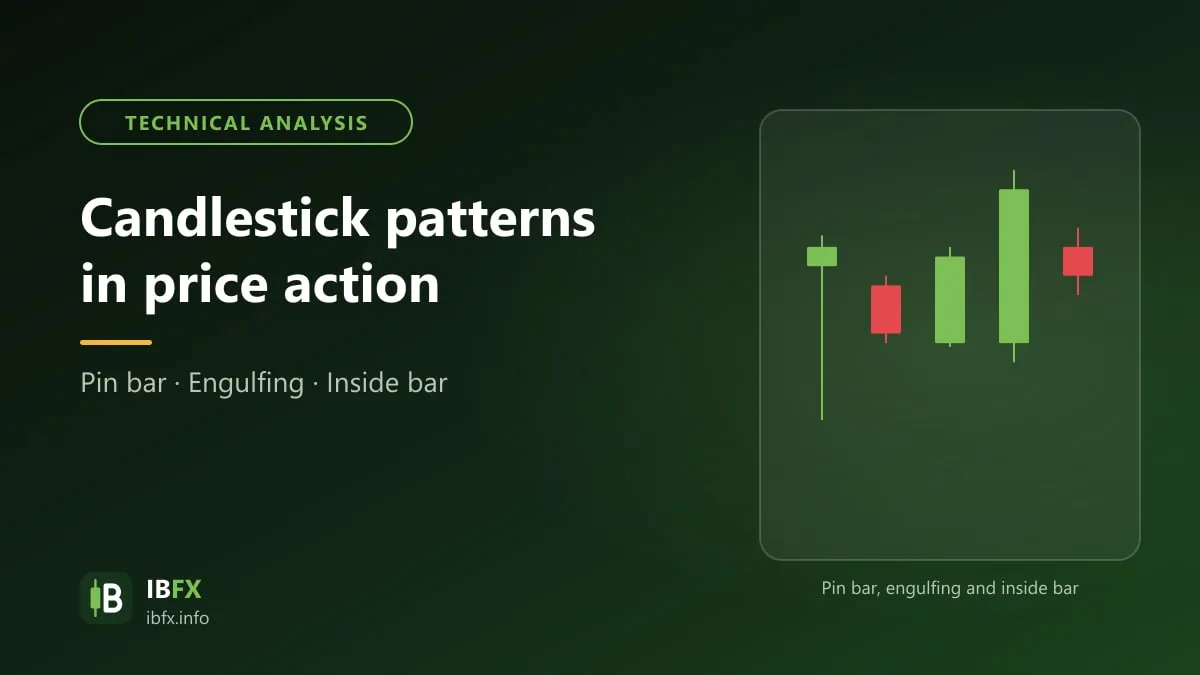
A Japanese candlestick is built from a vertical rectangle (called the body) with lines below and above it (called the wick). The width of the rectangle is always the same — it stands for one time period on the chart. On a BTCUSD M1 (1-minute) chart, for example, each candle stands for 1 minute.
The two ends of the body are the open and the close within that time period. A red candle shows that the close is lower than the open (price fell), and the other way round, a green candle shows that the close is higher than the open (price rose). The colors can change depending on how the software is set up.
For example, a green candle on the BTCUSD M1 chart at 16:05 with an open of 3403 and a close of 3408 means price rose during that minute.
The wicks tell you the high and the low of the candle. A green candle with no upper wick means the high is the same as the close; a green candle with no lower wick means the low is the same as the open.
Japanese candlesticks suit watching the turning points of the market very well. Some candlestick patterns signal a possible reversal, and some signal that the trend may carry on.
Depending on the trend before them, you may see bullish or bearish reversal signals. Bearish patterns are a signal that the market may fall and bullish patterns are a signal that the market may rise; no pattern is a certainty.
The Bullish Engulfing pattern
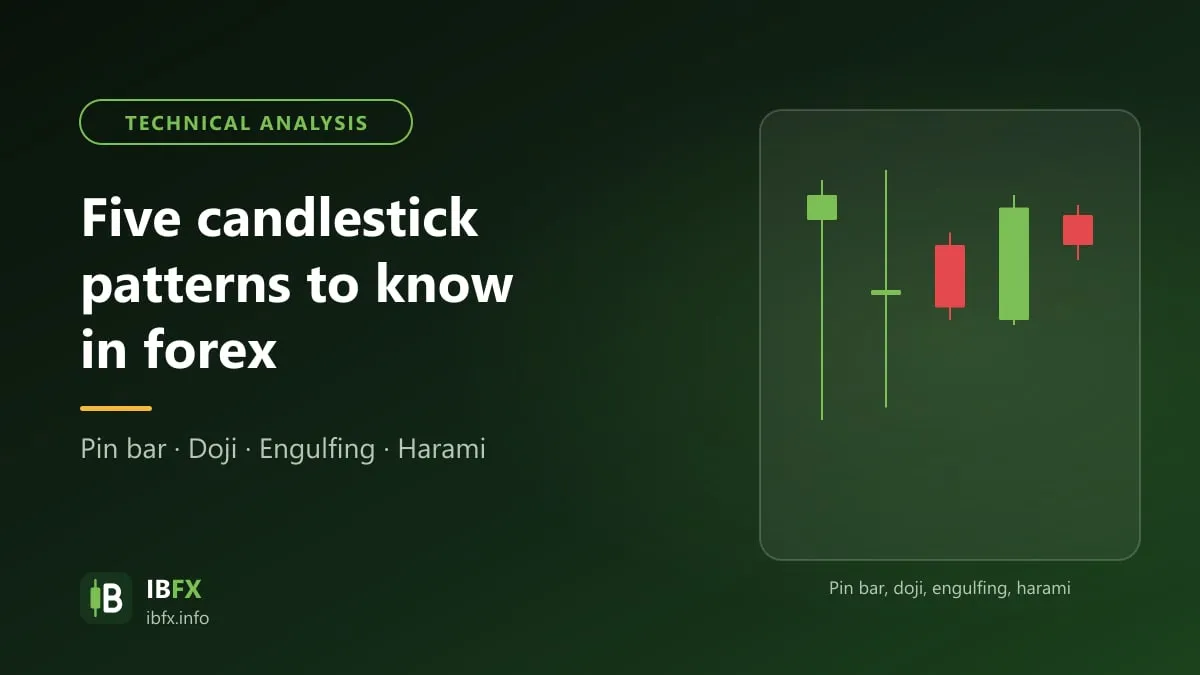
The Bullish Engulfing pattern usually shows up after a fall in price, and it takes shape when the body of a green candle completely covers the body of the red candle before it.
The Bearish Engulfing pattern
In the same way as the Bullish Engulfing, the Bearish Engulfing pattern usually shows up after a rise in price, and it is formed by a bearish candle whose body engulfs the body of the bullish candle before it.
The Hammer candle
This candle shape is easy to spot. The Hammer candle has a short body sitting up at the top, a long lower wick (usually at least 2 times the body) and almost no upper wick, and it shows up after a fall in price.
When a Hammer candle forms after a fairly long downtrend, that is a sign the market may reverse upward.
The Morning Star pattern
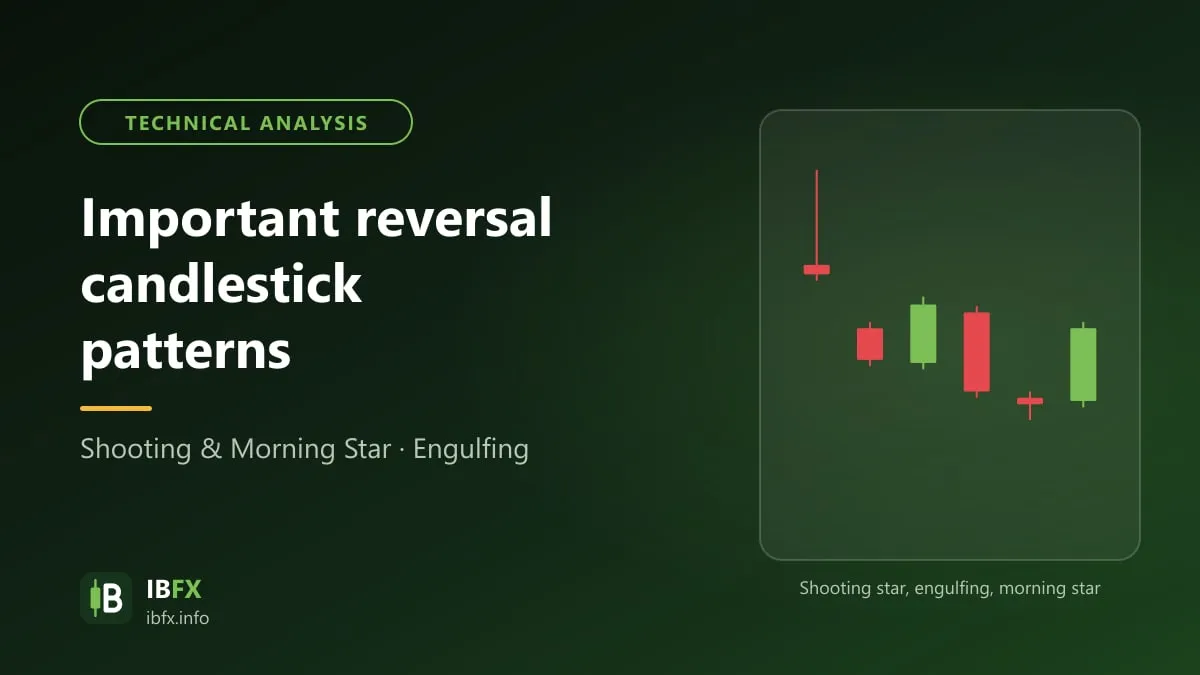
The Morning Star is a pattern of 3 candles that shows up after a fall in price: the first candle is a long-bodied bearish candle; the second has a very small body (it can be bullish or bearish, and is called the “star”), which shows that selling pressure has stalled; the third is a long-bodied bullish candle that closes deep inside the body of the first.
The reversal signal of the Morning Star pattern is held to be stronger if the third green candle is long and comes with large volume. That candle shows that strong buying has appeared after the “star” candle. When you trade this pattern, the stop loss usually goes below the lowest low of the pattern.
The Dark Cloud Cover pattern
The Dark Cloud Cover is a pattern of 2 candles that shows up after a rise in price: a long-bodied green candle is followed by a red candle that opens above the close of the green candle but closes below the midpoint of the green candle’s body. You should wait for the next candle to confirm before you consider a sell position, with the stop loss above the high of the pattern.
The Dark Cloud Cover pattern shows buying pressure weakening and selling pressure growing strong.
The Shooting Star pattern
The Shooting Star is a candle with a short body sitting down at the bottom and a long upper wick, and it shows up after a rise in price. This pattern is a signal that the market may reverse downward; you should wait for a confirming candle and put the stop loss above the top of the wick.
Candlestick patterns are fairly easy to understand in theory. Even so, it takes time before your trades come out in profit. Practicing on a demo account while you have not yet got the method straight is absolutely necessary. Only once you have steady results on a demo account over a long enough stretch should you move to real money, starting with a small amount, because real trading also brings psychological pressure, slippage and costs.
See also: The important reversal candlestick patterns to know.