On this page
Fibonacci is one of the tools traders know best in the financial markets in general and in forex in particular. The tool has been developed into a great many different forms. Let us look more closely at the Fibonacci sequence and at how it is used in trading, through the article below.
Not sure what forex is? Start here:
- What is forex?
- A full guide to forex investing for beginners
- How to choose a safe forex broker.
Who discovered the Fibonacci sequence?
Leonardo Pisano Bogollo (about 1170–1250), an Italian mathematician, was the one who brought this sequence to Europe. The name Fibonacci comes from “filius Bonacci”, meaning “the son of Bonacci”; the name “Fibonacci sequence” was given by the French mathematician Édouard Lucas in the 19th century.
His father ran a trading post attached to a port in North Africa (Bugia, in what is now Algeria), so he went there to live and to help his father with the work. It was there that Fibonacci saw that the Hindu-Arabic numerals were simpler than Roman numerals, so he traveled around the Mediterranean to learn more from the leading Arab mathematicians. Then, at the age of 32, he brought out the book Liber Abaci (the Book of Calculation), and it is in that same book that he sets out a problem about rabbits whose solution is a run of numbers that we now call the Fibonacci sequence.
In fact, Indian mathematicians had known the Fibonacci sequence for centuries before that, but it was only when he presented it again in Liber Abaci that the sequence became known in the West and famous down to this day.
What the Fibonacci sequence is
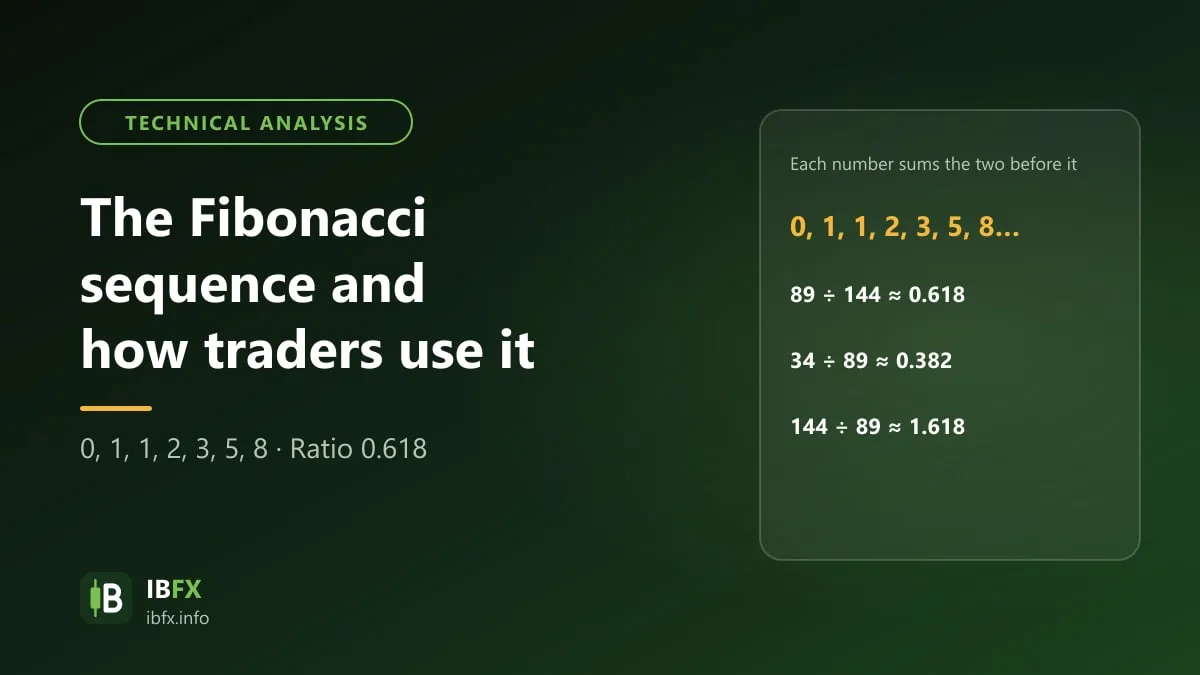
It is an infinite sequence of numbers that starts with 0 and 1, where every number after that is always the sum of the 2 numbers right before it.
So the Fibonacci sequence runs: 0, 1, 1, 2, 3, 5, 8, 13, 21, 34, 55, 89, 144, 233, 377, 610…
The sequence is closely tied to the golden ratio, written with the Greek letter phi (φ ≈ 1.618). The golden ratio was described by ancient Greek mathematicians such as Euclid long before Fibonacci’s time.
A few interesting features of the Fibonacci sequence
- The further along you go, the closer the ratio of one number to the number right after it gets to 0.618; for example: 3/5 = 0.6; 5/8 = 0.625; 8/13 ≈ 0.615…
- The ratio of one number to the number right before it is about 1.618 (the reciprocal of 0.618); for example: 8/5 = 1.6; 13/8 = 1.625; 21/13 ≈ 1.615…
- The ratio between numbers one place apart also gets closer to 2.618, or to its reciprocal 0.382, the further along you go; for example: 3/8 = 0.375; 8/21 ≈ 0.381; 55/21 ≈ 2.619
Notice too that the ratios that come out of the Fibonacci sequence, such as 1.618, 2.618 and 0.382, are all used as retracement or extension levels for taking profit or getting out of a trade in forex.
What the golden ratio is
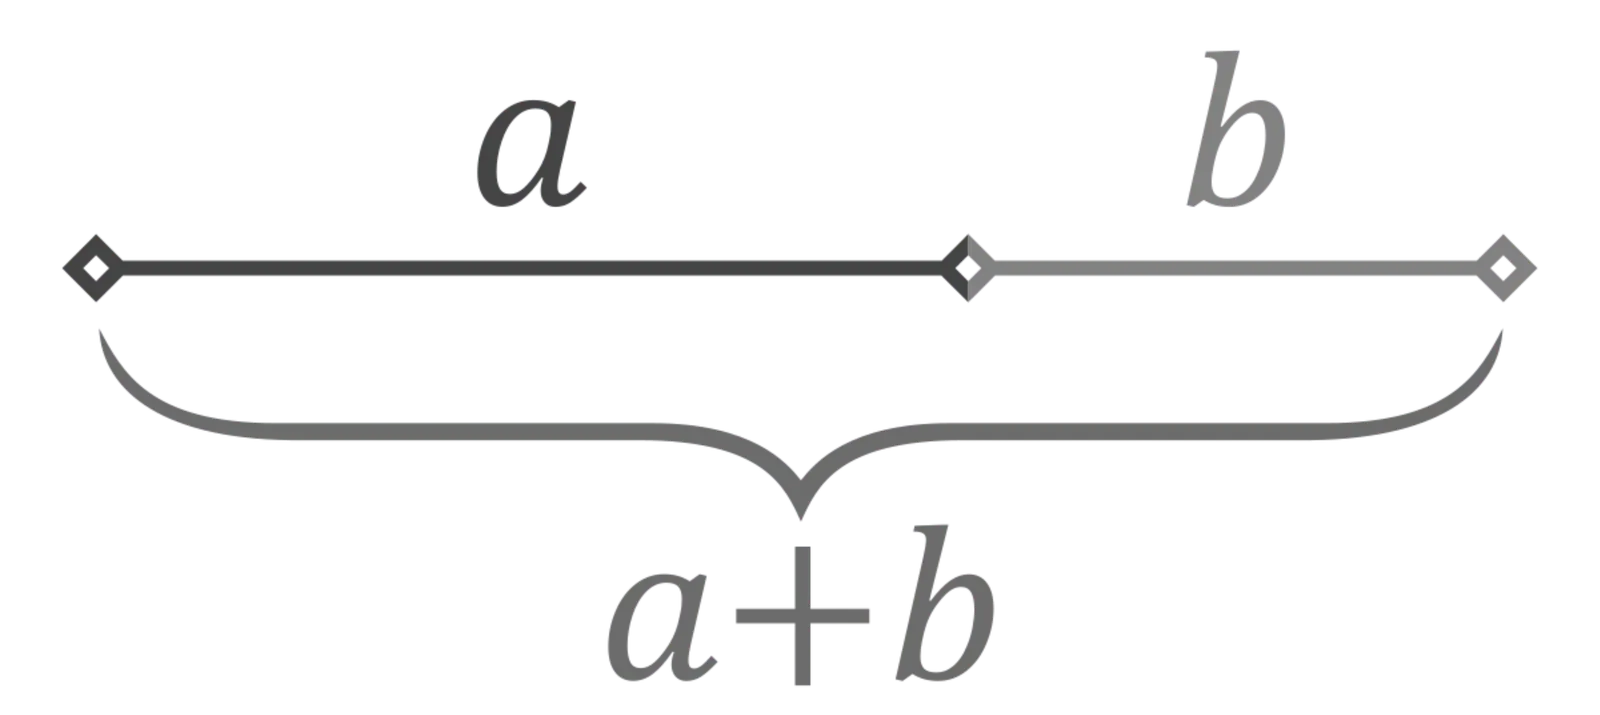
The golden ratio is “the ratio you get when you split a line into two parts so that the ratio of the whole line to the longer part equals the ratio of the longer part to the shorter part”, a value of about 1.61803.
So how does the golden ratio relate to the Fibonacci sequence?
It is an interesting piece of mathematics: in the Fibonacci sequence, the ratio of one number to the number right before it gets closer to 1.61803 the further along you go.
For example: 3/2 = 1.5; 5/3 ≈ 1.67; 8/5 = 1.6; 13/8 = 1.625…
And the larger the numbers in the Fibonacci sequence get, the closer the ratio comes to the golden ratio.
The golden ratio often comes up in painting and architecture because many people hold that it creates balance and harmony (though a lot of the popular examples online are overstated).
Many people also hold that human proportions close to the golden ratio look balanced, though that is a matter of taste more than a law of science.
Fibonacci himself, one of the ablest mathematicians in medieval Europe, probably never expected the run of numbers in his rabbit problem to be used and talked about in so many fields.
The Fibonacci sequence shows up in quite a few places in nature, such as the way the seeds are arranged in a sunflower head, or the petals of a flower (have you ever noticed that many flowers have 3, 5, 8, 13, 21, 34, 55 or 89 petals? Every one of those numbers is in the Fibonacci sequence).
Many spirals in nature, such as snail shells or the arms of galaxies, are often compared to the golden spiral, though most of them are only close to it rather than an exact match.
Because they show up in so many places, the Fibonacci ratios are trusted by many traders. In the financial markets, though, the Fibonacci levels work mainly because a great many people are watching them and placing orders around them, not because price has to follow a law of nature.
How many kinds of Fibonacci are there in forex trading?
If you use TradingView you will find about 10 different Fibonacci tools, such as Fib Retracement, Trend-Based Fib Extension, Fib Speed Resistance Fan, Fib Time Zone and so on.
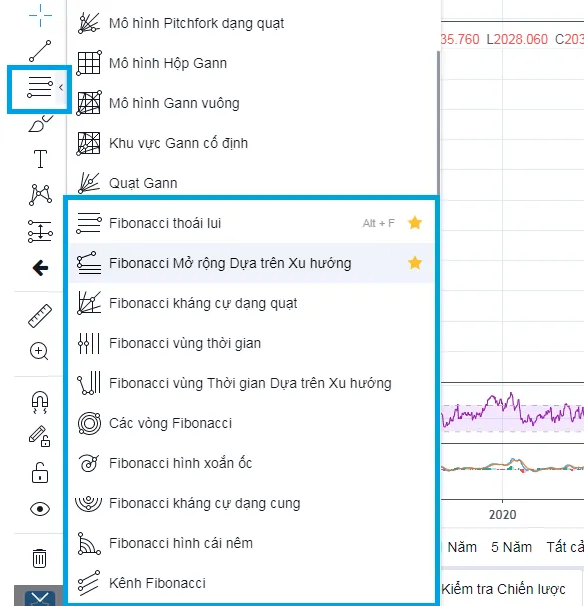
The screenshot shows the Vietnamese-language interface; the buttons and labels sit in the same places in the English one.
Basically these tools all rest on the same Fibonacci ratios, so you do not need to know all 10 of the forms above; you only need to focus on 2 of them: Fibonacci retracement and trend-based Fibonacci extension.
How the Fibonacci sequence is used in forex
Besides using the Fibonacci tools on their own, Elliott wave theory also uses many Fibonacci ratios to estimate how far the waves run.
On top of that, the Harmonic patterns are built on the Fibonacci sequence as well.
In forex trading in particular, the ratios we use are: 0 – 0.236 – 0.382 – 0.5 – 0.618 – 0.764 – 1 – 1.618 – 2.618 – 3.618.
The ratios from 0 to 1 in that list pair up symmetrically, and each pair adds up to 1 (many platforms use 0.786 in place of 0.764). For example: 0.236 + 0.764 = 1, or 0.382 + 0.618 = 1.
As said above, you only need to care about 2 kinds of Fibonacci: Fibonacci retracement and Fibonacci extension, also called trend-based Fibonacci extension. For these 2 forms the ratios are used as follows:
Fibonacci retracement: here you mostly use the ratios 0 – 0.236 – 0.382 – 0.5 – 0.618 – 0.764 – 1.
At bottom, Fibonacci retracement is nothing more than support and resistance lines spaced out by the Fibonacci ratios, and among them the 0.382, 0.5 and 0.618 levels are the most common retracement levels. In a market with a strong long-term trend, price usually retraces only shallowly, to around the 0.382 level (38.2%); in a weaker trend, price can retrace as deep as 0.618 or further.
Within that, the 50% level (not a Fibonacci ratio, but one that most traders watch) acts as a kind of dividing line: when price corrects deeply past it, the trend may be weakening, and you need to think twice about entering or getting out. Read the full guide: how to use Fibonacci retracement to find an entry.
With trend-based Fibonacci extension you will mostly use the ratios 0.618 – 0.764 – 1 – 1.618 – 2.618 – 3.618.
Why these levels? Because price in a market sometimes falls very deep, or rises very hard — in 2020, for instance, when gold passed the all-time high set back in 2011 (and then went on making new highs, passing 3,000 USD/ounce in 2025). Once price is in a zone that has never traded before, the question is how far price can go.
This is where trend-based Fibonacci extension is the tool for estimating the price levels that gold, or any other instrument, may reach, to serve as reference targets for taking profit. Read more: how to use Fibonacci extension to take profit.
Note too that it is not only TradingView: MT4 has the Fibonacci drawing tools built in as well, so all you have to do is understand clearly how to use them. You do not have to memorize the ratios above or work out how they are calculated.
But however common it is, Fibonacci is no assurance that every trade will be a winner.
You need to combine Fibonacci with reversal candlestick patterns, with trendlines and above all with identifying the trend correctly, to use the tool better. You should also follow the important news through the economic calendar on Forex Factory, always place a stop loss, and practice on a demo account first.