On this page
The Inside Bar, the Fakey and the Pin Bar are probably the candle patterns traders mention most. Many people even hold that, if you trade the Price Action school, being fluent with these 3 patterns alone is enough to trade without any complicated indicator or EA, though that is no assurance of profit.
Compared with the Fakey and the Pin Bar, the Inside Bar has more variations and is harder to use, so traders sometimes get caught by a false signal. So what is an Inside Bar? How do you use the Inside Bar pattern? Follow the article below to get a clearer picture of the Inside Bar pattern.
What is an Inside Bar?
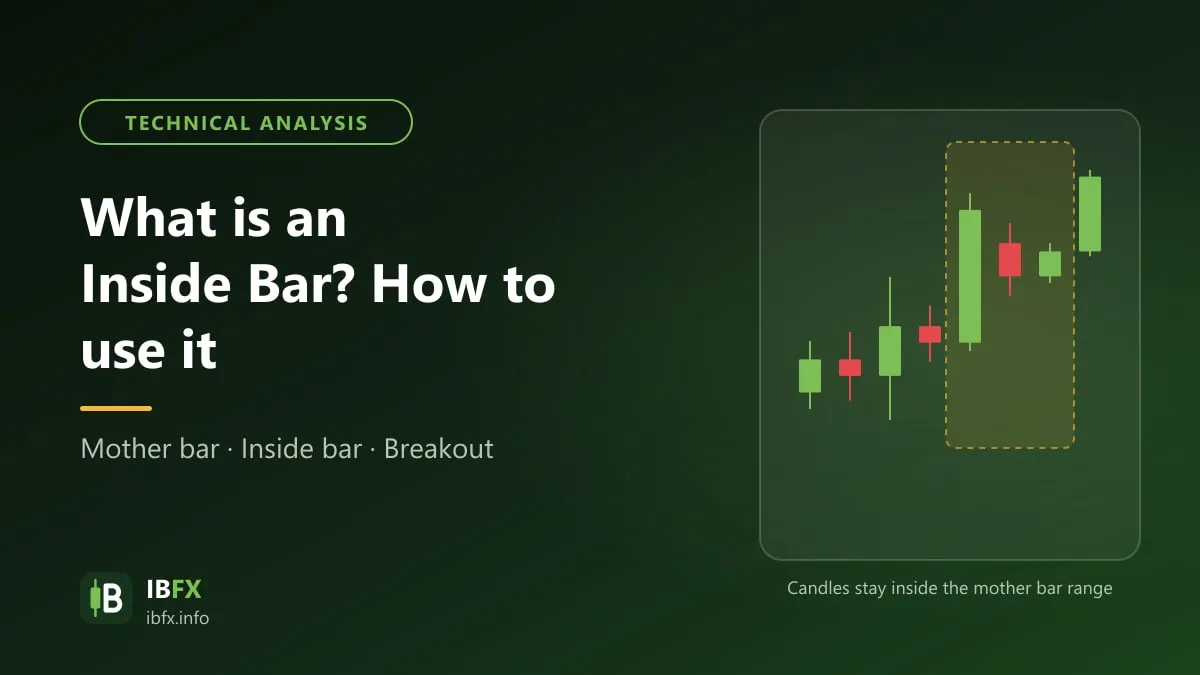
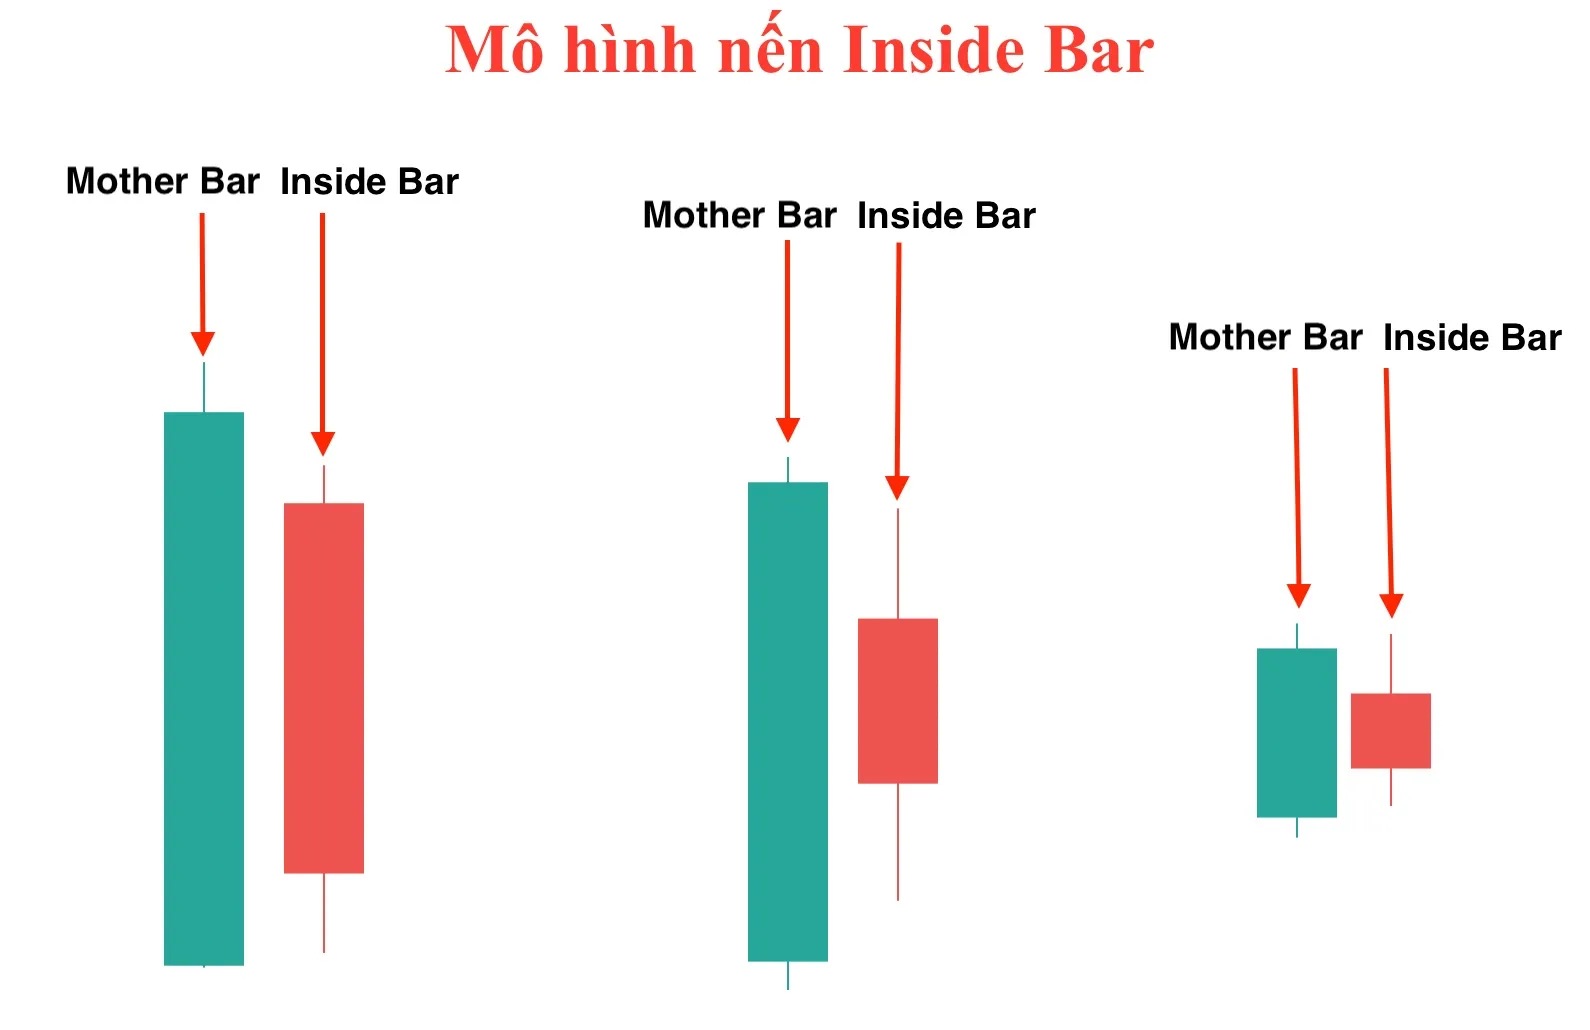
In English “inside” means within, so this is a 2-candle pattern built in the shape of “a candle inside a candle”: the whole range (from high to low) of the first candle covers the second candle completely, rather like a mother carrying a child.
The screenshot shows the Vietnamese interface; the buttons and labels sit in the same places in the English version.
The Inside Bar is a pattern that cuts both ways: it can warn that one trend is about to end and a new one is about to start, or it can show the previous trend carrying on.
What marks out an Inside Bar candle
Because of what the name means, traders call the first candle of the Inside Bar group the Mother Bar, and the other one, the second candle, the Inside Bar.
To qualify as an Inside Bar, the second candle must have a low higher than (or equal to) and a high lower than (or equal to) the Mother Bar standing in front of it.
That means the second candle has to sit entirely within the first one, both the wick and the body.
Besides that, with the Harami pattern of the classic Japanese candles (which is close to the Inside Bar), the two candles usually have OPPOSITE COLORS: if the mother candle is green (a bullish candle) then the baby candle is red (a bearish candle), and the other way round.
With the Inside Bar in Price Action, though, the color of the 2 candles does not matter and they can be the same. It is enough that the condition a candle inside a candle is met, meaning candle number 1 is large enough for the second candle to sit entirely inside it.
The forms and variations of the Inside Bar pattern
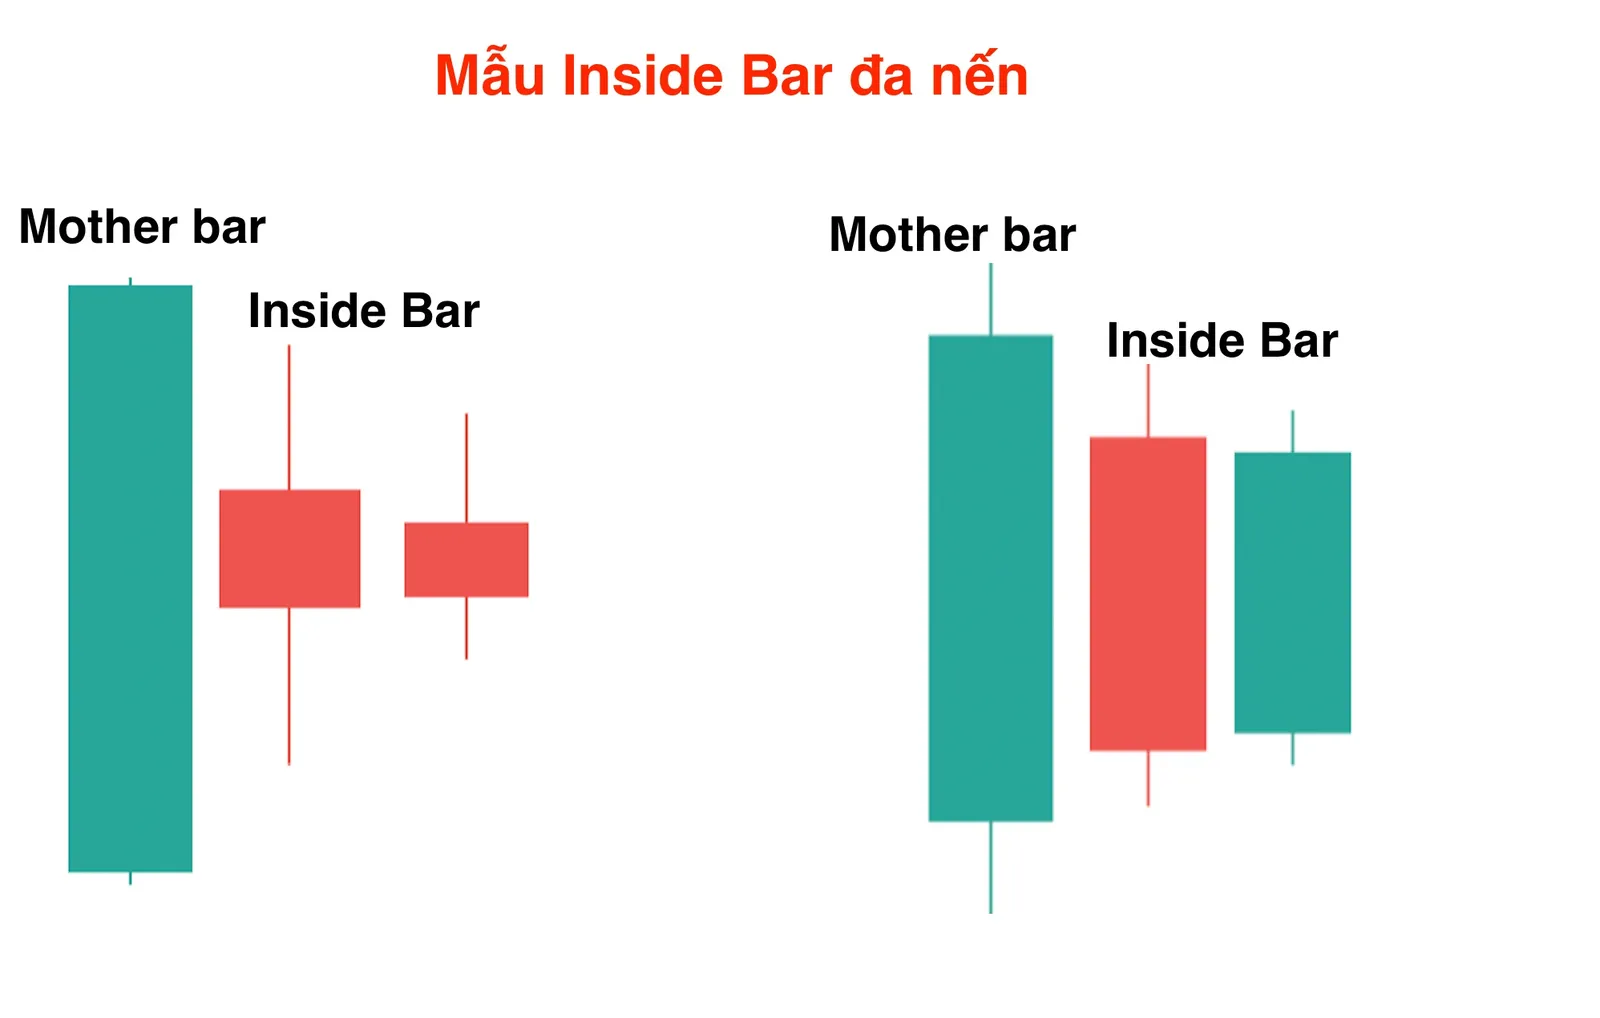
As explained above, the Inside Bar is basically a 2-candle pattern. But over time the pattern has been extended: it does not have to be 2 candles, it can be 3 or 4, and some traders are used to calling that a multi-candle Inside Bar.
The screenshot shows the Vietnamese interface; the buttons and labels sit in the same places in the English version.
When a multi-candle Inside Bar shows up, the color of the candles certainly does not matter; what the trader cares about here is that the “baby” candles after that Mother Bar have to be smaller, so that they sit entirely inside the mother candle. They must not be larger, or the Inside Bar pattern has not formed.
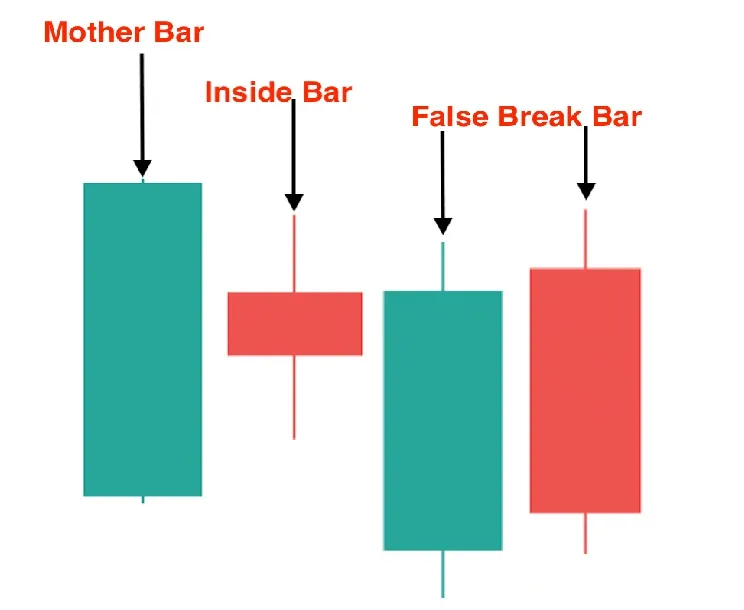
So the first condition for a proper Inside Bar is a mother candle large enough to cover all the baby candles behind it; the color of the candles does not matter much, green or red as it comes. If, while the pattern is forming, a “baby” candle suddenly grows taller than the Mother Bar itself, the pattern counts as failed.
Look at the example below to understand it better.
The market psychology behind an Inside Bar group
Every candle that forms holds the whole state of mind of the traders inside it, and the Inside Bar is no exception.
The first candle is a large candle, showing that one of the 2 sides is on top and that the winning side expects price to carry on the way it wants: falling further (if the winning side is the Sell side), or rising further (if the winning side is the Buy side).
The result, though, is not what they hoped for. Trading turns more cautious, which makes the second candle (the Inside Bar) a small, light thing that can fit inside the first candle. What does that say?
When there is a strongly rising candle, especially a deep green one, traders always expect price to keep going up; but when that expectation falls apart, you and thousands of other traders ask yourselves whether now is the moment to take profit.
Because they have to sit and weigh it up and ask that question, trading moves towards caution and thins out little by little, which is exactly why candle 2 is narrower than candle 1. With a multi-candle Inside Bar you can see a whole run of small candles right behind the Mother Bar. If this pattern shows up on D1, you can check it against smaller timeframes such as H4 or H1, where you will usually see price building a consolidation triangle.
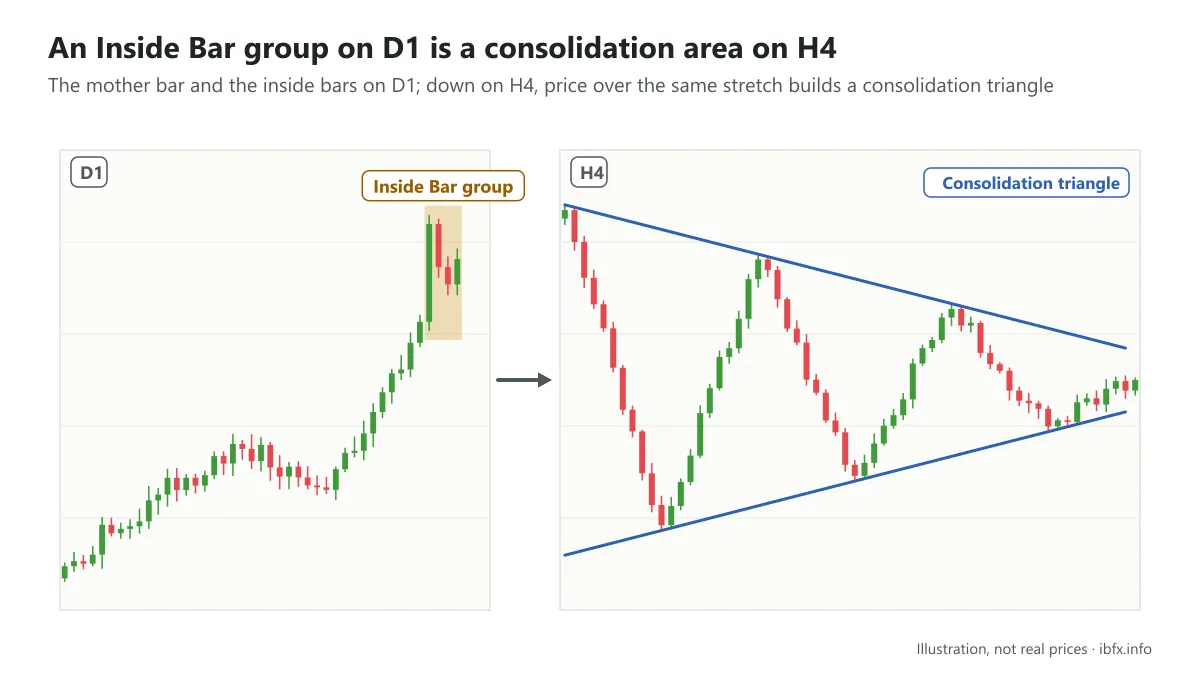
The reason consolidation happens is the one given above: the winning side cannot push price any higher or any lower (depending on which side is on top), and the weaker side is not strong enough to push price up or down to make the opposite lows or highs either. That is why, as you may notice, the Inside Bar candles within a multi-candle pattern very often show signs of a wick rejection. And whatever else happens, they still have to sit inside candle number one.
Consolidation is like a spring being pressed down: the longer it is pressed, the more strongly price tends to move once one of the 2 sides takes back the initiative, either on in the same direction or in reverse, depending on which side wins. So consolidation is also the way one of the 2 sides weighs things up and prepares for what comes next.
The Inside Bar and the Harami candle
The two are very much alike: Harami is the name from Japanese candles and means “pregnant”, while Inside Bar (a candle inside a candle) is the name from the Price Action school. Both have one large candle in front and one small candle sitting inside. The difference: the Harami only requires the body of the baby candle to sit inside the body of the mother candle (the wick can stick out), while the Inside Bar requires the whole baby candle, wick included, to sit inside the high-low range of the mother candle.
The opposite of this structure is the Engulfing pattern, also a 2-candle pattern, but with candle 1 being the small candle and candle 2 being the large candle that covers the first one.
To understand more you can read these articles again:
- What is a Bearish Engulfing? The bearish engulfing candle pattern
- What is a Bullish Harami? The bullish pregnant pattern
Inside Bar vs Inside Day
Inside Day is probably a term you hear now and then if you read analysis on foreign websites. In fact this is still the Inside Bar pattern, but when it shows up on the daily timeframe traders prefer to call it an Inside Day rather than an Inside Bar.
The daily timeframe usually makes this candle pattern more reliable than the timeframes from H4 down. An Inside Day shows that, over a whole day, neither side could push price outside the range of the day before.
So an Inside Day is still an Inside Bar candle, but the name points to trading on the daily timeframe rather than on H4, H1 or M15.
How to trade the Inside Bar candle
As explained above, when an Inside Bar shows up it means the market is in a phase of consolidation, and especially when you look at this pattern on lower timeframes you will see price running into an ever narrower triangle. The longer that consolidation goes on, the stronger the breakout tends to be. Because price closes in towards the end of the triangle, a trader needs the patience to wait for the break before entering.
That is why there are 2 ways to trade the Inside Bar pattern, or to put it more exactly, we wait to see which edge price breaks and then go that way. In detail:
Trading the Inside Bar for continuation
This is the way many traders like, because trading with the trend usually carries better odds. When an Inside Bar shows up in a clear trend, after the consolidation phase, a break in the direction of the main trend can often run a few dozen pips or more.
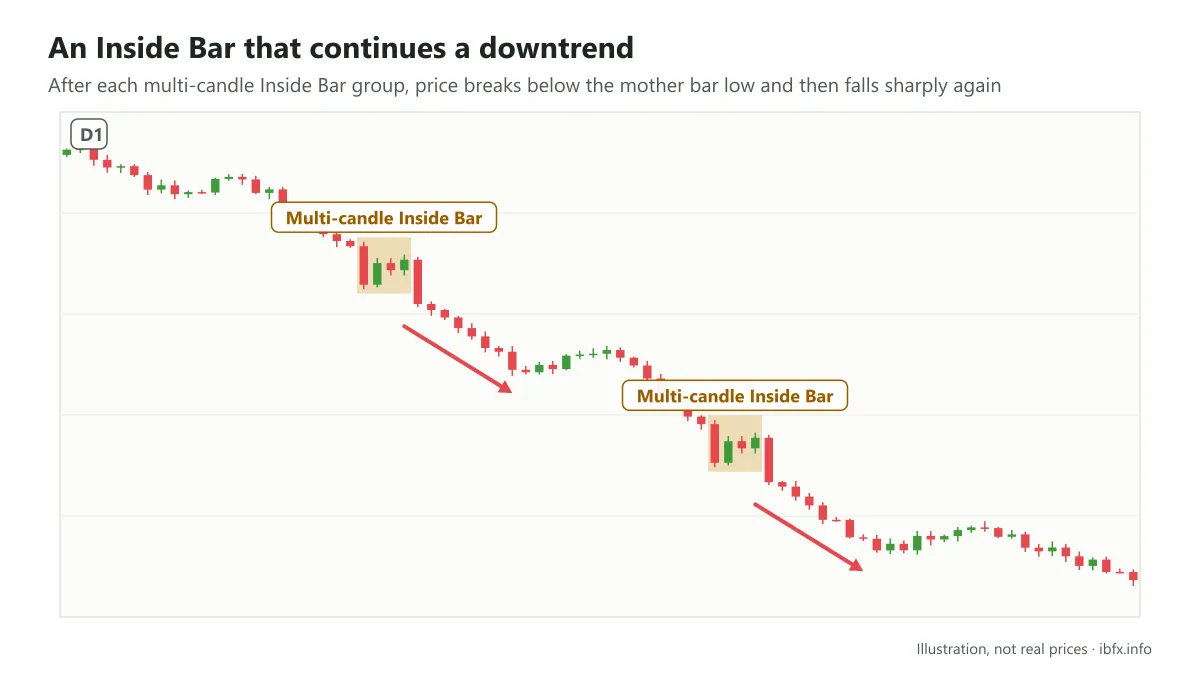
In the example above you can see that, after the multi-candle Inside Bar patterns formed, price fell sharply when it broke below the pattern.
To find the entry point, the pattern first has to be complete, meaning the Inside Bar candle (candle 2) has closed and is sitting entirely inside the mother candle.
After that, the trader waits for the next candle to break outside the range of the mother candle. This is easier to see if the Inside Bar pattern forms on D1 or H4; check it against the smaller timeframes to find the entry point.
The example above is on D1, so look at the Inside Bar pattern on H4 and see what it tells you.
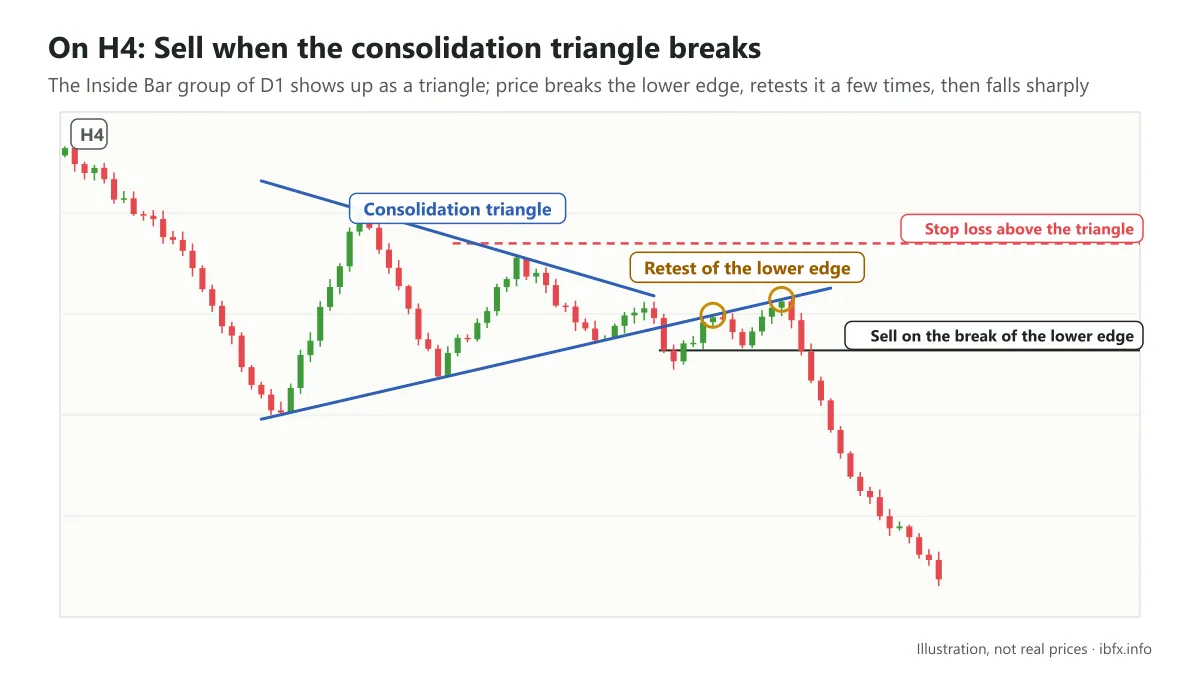
As you can see in the picture above, after price broke the consolidation triangle it began to fall, but it still tested the level over and over before it really dropped.
With patterns like this:
The entry point is when price breaks outside the range of the mother candle in the direction of the trend (you can use a pending Sell Stop or Buy Stop order placed just beyond the high or the low of the mother candle).
The stop loss point goes a small distance beyond the other side of the Inside Bar (for a Sell order, above the high of the Inside Bar); the safer way is to put it on the other side of the mother candle. With a pair that moves hard, such as GBPUSD, you should give the stop a little more room so that it is not swept just before price turns, and cut your position size to match.
The stop loss goes on the other side of the Inside Bar because, if price comes back through that level, the break is most likely a false break.
The take profit point: put it at the nearest support or resistance zone in the direction of the trade, or work to a minimum reward-to-risk ratio of 2:1. In the example above, the Inside Bar pattern formed on the daily timeframe (an Inside Day), and after the break price fell quite sharply with the trend.
Trading the Inside Bar for reversal
In practice, trading the Inside Bar pattern for a reversal usually does not work as well as trading it for continuation.
That is why, to be clear about what the trade is worth, you need to consider where the Inside Bar shows up: if it lines up with an important support or resistance zone, the signal is usually more reliable.
Why is an Inside Bar candle at a support or resistance area worth noticing?
Because a support and resistance zone is where the state of mind of buyers and sellers shows itself. For instance, if selling pressure is stronger than buying pressure, price gets pushed below the support level. At that point some buyers grow afraid of losing money because support has broken, so they look for a way to get out and leave the market. Meanwhile, if the Sell side feels it is in control of the market it will keep pushing price lower still, and the bears win out. If you are a trader and you know that broken support turns into resistance, meaning the bears or the sell side are in control, is this a good chance for you to open a Sell? But the question here is: how do you know this really is a good chance to join in, and not a piece of bait that Mr Market is holding out to tempt you?
If an Inside Bar pattern now shows up right below the support that has just been broken (now resistance), that is a price action signal worth noticing, showing price consolidating before it falls further.
Look at the example below to understand it better
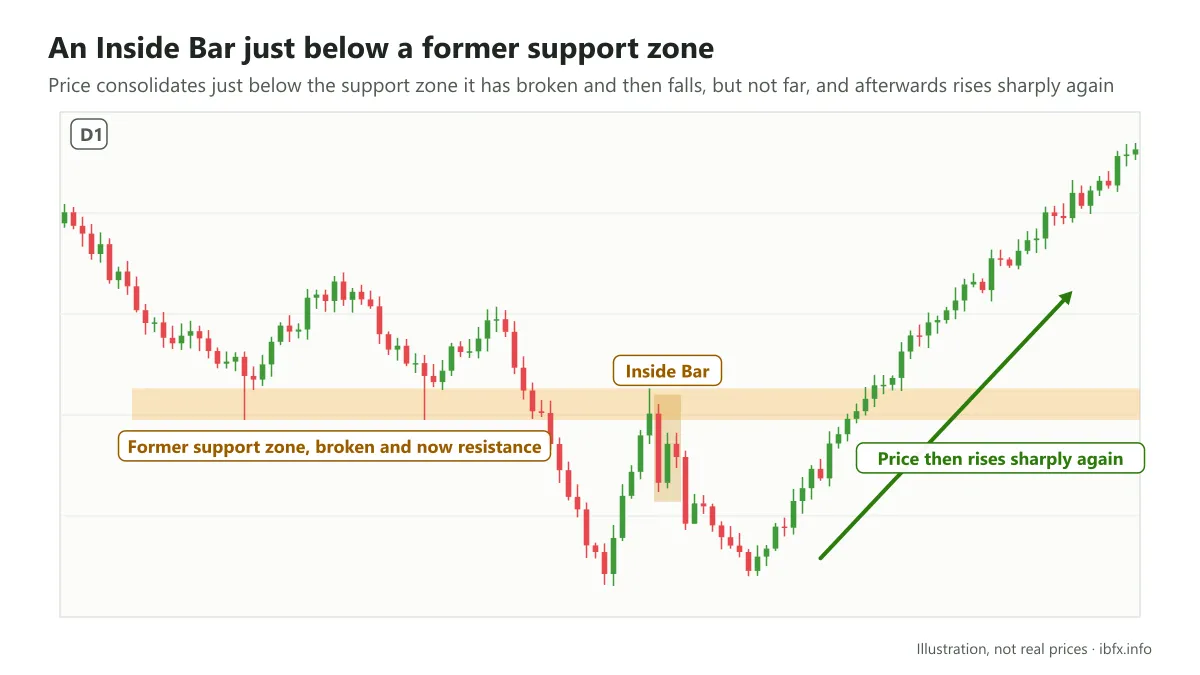
Price formed the Inside Bar pattern right below a fairly firm support zone from earlier (the orange band); because it could not get back and hold above that zone, support turned into resistance and price fell, as you can see.
Even so, as said above, since the Inside Bar pattern is a consolidation structure it usually works better traded for continuation; with a reversal setup like the one above, price did not fall far. After that fall ended, price turned around and rose sharply again.
So once more, if you use this Inside Bar pattern you should add a few more pieces of evidence, such as resistance and support lines and the basic price patterns, to be on surer ground.
As for the entry and stop loss points, they are the same as for the continuation Inside Bar pattern introduced above.
Some things to keep in mind about the Inside Bar
The Inside Bar is usually more reliable on the daily timeframe, and from the daily chart you can check down to lower timeframes such as H4 and H1, to study the candles inside, watch which way price is running, and see when the triangle will break.
The Inside Bar is not only a 2-candle pattern; it can be 3 or 4 candles, and the longer the consolidation lasts, the more the pattern is worth.
All of the bars inside should sit within the Mother Bar, and the shorter and smaller the better. In particular, if the baby bars get shorter step by step, each one shorter than the one before, that makes the Inside Bar pattern work better.
To make the Inside Bar pattern work better, the market should be in a clear trend, not moving sideways.
Sometimes the bars sitting inside form a Fakey false break pattern, and that too is treated as an important part of reading an Inside Bar. That said, the Fakey is also treated as a pattern of its own in Price Action, set out in more detail in the article What is a fakey?
However you use the Inside Bar, always place a stop loss and practice on a demo account before you trade for real.