On this page
EMA is probably one of the indicators every trader has seen when they trade forex, whether they use it or not. At bottom, the EMA is a form of dynamic support and resistance that moves with price. Because it tracks price so closely, a great many traders put the EMA into their trading system. Why do so many traders reach for the EMA? Let us look into it in the article below.
What is the EMA?
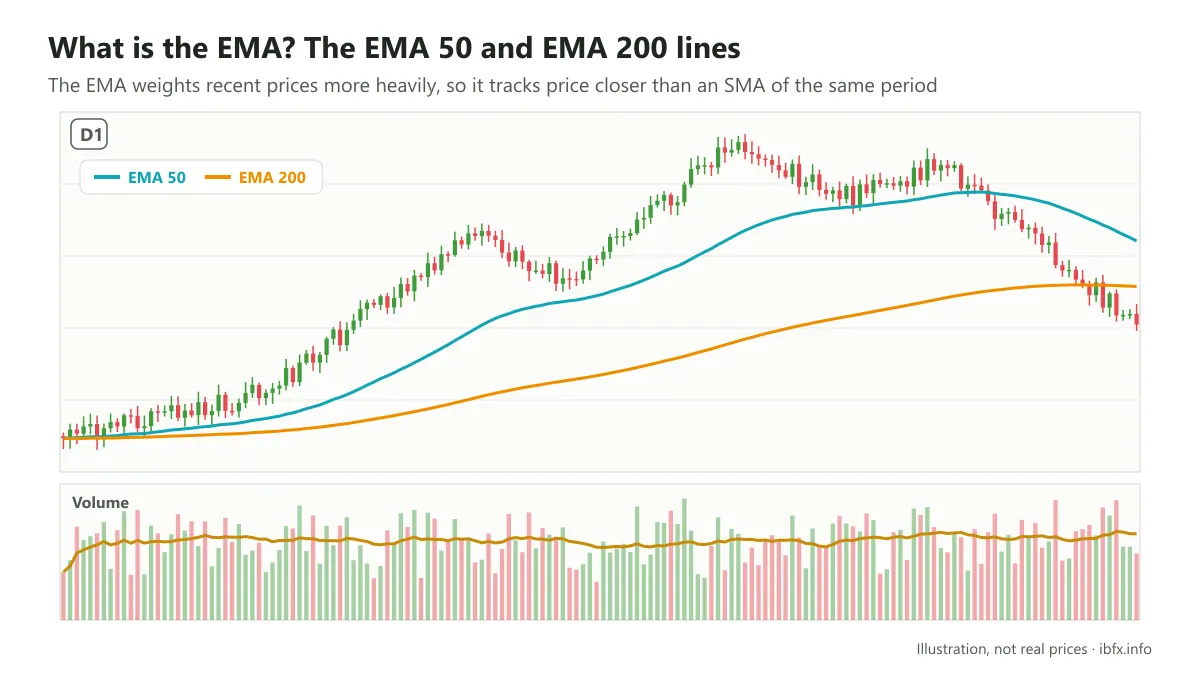
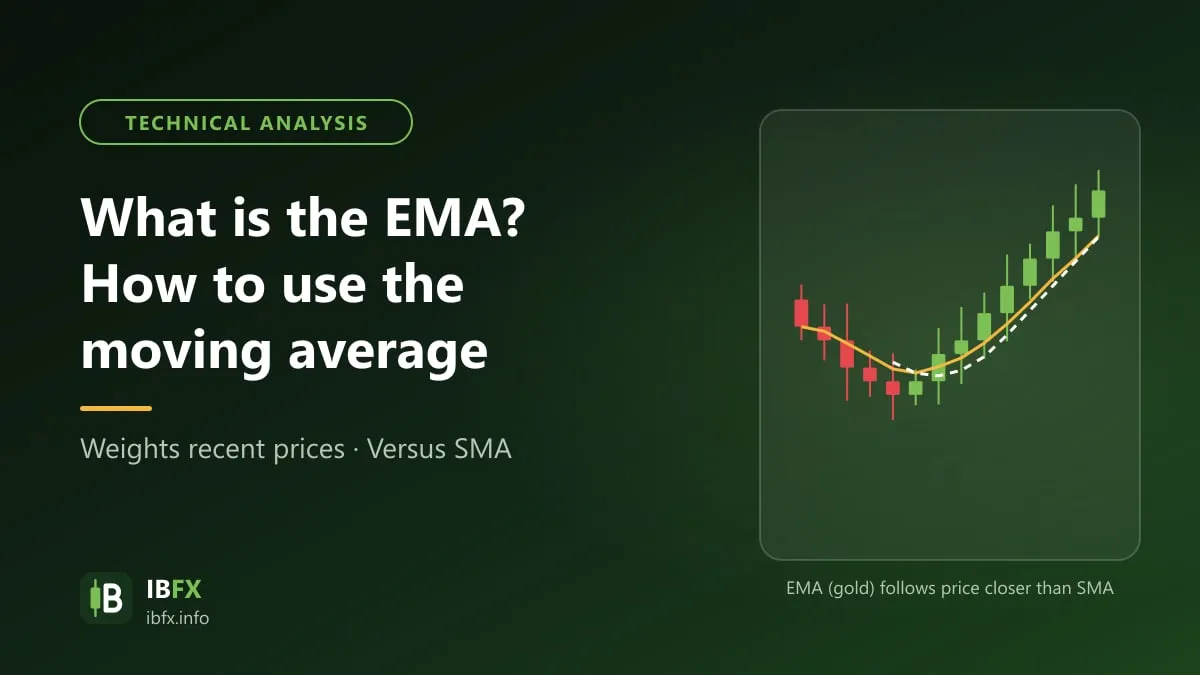
EMA, or Exponential Moving Average, is a type of moving average (MA) whose formula applies exponential weighting, so it reacts far more to recent price changes than the simple moving average (SMA), which applies equal weight to every period. That is what makes the EMA track price closely and react faster than the SMA.
What signals does the EMA give a trader?
This part explains market psychology and the role of the EMA. If you only want the trading method, you can scroll down to the section on how to trade with the EMA.
Like many other indicators, by the time the EMA starts to move, price has already moved. Because of the way it is worked out, a moving average is an average of prices in the past, so it always sits below or above the current range in an uptrend or a downtrend; rising price tends to look for support at the average price of the last n days. The other way round, falling price tends to look for resistance at the average price of the last n days. So the EMA can be seen as a record that remembers the price levels over a given period. Suppose the short-term price memory of the market is 9 days: price then “remembers” the trades that have piled up over the last 9 days.
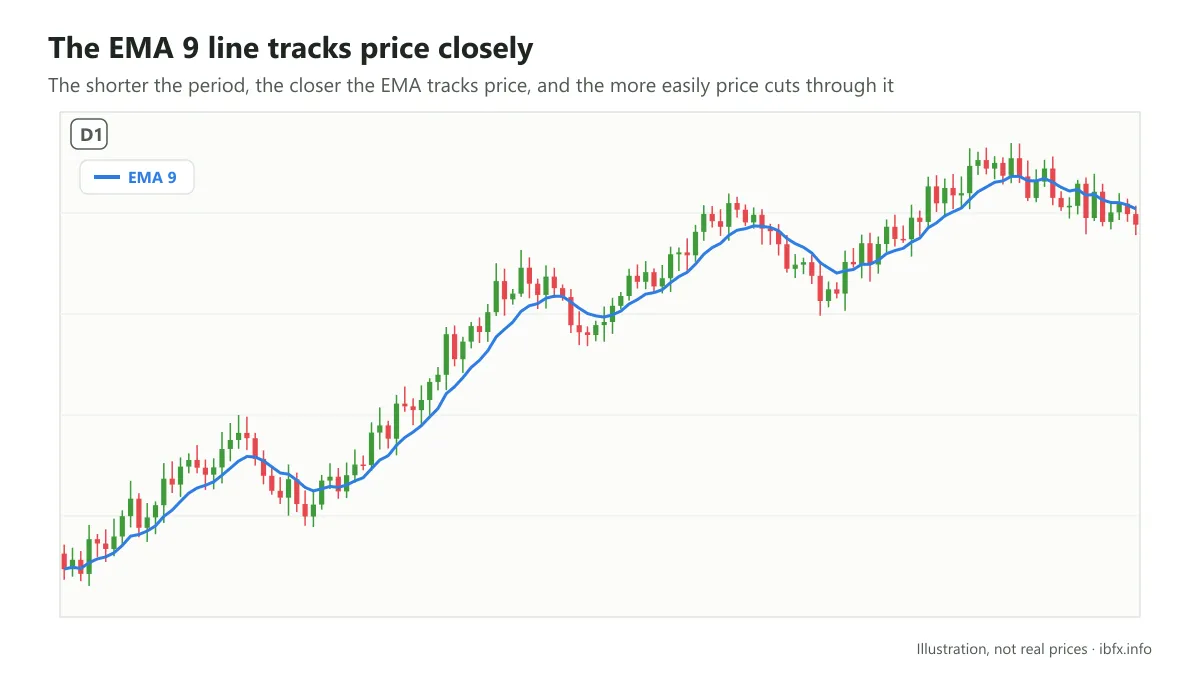
So the greatest strength of a moving average is that it shows the price trend clearly. By the formula, the EMA only rises when the closing price is above the previous EMA value and only falls when the closing price is below it. This is the most important feature of a moving average: it helps a trader see the price trend more clearly, with less noise from each single candle.
The trend is what helps a trader look for a place to enter.
In an uptrend, price keeps reaching a new high, so it always makes higher lows and higher highs.
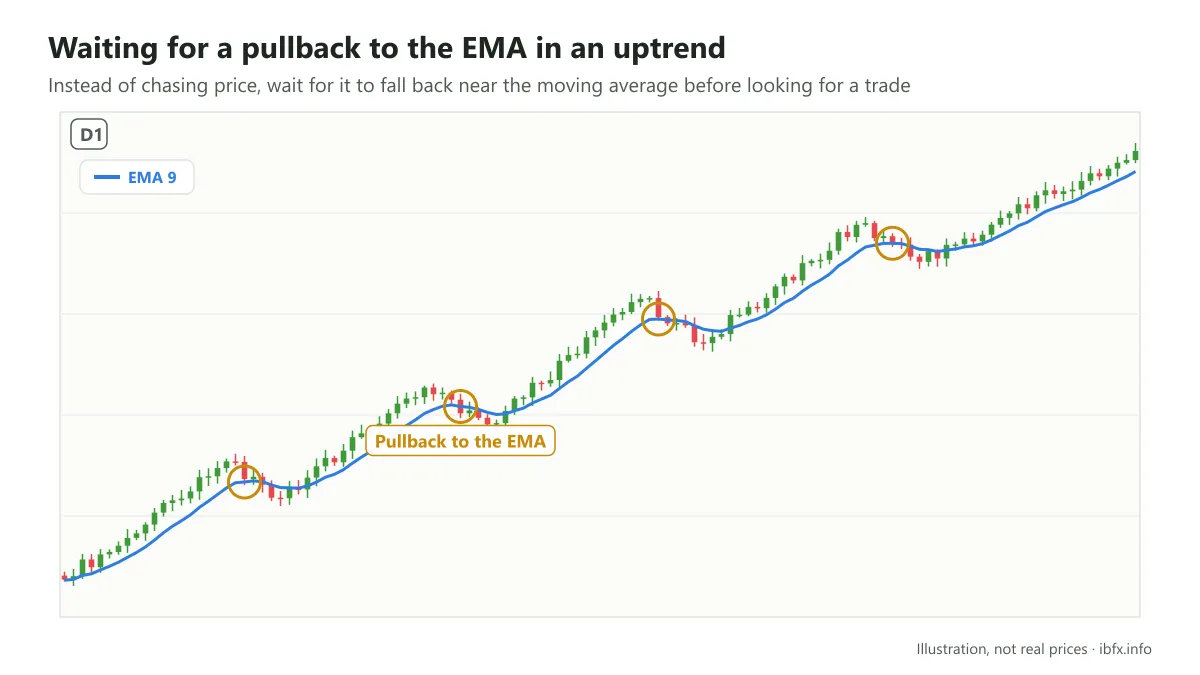
So one thing is certain: if you want to buy, you have to buy at a higher price; but if you wait for price to pull back near the moving average of the last n days, you get a more reasonable price than if you chase price.
In a downtrend, price clearly falls further and further, because it keeps making lower lows and lower highs (the aim being to sell short), so the price you sell at may be lower than it was when the downtrend was only just forming; but if you wait for price to rally back near the moving average before you sell, you get a better price than if you chase price down.
So the question is this: how do you find a good place to buy, or know how far price will pull back during a rally, for instance, so that you can buy again?
In practice, many traders who come into the market are reluctant to pay up, meaning they wait for a really cheap price before they dare buy, or the other way round, they chase price after it has already run too far.
It is exactly when the market keeps going one way that a great many traders ask where to look for a place to buy, because if price keeps falling, or keeps rising, where is the right place to buy? If you wait for price to fall all the way to the bottom before you enter, you may well be catching a falling knife rather than buying genuinely cheap, because price can keep falling in cases like that.
That is why EMA lines are a popular tool for finding an entry and an exit while price is in a clear trend: instead of chasing price or trying to pick the bottom, you wait for price to pull back near the moving average and only then enter with the trend.
So, to sum up, the main roles of the EMA are:
- The EMA is a dynamic barrier that moves with price. That lets the EMA help a trader:
- have dynamic resistance and support zones (which you can compare with a trendline, or with static support and resistance lines), and from them find the entry, the stop loss and the take profit.
- work out the price trend.
How the EMA is worked out
The formula for the SMA is very simple, the sum everyone has learned at school: the average price over a given number of periods.
SMA14, for example, means you add up the closing prices of 14 days of trading and divide by 14.
The EMA formula, on the other hand, is very different. It is meant to solve something the SMA cannot do: it drops the idea that price is spread evenly across the whole period, and instead has the EMA concentrate on the prices nearest the current one, cutting the lag by applying more weight to recent prices. The weight applied to the most recent price depends on the number of periods in the average. The EMA differs from a simple moving average in that one day’s EMA value depends on the EMA values of every day before it. So, for the EMA to settle down, you need a good deal more data than the number of periods (an EMA 10, for example, should have several dozen candles of data or more). On top of that, the shorter the EMA period, the closer it tracks price and the more easily price cuts through it, while the longer the EMA period, the less often it is cut through — but the slower it reacts.
Three steps to work out the exponential moving average (EMA).
- Work out the simple moving average for the starting EMA value. The exponential moving average (EMA) has to start somewhere, so the simple moving average is used as the previous period’s EMA in the first calculation.
- Work out the weighting.
- Work out the exponential moving average for each day between the starting EMA value and today, using the price, the multiplier and the previous period’s EMA value.
Say this is the EMA calculation for a 10-day EMA.
Starting SMA: sum of 10 periods / 10
Weighting: 2 / (Number of periods + 1) = 2 / (10 + 1) = 0.1818 (18.18%)
EMA: {Close – EMA (previous day)} x weighting + EMA (previous day)
Note, there are a great many different EMA formulas on the internet, and you do not really need to work it out at all, because TradingView or MT4 has already done it. So it is enough to remember what has just been explained above, or to read the next part to understand how the EMA differs from the SMA.
How the EMA and the SMA behave against price
The EMA and the SMA are the 2 kinds of moving average traders always bring up. Many traders advise using the EMA instead of the SMA because the EMA reacts to price faster (while the SMA is smoother but slower).
So how does that difference show up on the chart?
First, look at how moving averages behave while price has momentum and then turns sideways; a sudden shock comes later in this section.
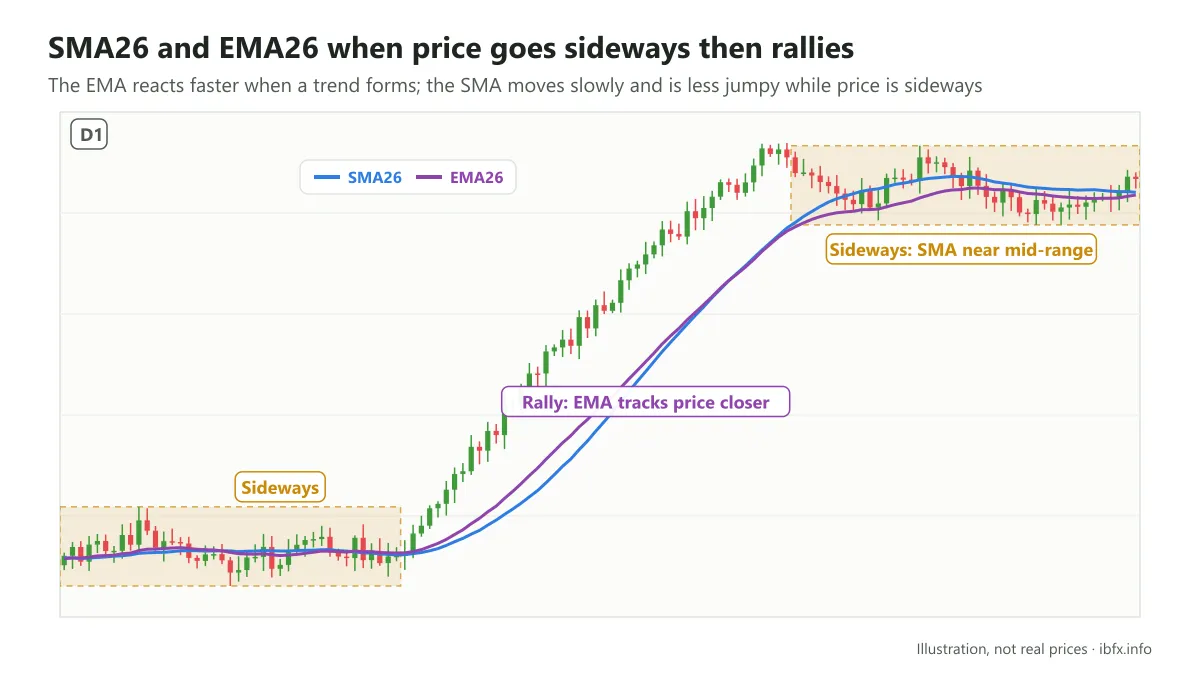
The chart below shows that before price really put in a long rally, it all looked very quiet, and that kept both the EMA and the SMA tracking the price line more closely.
Once price began to rise, though, you can see the EMA reacting to price faster: the proof is that it keeps hugging the candles, showing price being “held up” by the EMA itself.
The SMA, meanwhile, has price flipping above and below it instead of staying on one side. On top of that, the further price rises, the further the SMA moves away from the price range.
The EMA, the other way round, seems to stay around price. Once price started to fall and was going sideways, though, you can see the SMA sitting near the center of the price area.
So you can see:
- The EMA reacts faster when price really changes to form a trend, because the EMA puts more weight on recent prices and so tracks price more closely.
- While price is sideways, the SMA moves slowly and usually sits near the middle of the range, so it is less jumpy about small moves; the EMA, the other way round, gives noisier signals during that stretch.
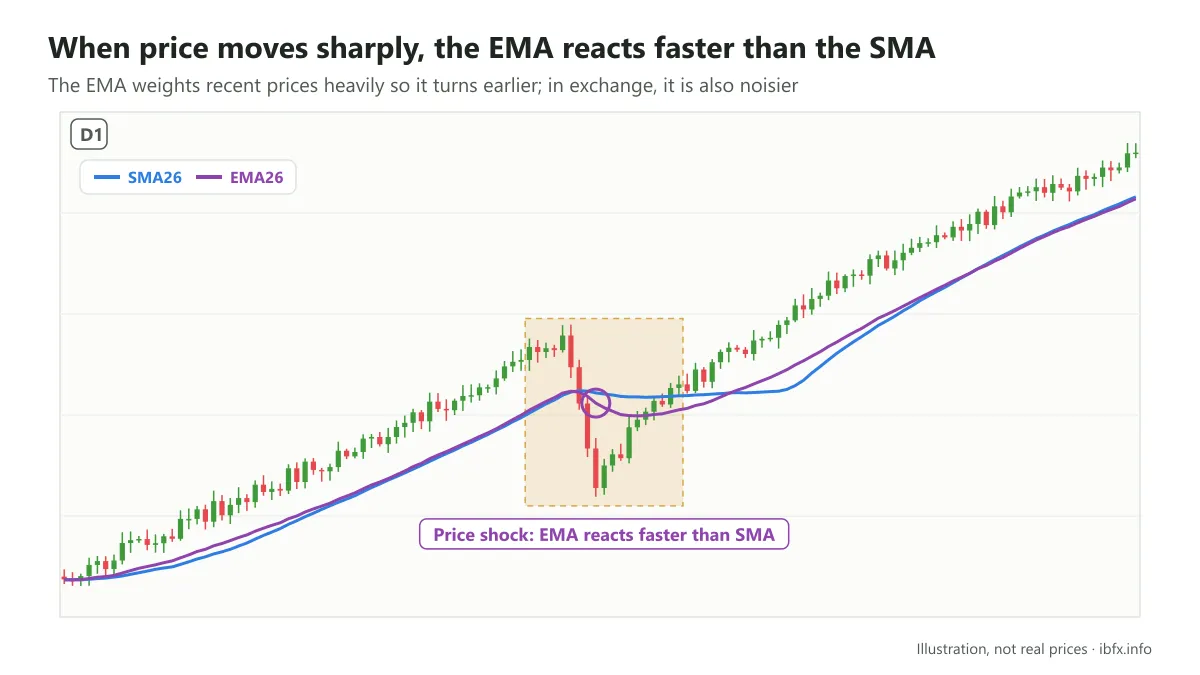
Those are the 2 most important points that set the EMA apart from the SMA, so that you know which kind of moving average to use at different moments in the market.
And looking at the example above, you can also see why the EMA is treated as a resistance and support level, right?
The EMA is like a shelf: when price is above the EMA, the market leans to the upside; when price is below the EMA, the market leans to the downside. Price usually reacts when it touches the EMA, so these are the areas a trader needs to keep an eye on when trading forex.
To add the EMA on TradingView, look for the EMA indicator (Moving Average Exponential); the default period is 9, and you change the period in the indicator settings. On MT4, go to Insert → Indicators → Trend → Moving Average and set MA method to Exponential.
Which EMA should you use?
Which EMA you choose depends on the trader and on each person’s trading strategy.
A few principles for using the EMA:
A price chart usually carries 2 EMA lines, one fast EMA and one slow EMA
The lower the period of an EMA, the more easily it is broken, but it tracks the price line more closely than an EMA with a long period.
On top of that, the formula shows that the price line has to come first before any EMA line can be produced, so whatever happens, the EMA is slower than the price line.
That is why traders pair up a short EMA with a long EMA, to make the trend easier to read.
For the same reason, to make the reading more convincing, the EMA lines most traders pick are the ones that track the price line as closely as possible without being so short that they are broken too easily.
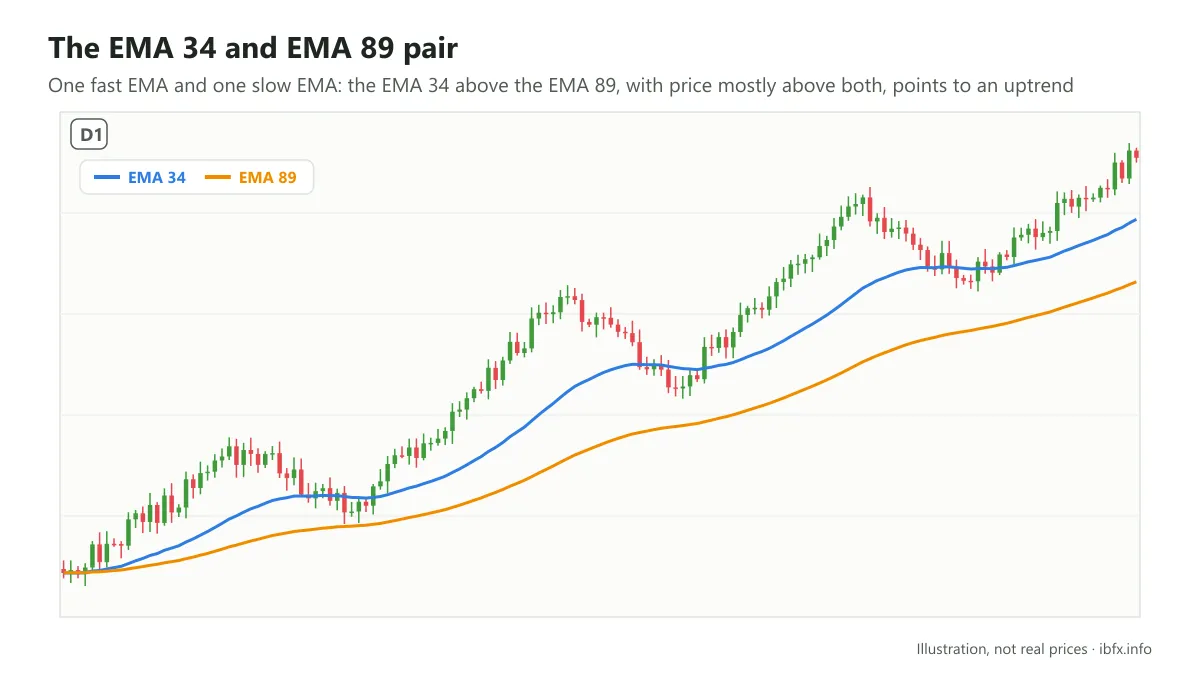
So many traders use a few EMAs such as these:
EMA 9 or EMA 10: the EMA10 is exactly 2 weeks of trading (10 sessions) and the EMA9 is close to it, so both are usually used for short-term trading
EMA 34/ EMA 89: these are numbers in the Fibonacci sequence and some traders are fond of them; there is no solid basis, though (not even from Elliott wave theory), for saying these periods are better than any other.
EMA 20, EMA 50, EMA 200: these are the common periods, standing in turn for the short-term trend (about one month of trading), the medium-term trend (about one quarter, some 60 sessions) and the long-term trend (close to a year of trading on the daily chart).
Besides the EMA 200 there are also traders who use the EMA 250, because a year has about 250 trading days (in the stock market).
EMA 100: a round period, also chosen by many traders for the medium and long-term trend.
Comparing a trendline with the EMA
As said above, the EMA is one of the ways to work out the trend, and the trendline is another.
To see this more clearly: a trendline is at bottom a static barrier, meaning that once you have drawn a trendline, it is nailed to that price line.
The EMA, on the other hand, moves with the price line, which is why it is called a dynamic barrier. Compared with a trendline, the EMA tracks the price line more closely, because it takes price itself into its formula; strictly speaking the EMA is drawn out of price, and that is what lets it hug price and show the trend clearly when price is above, or below, the EMA.
How to trade with the EMA
There are 3 basic ways to trade it:
- Trading the EMA together with the price line
- Trading when the EMA lines cross
- Trading the EMA together with some other indicators and tools
Of the 3 above, we will only walk you through way 1 and way 3.
The 2nd way, trading when the EMA lines cross (see also Golden Cross and Death Cross), is in our view not a good choice for finding an entry, although it can still be used to filter the trend.
Because, as we said right at the start, the EMA is drawn out of price itself, so the EMA is always SLOWER than the price line. By the time those EMAs cross and the trader enters, price has in truth already run a whole stretch.
So this is not really a workable option with the EMA. Now let us go through the other 2 ways of trading together.
Trading the EMA together with the price line
The rule here is basically very simple. It is to go with the trend:
- When price is above the EMA, the market leans to the upside >>> give priority to looking for a Buy
- When price is below the EMA, the market leans to the downside >>> give priority to looking for a Sell
So your job is to wait for price to settle firmly on one side of the EMA. Because the EMA tracks price very closely, you wait until price pulls back near these EMA zones before looking for a buy or a sell with the trend.
Traders usually use at least 2 lines, one fast EMA and one slow EMA, though, so in many cases price can be above one EMA and below the other. You need to wait patiently, and remember that an EMA line can be broken at any moment.
If you trade with the EMA alone, you can wait through these steps:
Step 1: Wait for price to be completely above or completely below both EMA lines
Step 2: Wait for price to react to these EMA zones at least 2 times (in an uptrend, for example, price falls to test the EMA and then bounces). This helps you avoid taking false signals. And the more times the EMA is tested without being broken, the clearer it becomes that the trend is an uptrend or a downtrend.
On top of that, waiting for the EMA to be tested (at least 2 times) is also the stretch of time the market takes to redistribute between buy and sell orders, and the time for a trend to develop.
Remember that no price is a high price and no price is a low price while the market is truly in a trend. So if the EMA has clearly shown that the current trend is up, you can wait for price to pull back to the EMA zones and then trade, placing the stop loss below the slow EMA or below the nearest low.
Look at the following example:
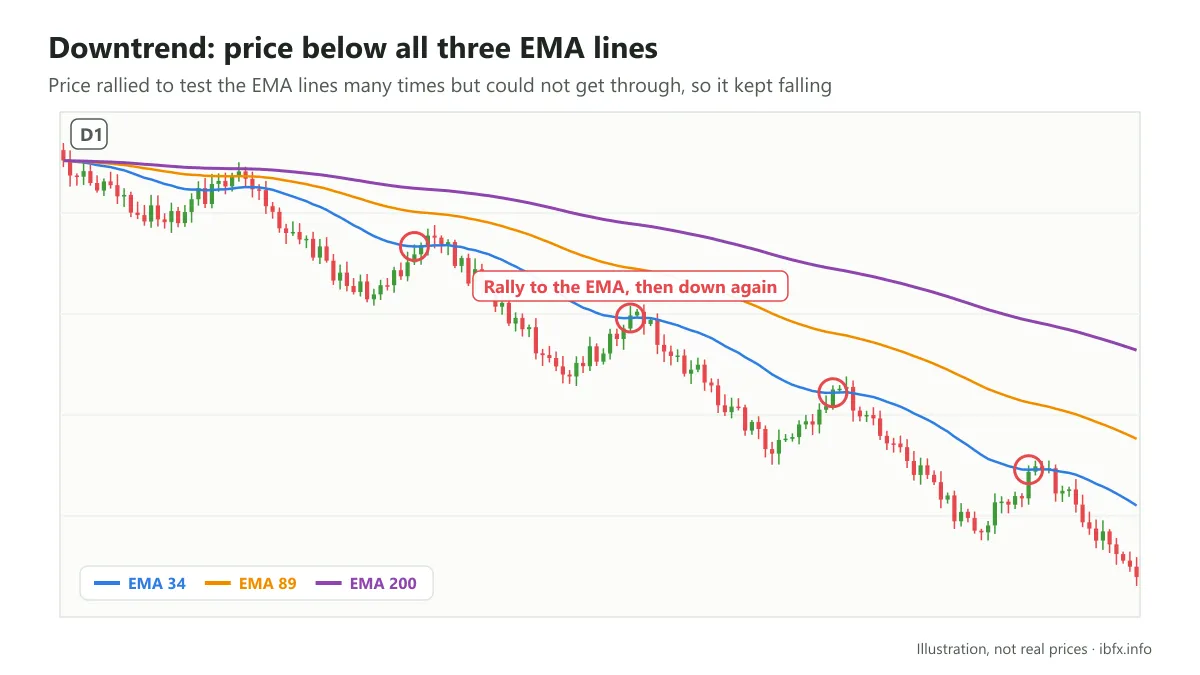
Clearly, whichever EMA you use, in this downtrend price is below all 3 EMA lines (the EMA lines sit above price). Price rallied to test these EMA lines many times but could not get through, so it kept falling.
To know whether price has really moved into a downtrend, though, you need to wait for price to touch the EMA at least 2 times without getting through it. So the EMA is not only a tool for working out the trend: in cases like these it also becomes a (dynamic) barrier, and one of the simple ways to look for a good entry.
Combining the EMA with other indicators and tools
This way basically helps you cut risk further. You can combine the EMA with any tool, depending on each trader’s style. When you use this way, though, the EMA itself works as a dynamic resistance/support line, so pairing the EMA with momentum indicators such as Stoch, MACD or RSI gives a trader 2 pieces of information: what the trend is (the EMA takes care of that), and whether the trend is about to end (the momentum indicators report that signal).
To make it clearer, look at this example of using the EMA together with the MACD:
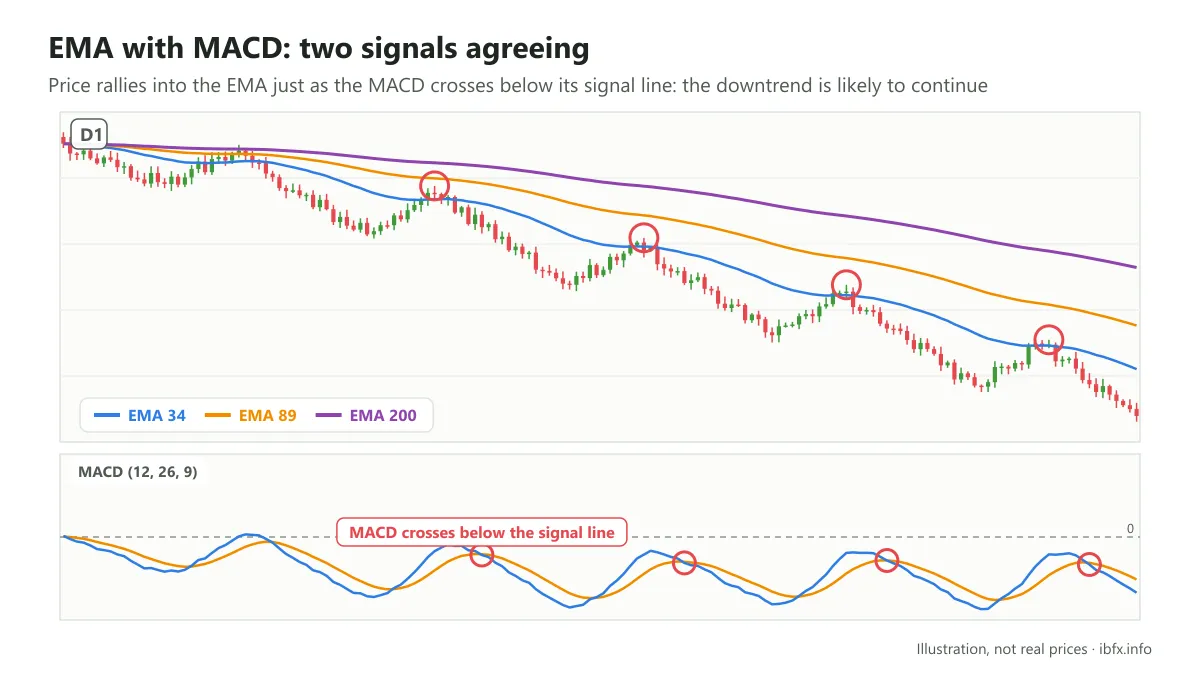
Looking at the chart above, you can see that the moment price touched the EMAs was also the moment the MACD line and the Signal Line crossed. For the rules of trading with the MACD you can also read the article: What is MACD? How to use the MACD indicator.
When the EMA and the MACD both agree, the signal says price is likely still in a downtrend and cannot break back to the upside yet, though this is not certain.
A few things to watch with the EMA
When price pushes above the EMA but then quickly comes back to close below it (a false break), many traders read that as buyers having run out of strength and wait for price to fall further; and the other way round for a false break below. This is a common way of reading the chart rather than a rule with figures behind it; price usually rises harder.
When price has run too far from the EMA, wait for it to pull back near the EMA before you trade.
A fast EMA, or an EMA with a short period, reacts faster than a slow EMA but is more easily broken. This can be a double-edged sword, because it can help you work out the trend earlier than the SMA. But the EMA may go through more short-term changes than the matching SMA.
The EMA is also a dynamic barrier, one that always follows the price line.
The EMA is not used to pick tops or bottoms exactly. At bottom, the EMA helps a trader trade with the trend.
Every moving average lags and gives plenty of noisy signals while the market is sideways; the EMA is most useful in a market with a clear trend. Always place a stop loss and practice on a demo account first.