On this page
A price channel is a basic technical analysis tool widely used in forex, basic but not simple at all. A price channel helps you see the trend clearly, along with the price zones where price often reverses, which is why many traders use it.
Note: the price channel in this article is the one you draw by hand from trendlines. It is not the same as the “Price Channel” indicator (also called the Donchian channel, drawn from the highest and the lowest price of N sessions) that some platforms have built in.
If you do not yet know how to draw a price channel, and have not worked out how best to trade with a price channel, this article is for you.
What a price channel is
A price channel is a technical analysis tool used to identify the trend of price, so that you can find places to buy, to sell and to take profit.
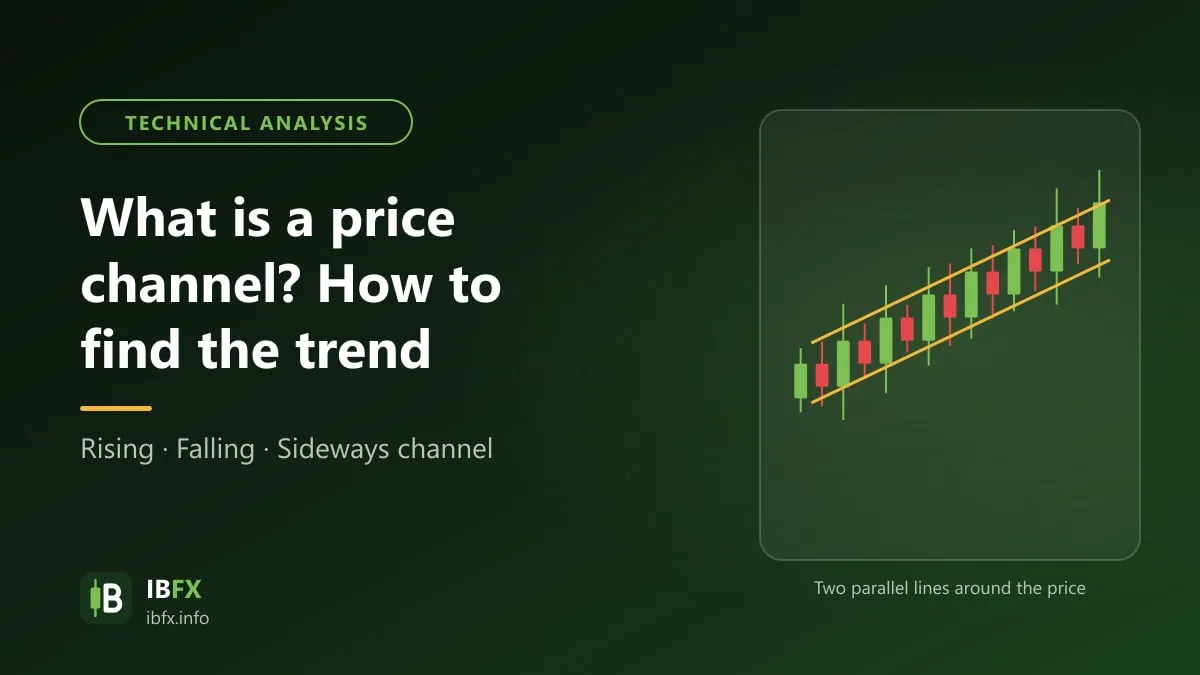
A price channel is made of 2 parallel straight lines. One of them is the trendline of the current trend, which can be rising, falling or sideways. The other is drawn parallel to that trendline so that most of the prices of the trend sit between the two lines.
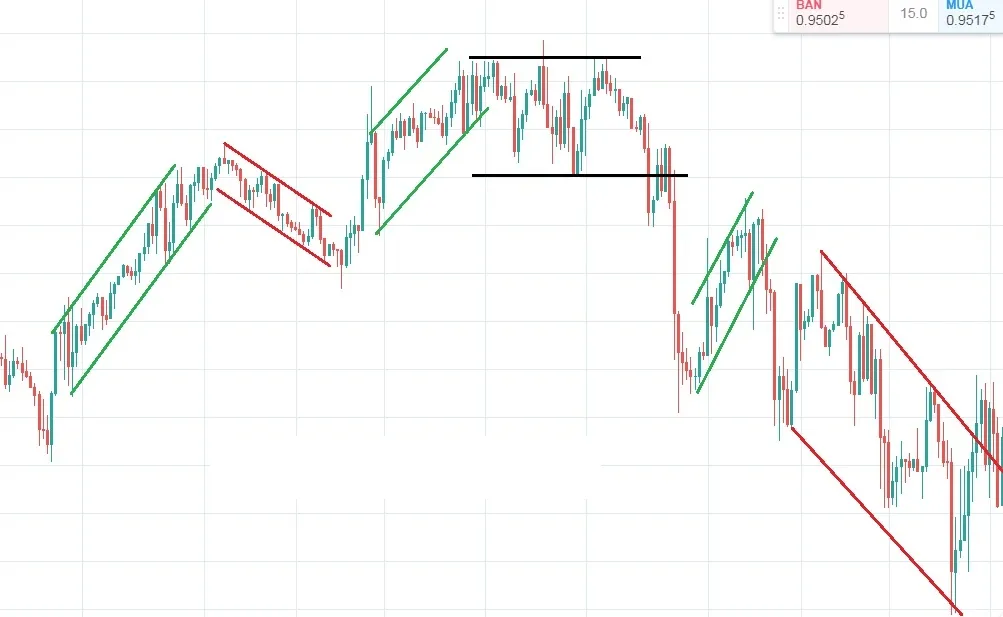
The screenshot shows the Vietnamese-language interface; the buttons and labels sit in the same places in the English one.
From the definition above you can see that a price channel is really 2 parallel trendlines covering almost all the prices inside them. The upper trendline acts as a resistance line and the lower trendline as a support line.
If you are already used to the trendline, drawing a price channel and trading with it will be a great deal easier. If you are not, you can read the article below:
The kinds of price channel and how to draw them
A price channel is formed from 2 trendlines, so the way trendlines are classified is also the way the kinds of price channel are identified.
Rising price channel (Up Price Channel)
It shows up in an uptrend and is made of 2 trendlines both sloping up, the lower of which is identified first and is the trendline of that uptrend. The upper line is drawn parallel to the lower trendline and through the nearest (or the first) high of the trend.
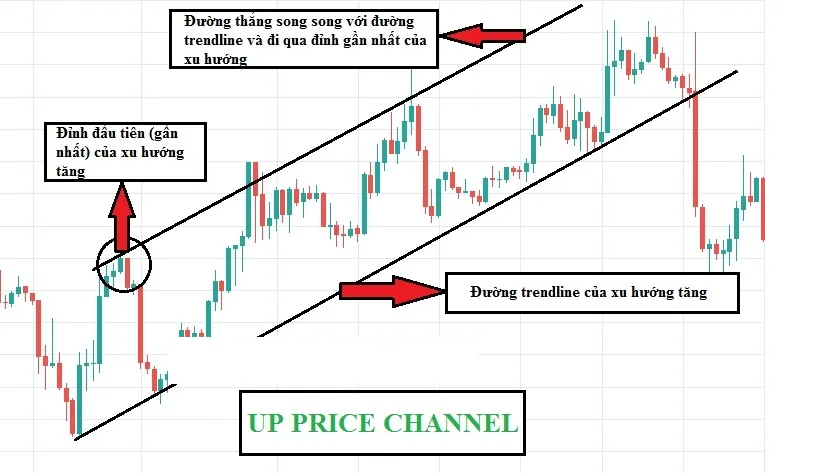
The screenshot shows the Vietnamese-language interface; the buttons and labels sit in the same places in the English one.
Most of the prices of the uptrend fit neatly between the 2 lines of the rising price channel. This channel is broken when price falls sharply through the lower trendline and reverses downward, or when price rises sharply through the upper trendline and forms a new uptrend with a new rising channel, which can also be the start of a sideways trend.
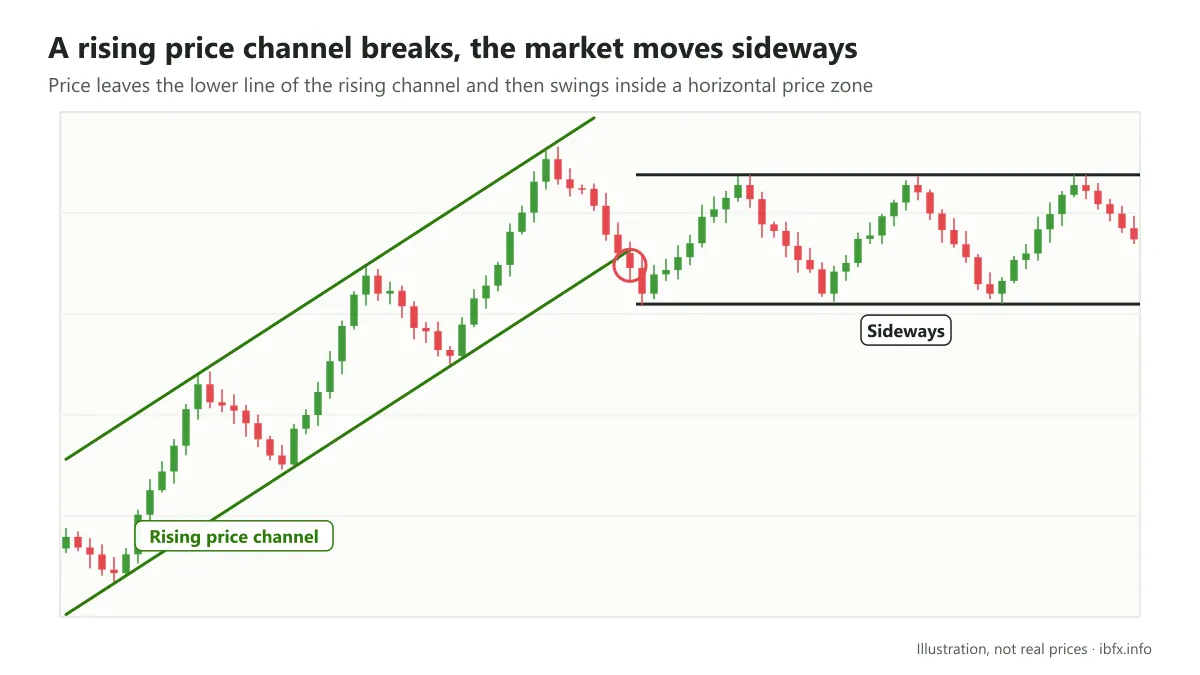
The rising price channel is broken and a sideways trend forms.
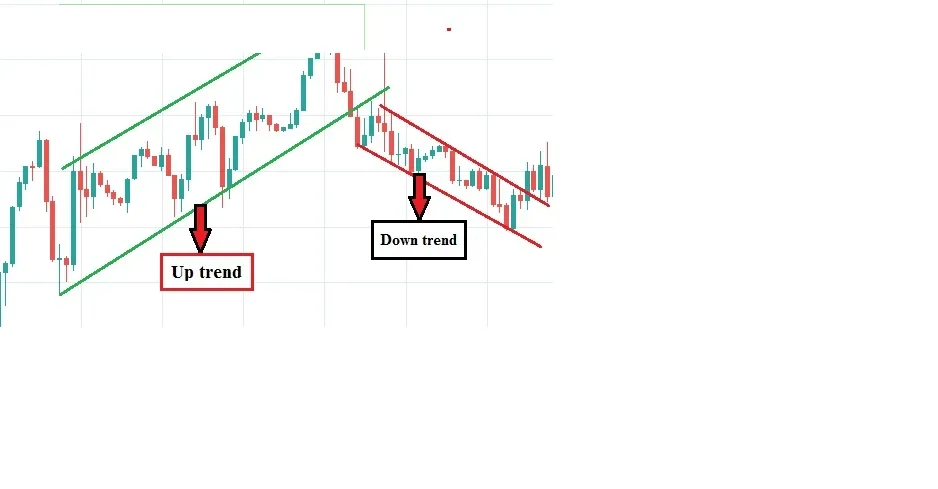
The rising price channel is broken and price reverses downward.
Falling price channel (Down Price Channel)
It shows up in a downtrend and is made of 2 trendlines both sloping down, the upper of which is identified first and is the trendline of that downtrend. The lower line is drawn parallel to the upper trendline and through the nearest (or the first) low of the trend.
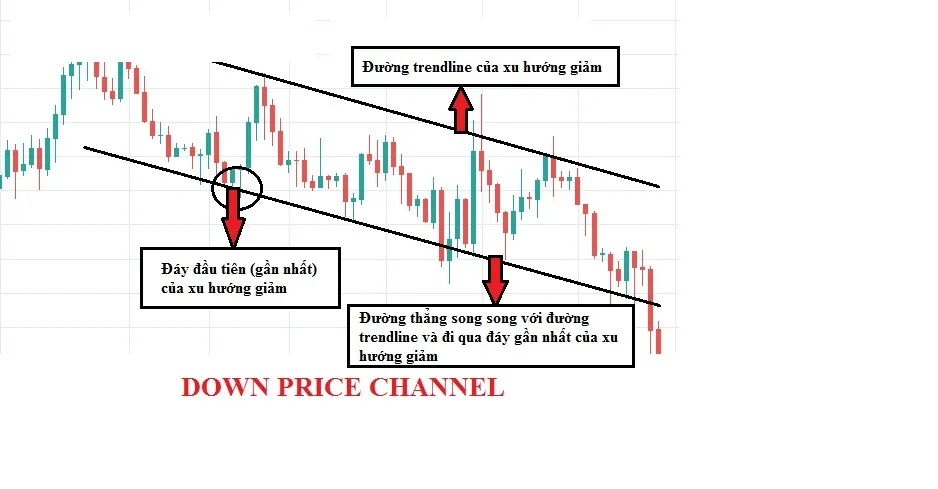
The screenshot shows the Vietnamese-language interface; the buttons and labels sit in the same places in the English one.
Just as with the rising price channel, in a falling price channel most of the prices of the downtrend fit neatly between the 2 lines. This channel is broken when price moves outside one of the 2 trendlines and reverses upward, or forms a sideways trend, or starts a new downtrend with a new falling channel.
Sideways price channel (Sideway Price Channel)
A sideways price channel forms when price swings up and down without a clear direction and moves inside a given range, with highs that are almost equal and lows that are almost equal. You draw a sideways price channel the same way you draw horizontal support and resistance lines, because a sideways market is defined by 2 boundary lines, one above and one below. The upper trendline is drawn by joining the highs, and the lower trendline is the straight line joining the lows, so that the 2 trendlines are parallel.
A sideways price channel is broken when price moves outside one of the 2 trendlines to form a downtrend, an uptrend or a new sideways stretch with a new channel.
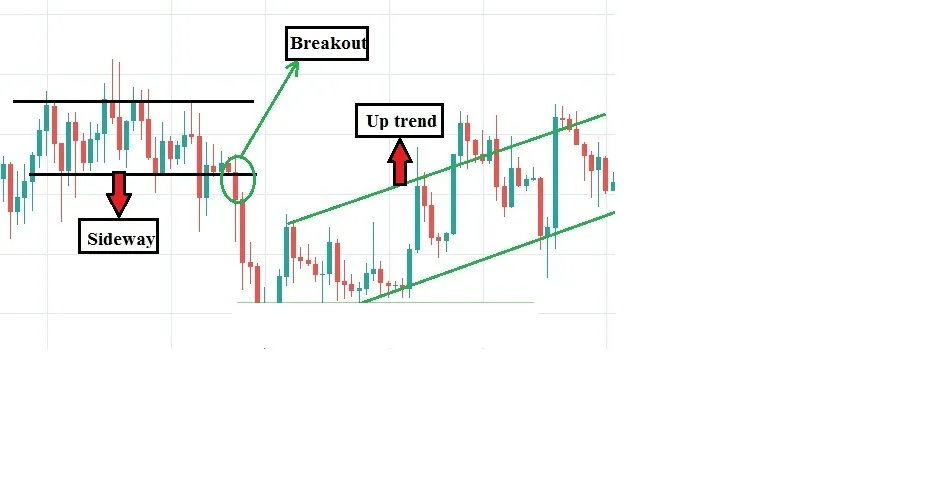
The sideways price channel is broken and price starts an uptrend.
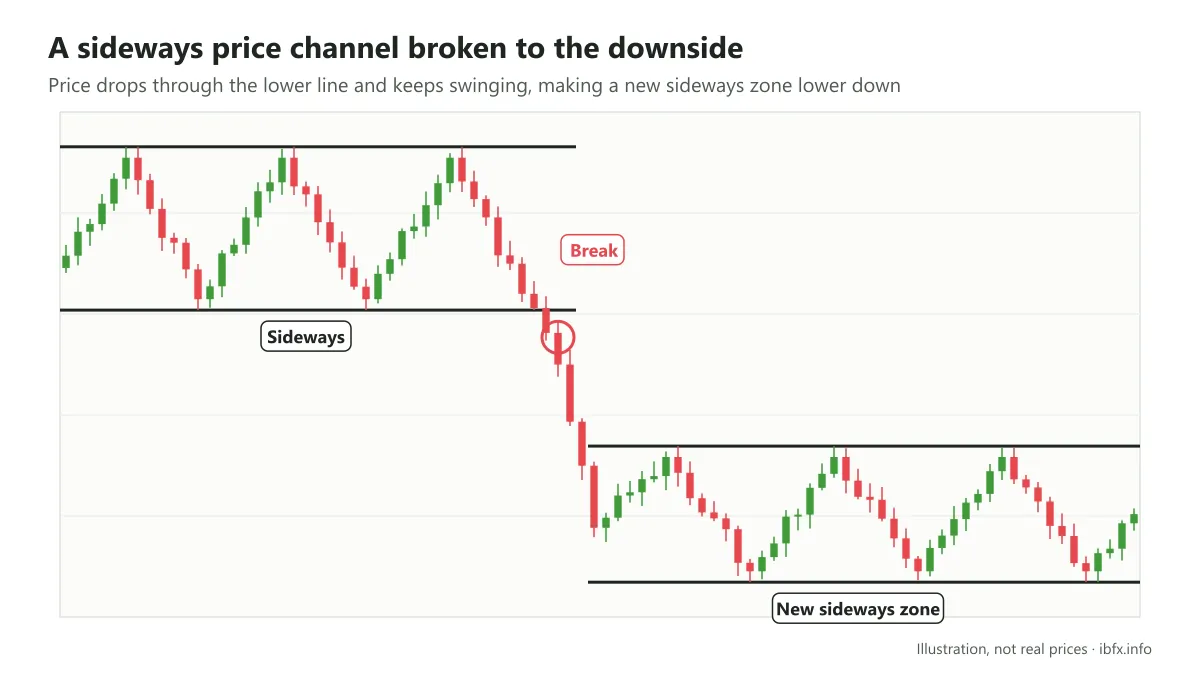
The sideways price channel is broken when price drops hard through the lower trendline, and then keeps moving inside a given price range, making a new sideways stretch with a new sideways price channel.
A few points to watch when you draw a price channel
- For a rising or a falling price channel you have to draw the trendline of the rising or falling trend first, which means the lower line (uptrend) or the upper line (downtrend), and only then the other line. The main trendline of the trend has to be drawn by the rules for identifying a trendline; the other line only has to meet 2 conditions: parallel to the first line, and running through the nearest high or low of the trend.
- Do not force the price channel to follow what you want, which can distort what the trendline is telling you and lead to trades that do not work.
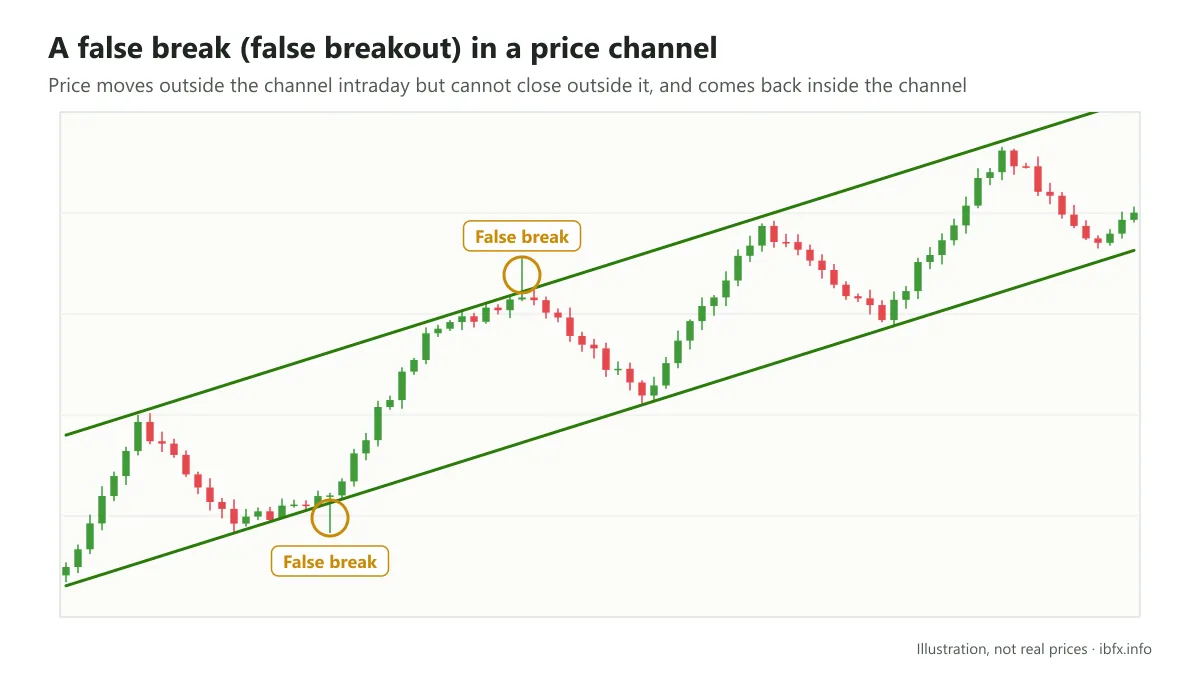
- Not every price has to fit neatly inside the price channel. Prices that sit outside it without breaking the channel are exactly what a false break (false breakout) is.
How to trade with a price channel
The 2 trendlines of the price channel act as barriers: the upper one becomes a resistance level, while the lower one is a support line. So trading with a price channel is the same thing as trading with resistance and support.
There are 2 common ways to trade with a price channel:
- Trading with the trend
- Trading the break
Trading with the trend
Trading with the trend means that in an uptrend you should only wait for price to touch the support level to place a Buy, and should not place a Sell when price touches the resistance level. And the other way round: in a downtrend you should only wait for price to touch the resistance level to enter a Sell, and should not place a Buy when price touches the support level.
The reason you should not trade against the trend is that inside a given uptrend or downtrend, the retests running the other way are only small corrective waves before price goes back to following the main trend, so the chance of making a profit out of these corrections is very low and the risk is high.
Here is how to trade it:
- In an uptrend: enter when price touches the support line (the lower trendline) for the 3rd time or later, because a support or resistance line is strong when price has touched it and turned back at least 2 times. Put the stop loss at the nearest low before that, and when price rises and touches the upper trendline, close the position to take profit.
Example:
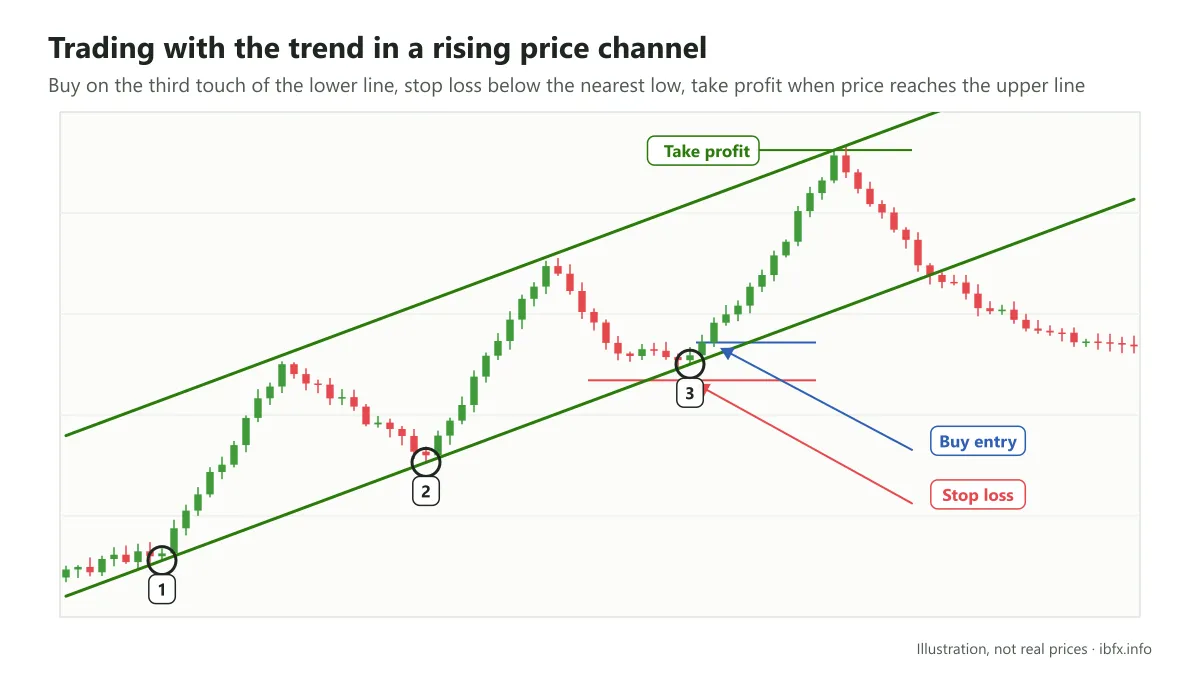
Price touched the lower trendline and turned back 2 times in a row (positions 1 and 2), which shows this is a strong support level. Your job now is to wait for price to come back and test the lower trendline once more, and then enter a Buy.
Position 3 is where price touches the lower trendline. Enter when the bearish candle has just closed, and put the stop loss below the entry; in this situation you can put the stop loss at the lowest and nearest price before it (as in the picture above). The profit target is where price rises and touches the upper trendline. In this case, if you do not want to take the risk and you wait for a bullish candle to confirm right after price touches the lower trendline, the profit you get is very small, because the confirming candle has a fairly long body.
- In a downtrend: enter when price touches the upper trendline for the 3rd time or later. Put the stop loss at the nearest high before that, and close the position to take profit when price falls and touches the lower trendline.
Example:
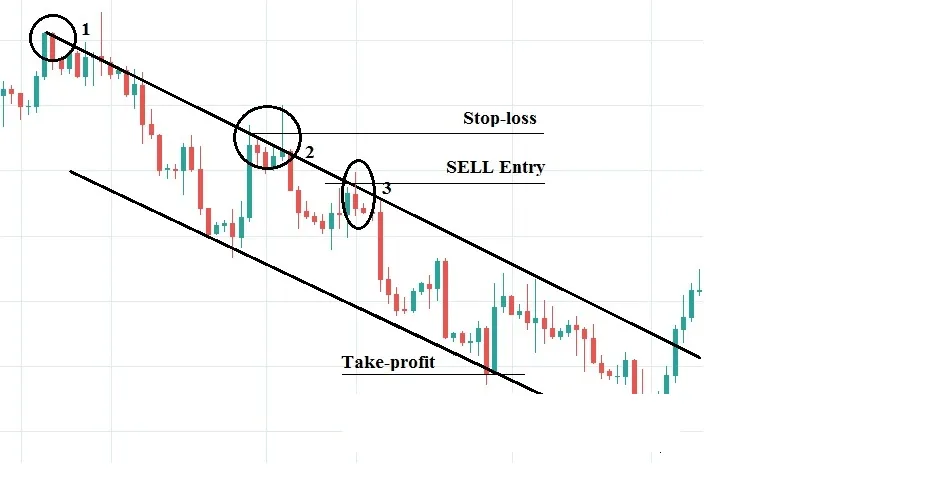
The upper trendline in this case acts as a strong resistance level, because price had already touched this line and turned back at least 2 times. When price touches the upper trendline once more, that is your signal to enter a Sell.
In this situation you can enter as soon as price touches the resistance line, or wait for a confirming candle (a bearish one) to appear as well and enter when that confirming candle has closed. Here the difference in profit will not be large, because the confirming candle has a short body, unlike the case in the example above.
Put the stop loss at the nearest high before that, and the profit target is the point where price touches the lower trendline.
- In a sideways trend: trading with a sideways price channel works the same way as trading a trendline in a sideways trend. You can also read the article What is sideways, or a sideways market?
Trading the break
At some point the resistance and support levels stop working, the price channel is broken, price leaves the range between the 2 trendlines and starts a new trend. How to trade when price breaks the trendline and reverses is covered in the article about the trendline and in What is a breakout?
In this article we will show you how to trade the signal of a price channel break together with the trend of a higher timeframe.
If price is moving in a given uptrend or downtrend on the higher timeframe, the waves inside that higher timeframe will form a trend on a smaller timeframe.
Example: on the H4 timeframe, price is in an uptrend. Inside that uptrend there will be falling waves. Each falling wave forms a downtrend on a smaller timeframe such as H1, M30 or M15.
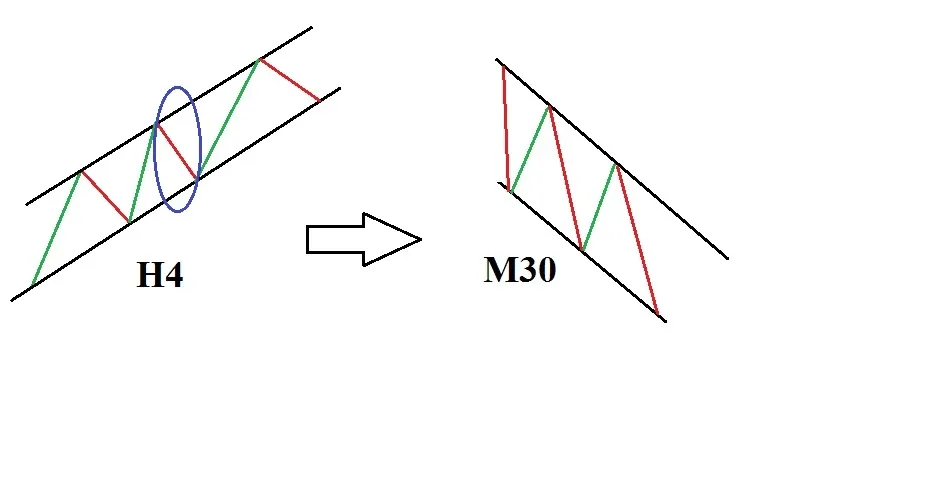
Here is how to trade it:
- Identify the overall trend on the higher timeframe.
- If it is an uptrend, then on the smaller timeframe only trade the signal of a falling price channel being broken (entering a Buy), because we are expecting price to reverse upward and go back to following the overall trend of the higher timeframe. The other way round with a downtrend on the higher timeframe: you should only trade the signal of a rising price channel being broken (entering a Sell), expecting price to reverse and go back to following the overall trend of the higher timeframe. This way of trading both runs with the trend of the higher timeframe and takes the chance of profit when price breaks important levels on the smaller timeframe.
Example:
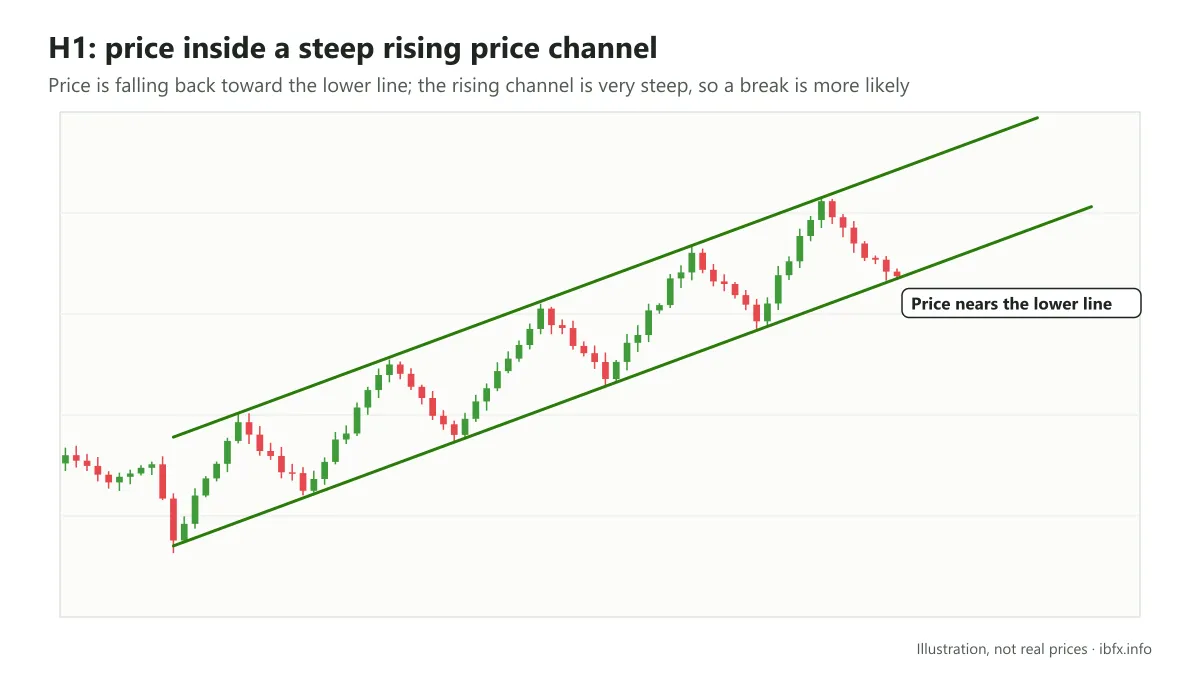
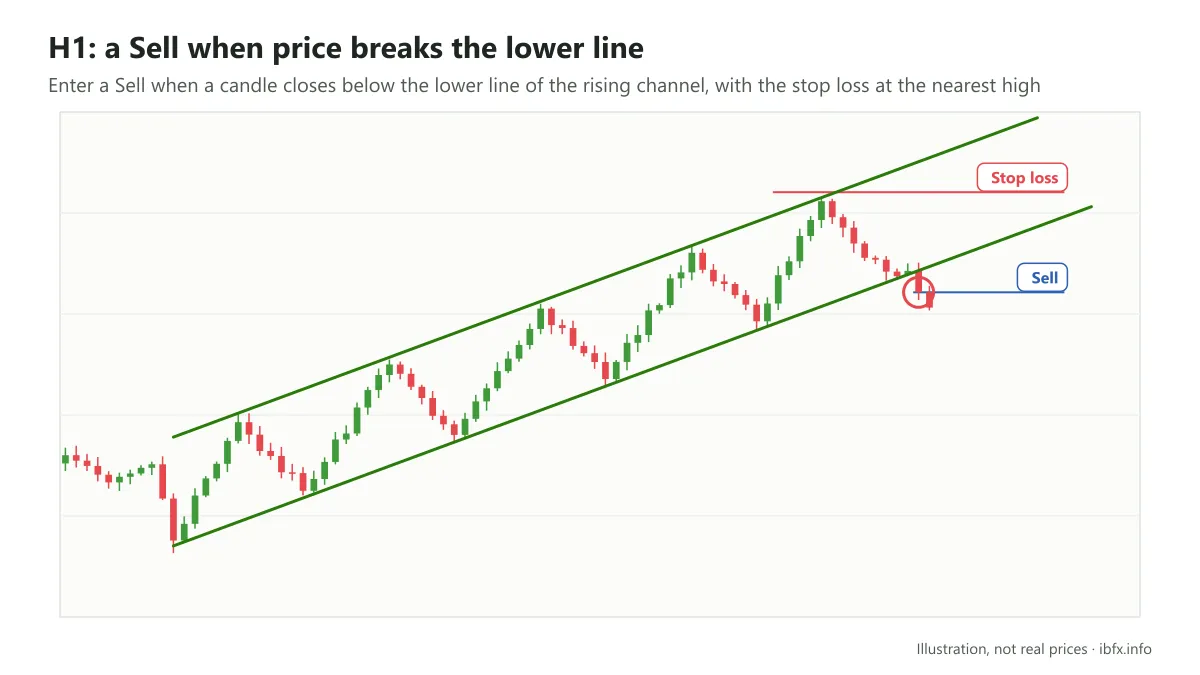
The picture above is the price chart on the H1 timeframe. Price is in an uptrend, so you draw the price channel for that uptrend. The lower trendline is a strong support level, because price has touched it and turned back several times. Right now price is falling and tending toward the lower trendline; but this uptrend has held for a fairly long time, so will the barrier at the support line still be strong enough to keep pushing price up, or will the channel be broken and a new trend start?
In this case, pay attention to the slope of the price channel. This rising channel is fairly steep, which shows that the chance of the channel being broken is higher than with a shallow slope, so in this case we should lean toward the channel being broken.
To be more certain of that reading, you then watch how price behaves on the higher timeframe.
Watching how price behaves on the H4 timeframe, price is in an overall downtrend, and the uptrend on the H1 timeframe is a rising wave inside the downtrend on the H4 timeframe. The upper trendline of the falling price channel is also a strong resistance level at this point, so price is likely to turn back when it touches this trendline. A signal that price turns back at the resistance on H4 confirms how far you can rely on the break and reversal signal on H1.
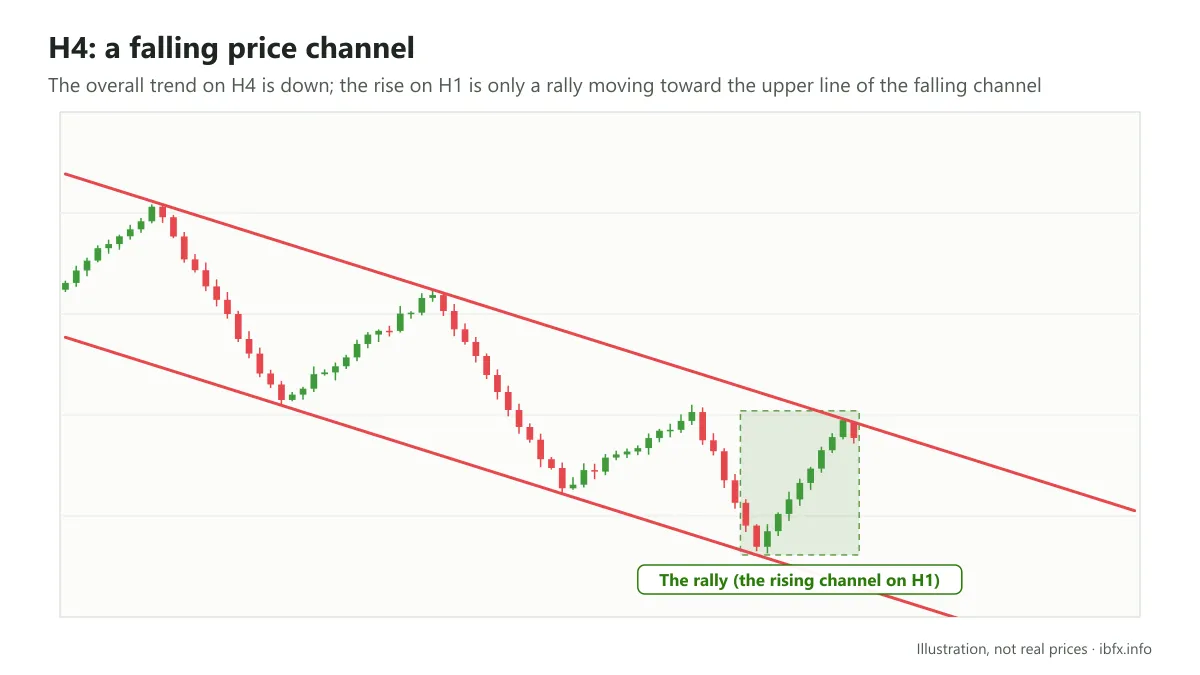
Now, back on H1, your job is to wait for price to break the lower trendline and then enter a sell. Put the stop loss at the nearest high of the uptrend, as in the picture below:
And the result is:
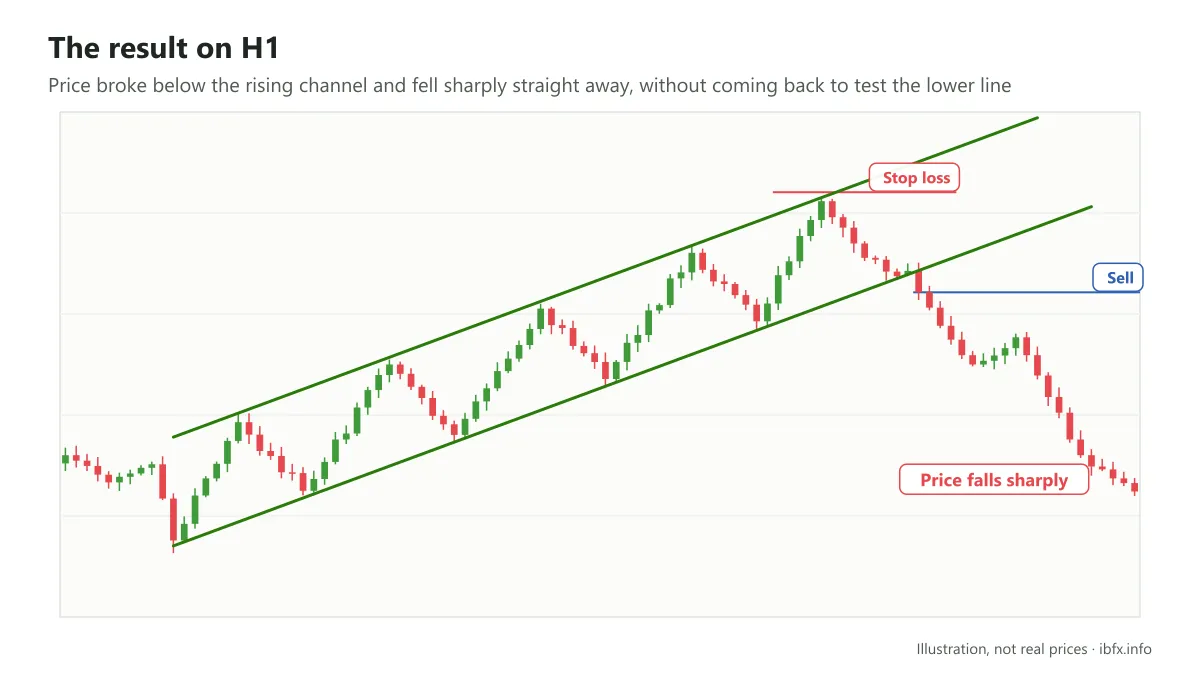
If in this case you had waited for a pullback back to the support level before entering, you would have missed the chance, because price did not pull back but fell sharply straight away. Even so, there are also many cases where price breaks and then comes back inside the channel (a false break); waiting for the pullback helps you avoid some of those, at the price of missing a chance now and then.
The result on the H4 timeframe:
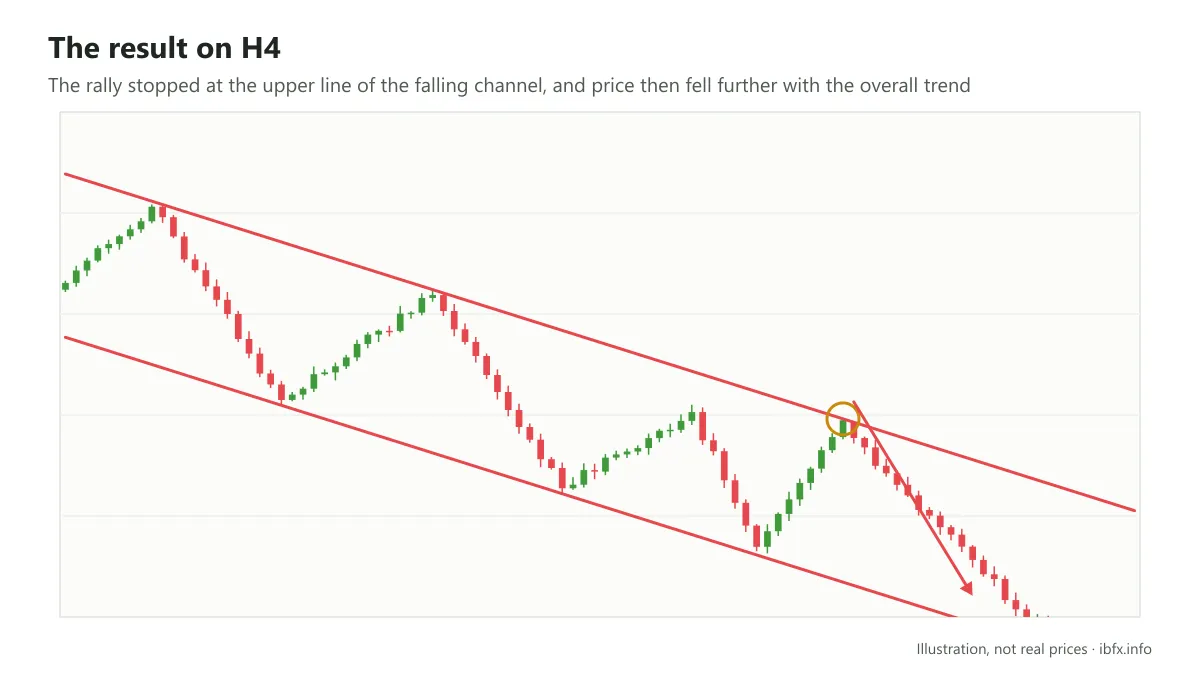
Those are the ways of trading with a price channel that we wanted to show you. The examples in this article were chosen after the price action was already known, so they look very clear; when you trade for real, the signals will not be so easy to spot. Always set a stop loss, and practice on a demo account to build your own experience, because no method is perfectly accurate.