On this page
In this article we introduce the wedge, a price pattern that shows up fairly often in forex trading. What makes the wedge special is that it can act as a continuation pattern or as a reversal pattern, depending on the trend that came before it.
The article walks you through the 2 kinds of wedge: the rising wedge and the falling wedge. Because the 2 kinds are quite alike, the theory is set out together, while the trading guide is split by kind so that you can follow it more easily.
What is a wedge pattern?
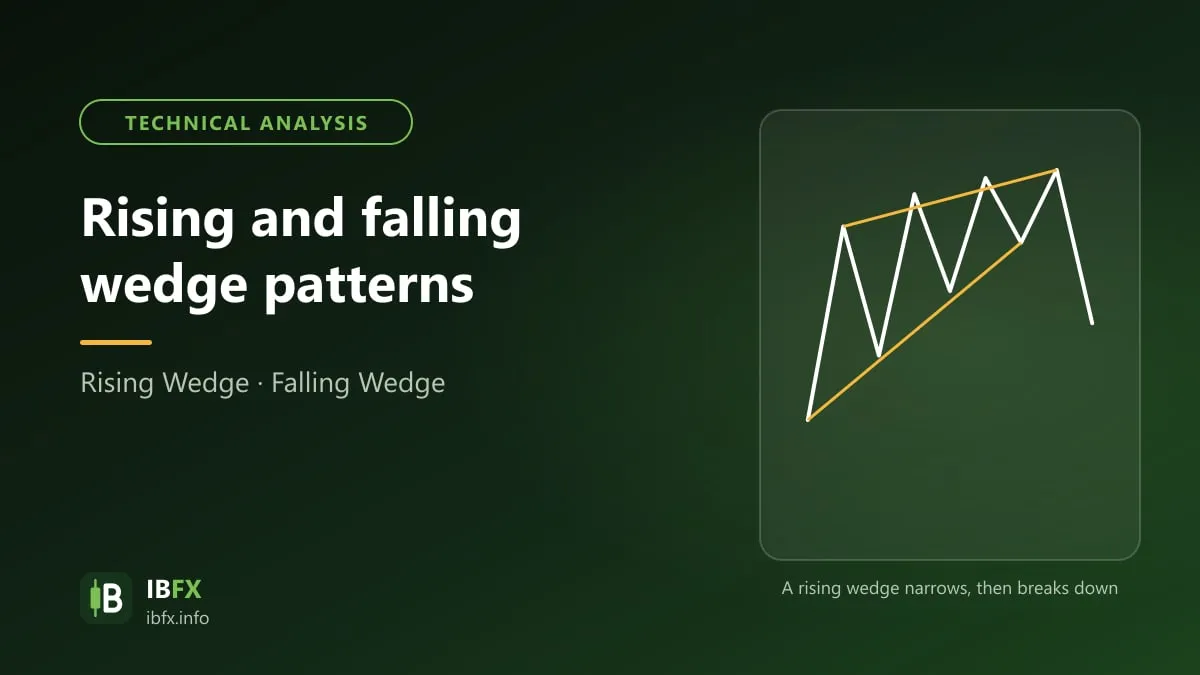
A wedge pattern is a price pattern bounded by 2 trendlines that slope the same way (both up or both down) and gradually converge, producing a shape like a wedge.
How the wedge is built
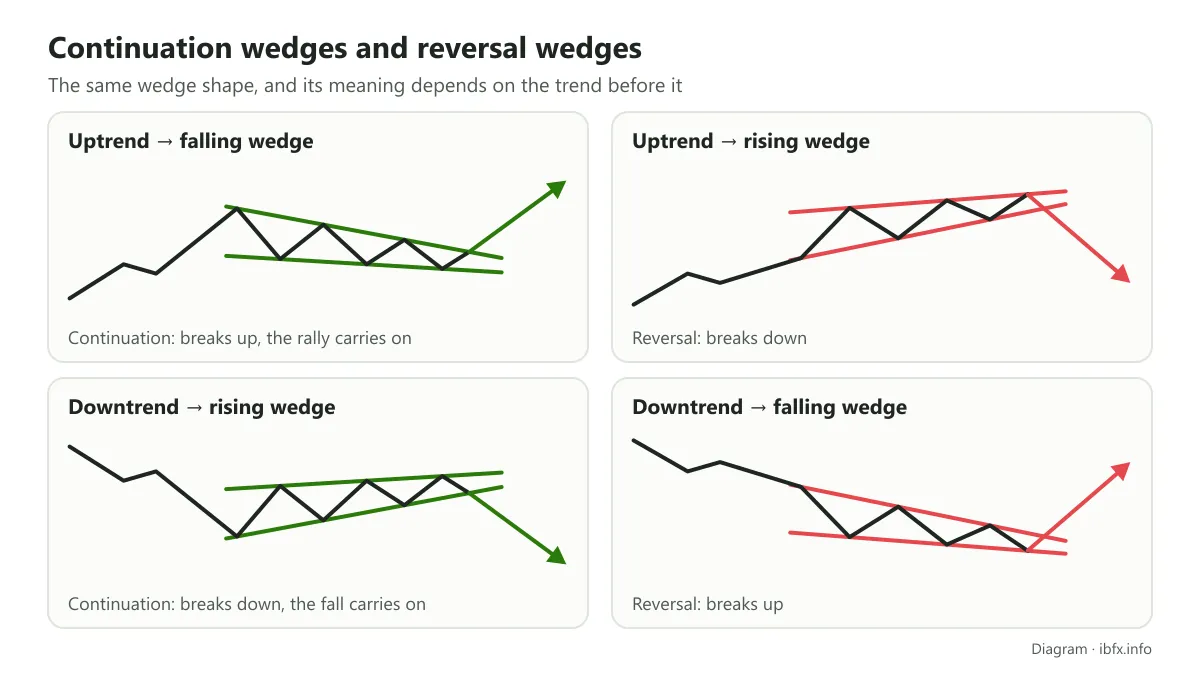
When a wedge forms, price gets squeezed between the 2 trendlines. So the heart of a wedge is those 2 trendlines: the upper one acts as the resistance line and the lower one acts as the support line, and both slope up or both slope down.
The slope of the 2 lines is the single most important thing that tells a wedge apart from other patterns. Put the slope together with the trend that came before, and you will know whether that wedge is more likely a continuation pattern (price carries on in the old trend) or a reversal pattern.
From here the pattern splits into 2 kinds: the rising wedge, whose 2 trendlines both point up, and the falling wedge, whose 2 trendlines both point down.
And from here there are 2 ways to trade it: trading the wedge as a continuation and trading the wedge as a reversal.
So a wedge is made of 2 trendlines and the price area between them. In a rectangle pattern price swings between 2 parallel horizontal lines; in a wedge price moves in waves inside an area that keeps narrowing, making higher highs and higher lows (rising wedge) or lower highs and lower lows (falling wedge).
What makes a wedge form?
The wedge is a compression pattern, so the stretch in which a wedge takes shape is also a stretch of consolidation before price breaks out. Unlike a rectangle, where the highs and the lows sit level with one another, in a wedge price still makes higher or lower highs and lows, but the swing range keeps getting narrower.
The psychology behind the rising wedge
A rising wedge usually breaks downward. Inside a rising wedge price still makes higher highs and higher lows, but the highs rise more slowly than the lows, so the price area narrows toward the end of the wedge. That shows that each time buyers push price higher, they only cover a shorter distance than before, which means buying pressure is fading.
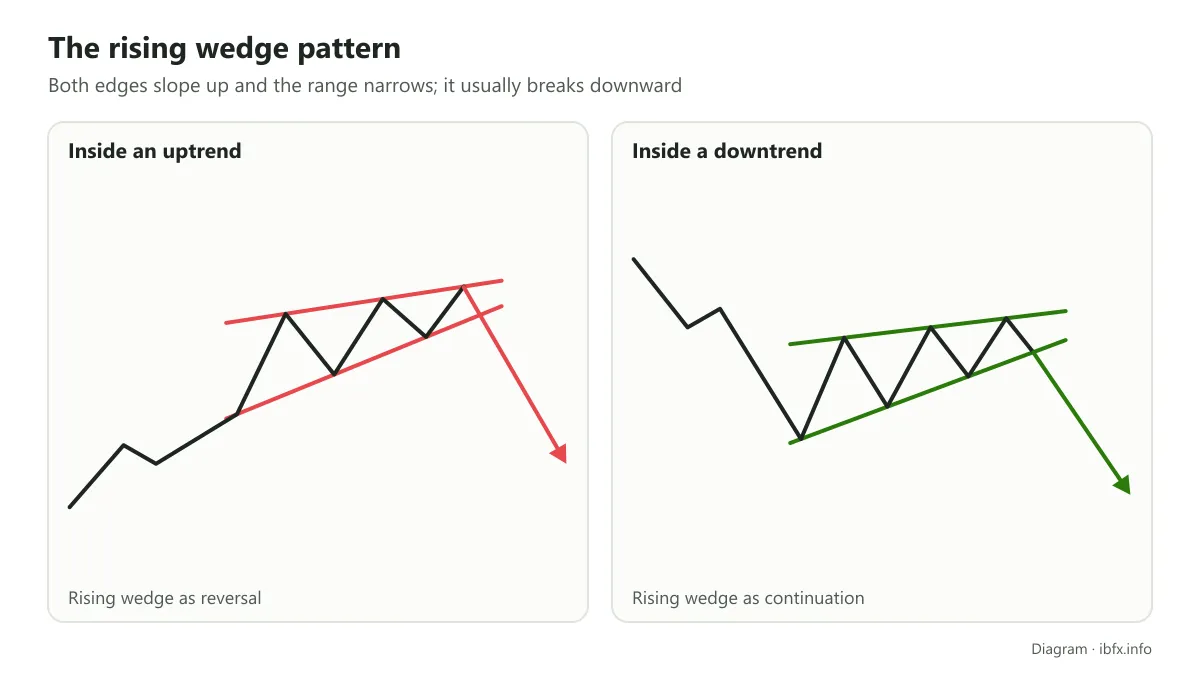
If the trend before it was a downtrend, the rising wedge is usually only a weak bounce; when price breaks below the lower edge of the wedge, the old fall usually carries on.
If the trend before it was an uptrend, the rising wedge is a sign that the uptrend is running out of strength and may reverse downward. In the experience of many traders, the fall after a continuation rising wedge (one inside a downtrend) is usually stronger than after a reversal one, but that is not always true. We will give concrete examples in the trading guide.
The psychology behind the falling wedge
The opposite of the rising wedge, the falling wedge is built from 2 trendlines that both slope down.
Inside a falling wedge price still makes lower highs and lower lows, but the lows fall more slowly than the highs, and the price area narrows. That shows that each time sellers push price lower, they only cover a shorter distance, which means selling pressure is fading and many investors are hesitating or standing aside to watch.
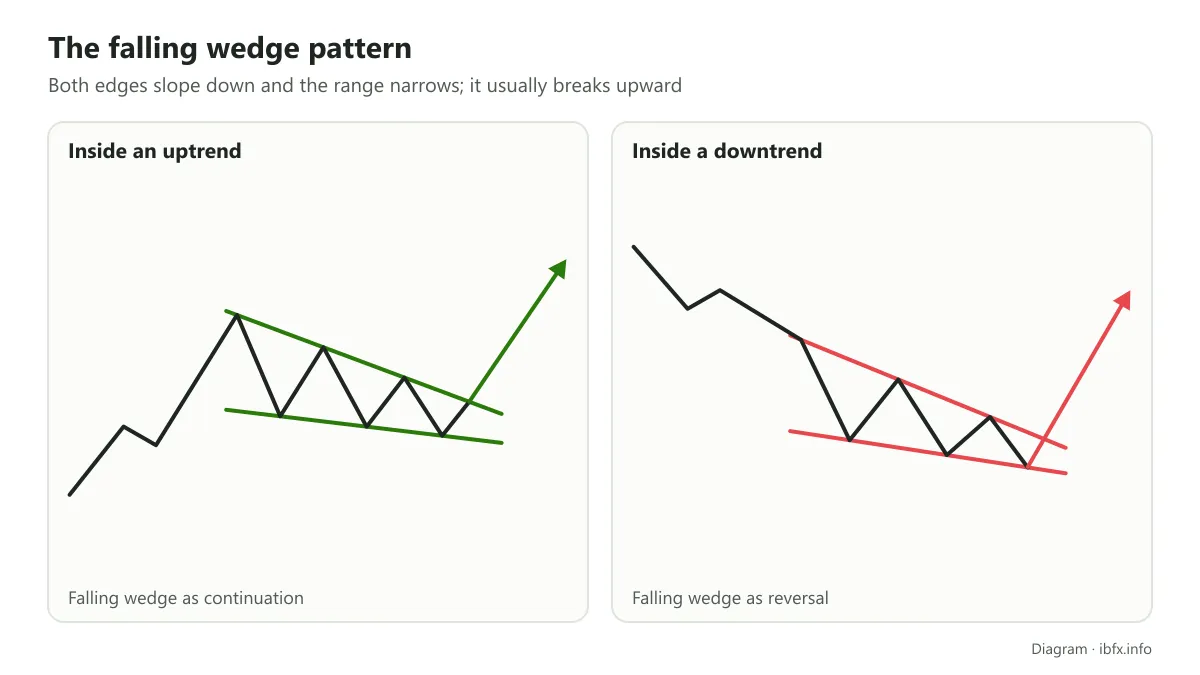
When buyers are strong enough to break the upper edge of the wedge, price usually jumps up fairly hard.
As with the rising wedge, for the falling wedge the continuation kind (which shows up inside an uptrend) usually gives a stronger rise than the reversal kind (which shows up at the end of a downtrend), although that is not always the case.
What makes a textbook wedge?
So a wedge is made of 2 trendlines, and those 2 lines have to point the same way: if one goes up the other goes up, if one goes down the other goes down, and at the same time they converge.
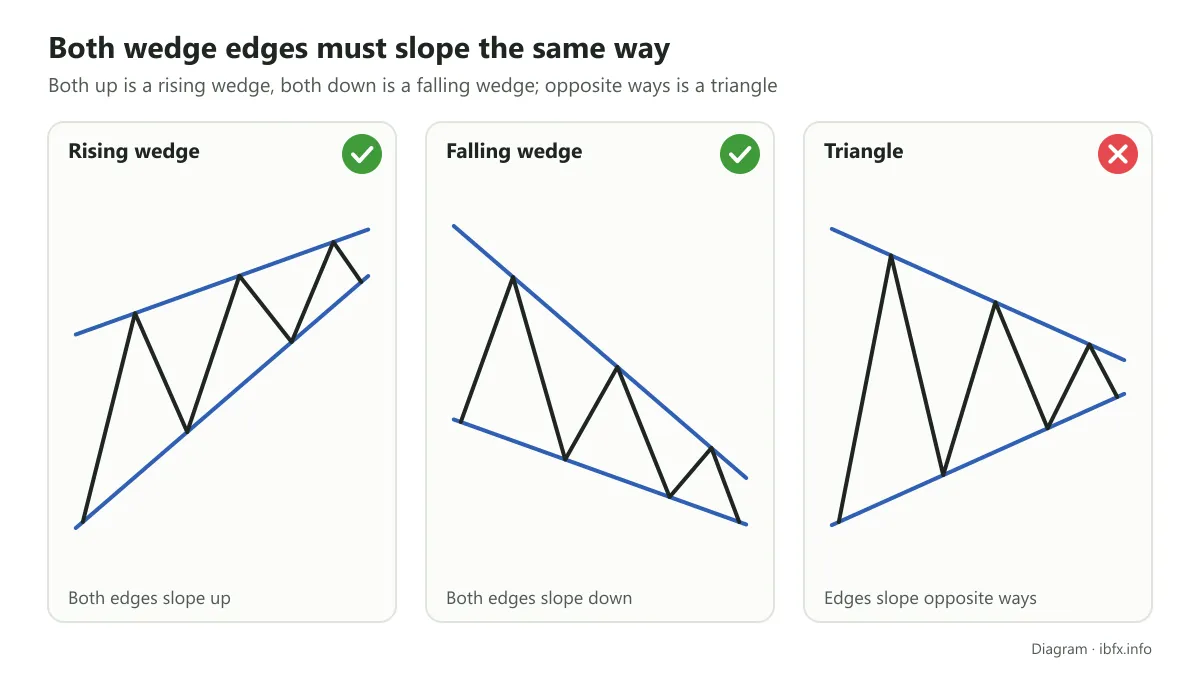
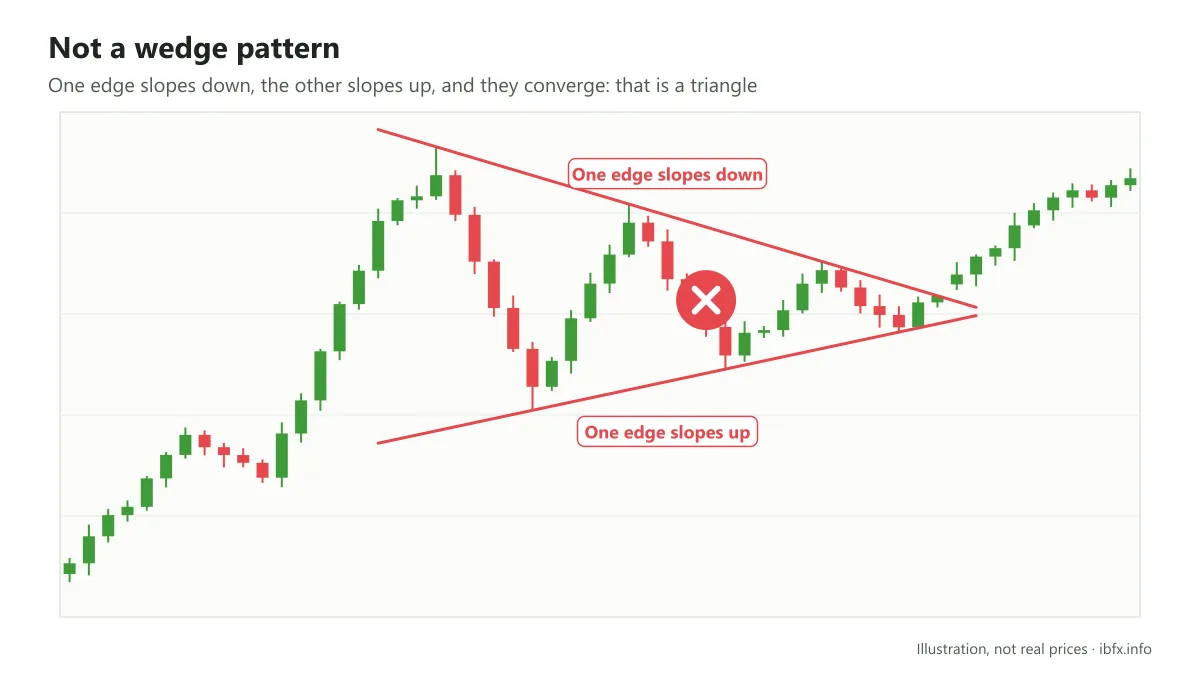
If 1 line points up, the other points down and they converge, that is a triangle pattern (or a pennant if it is a small, short-term pattern after a strong run in price). If the 2 lines are parallel, that is a price channel or a flag pattern.
In the image below, for example, one line slopes down and the other slopes up, so this is not treated as a wedge pattern.
Beyond that, according to Thomas Bulkowski, the author known for his statistics on price patterns, price ought to touch the 2 trendlines at least 5 times in total, meaning at least 3 times on one line and 2 times on the other.
That makes sense, because 2 points are all it takes to draw 1 trendline, but at least 3 touches are needed before that trendline is confirmed.
When price touches 1 line at least 3 times, that trendline carries more meaning, and it is worth still more when you put it together with the trend that ran before the wedge formed.
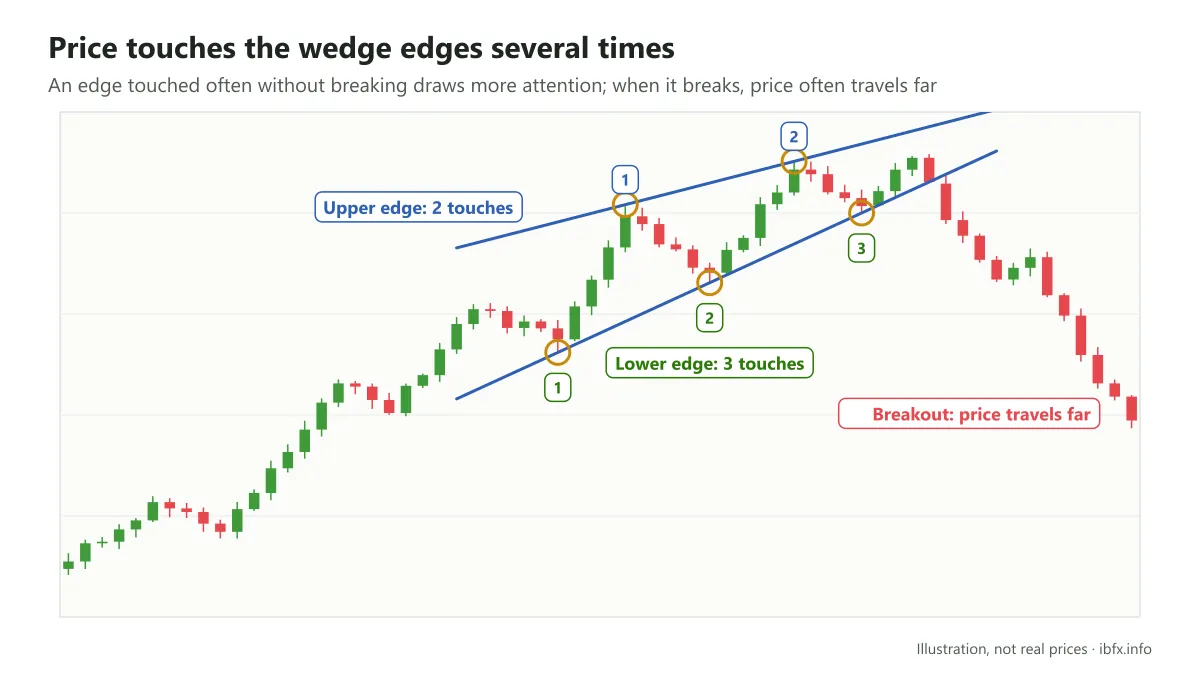
As in the example below, price touching the support line many times gives you 2 pieces of information:
- It confirms the trendline.
- The more times price touches a trendline without breaking it, the more traders pay attention to that line; and when price does break it, price often travels quite a long way.
Whichever kind it is, once the 2 trendlines are joined up, the highs and lows inside the wedge still have to follow the formula:
- The rising wedge: it makes higher highs and higher lows, with the range narrowing.
- The falling wedge: it makes lower highs and lower lows, with the range narrowing.
Also according to Bulkowski, on the daily chart the time a wedge takes to form is usually at least about 3 weeks and usually no more than 4 or 5 months.
If the pattern forms in less than 3 weeks, it may be another kind of pattern such as a pennant. As you can see, the wedge is usually the longer pattern, while the flag is a short-term one.
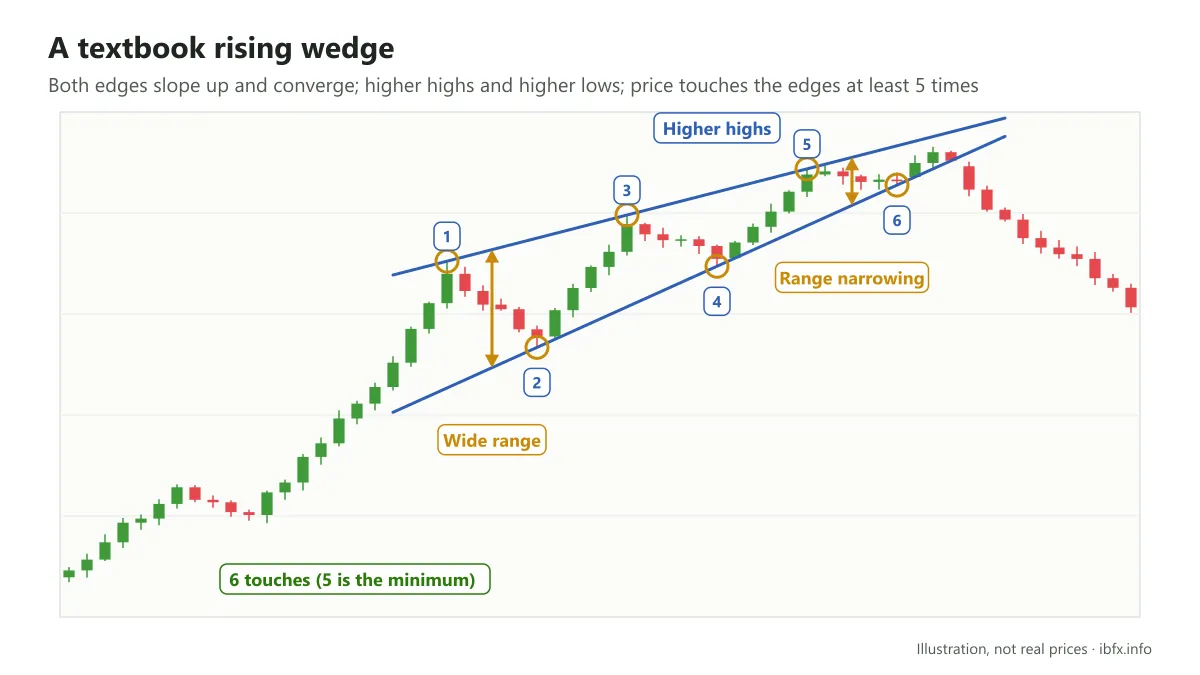
So the keys to a textbook wedge are: first, price touches the 2 wedge edges often enough; second, the 2 edges have to slope up together or down together and converge.
If you trade short swings on small timeframes, some traders accept a wedge with fewer touches (3-4 points in total, for example).
But note this: the fewer the touches, the higher the chance the pattern is wrong and the breakout is false. So you need to bring in several other factors, always place a stop loss, and take profit according to your plan.
How to trade the wedge pattern
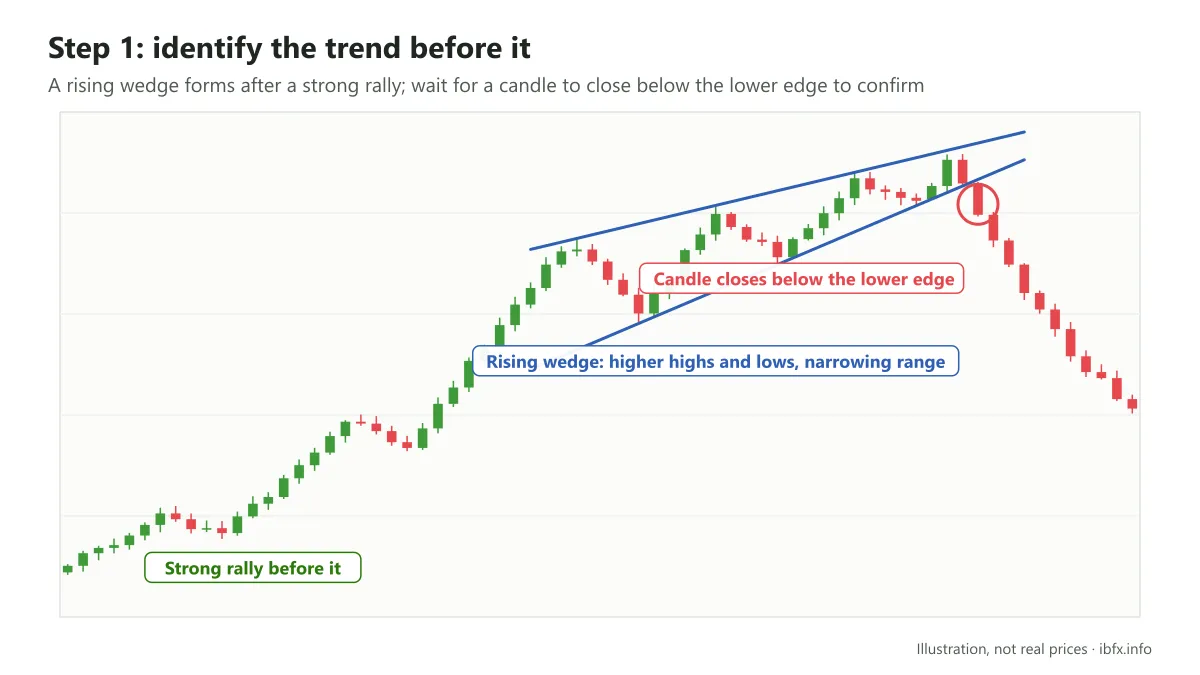
Step 1: identify the trend that came before. This step is required in every case.
Take the example below: the trend in front of the pattern is a very strong rally.
Step 2: check whether it really is a wedge, using the criteria in the section before to avoid mixing it up with something else.
Step 3: wait for a candle to close outside the wedge edge (for a rising wedge that means closing below the lower edge), like the circled spot; only then is the pattern confirmed and only then do you enter.
Taking profit on a wedge works differently from patterns that have a neckline, and there are 2 ways:
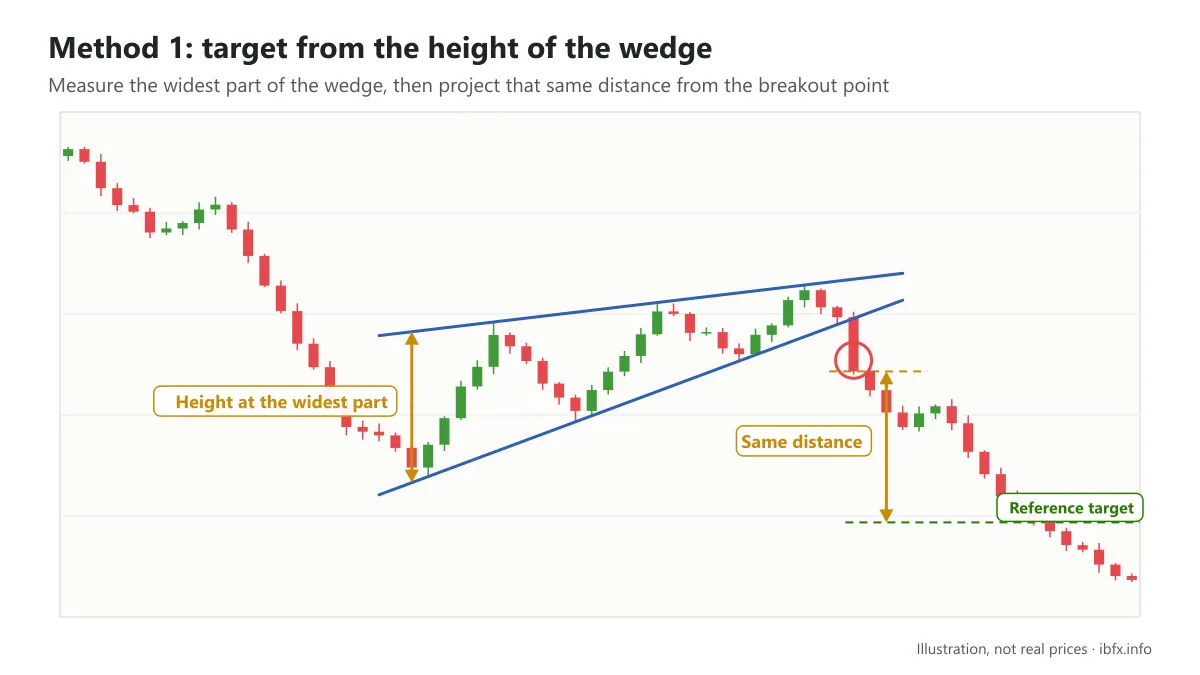
- The first way: with a balanced, clear wedge like the one below, you measure the height of the widest part of the wedge (the distance between the starting point of the upper trendline and the starting point of the lower trendline), then take that same distance from the breakout point in the direction of the breakout to get a reference target.
- The second way: with a wedge that is not balanced, where the highs and lows are far enough out of line that the measurement above is not accurate, you can take as your target the price area where the wedge started to form (the first high or low of the wedge).
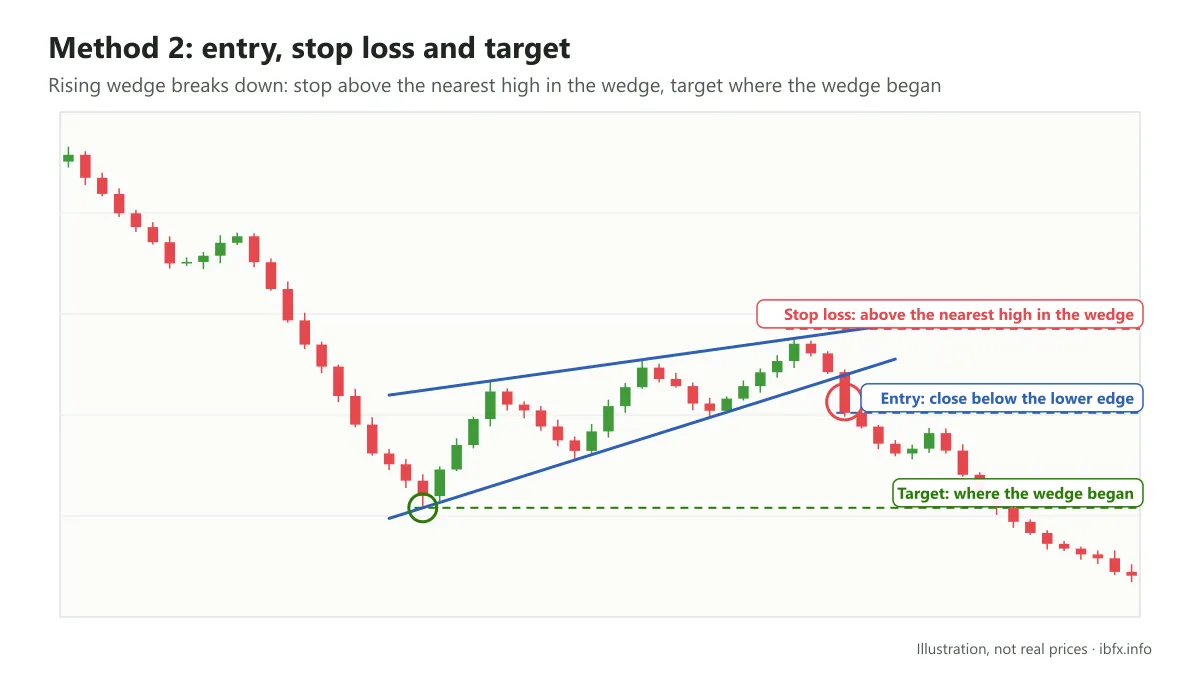
With a rising wedge (which breaks down), place the stop loss above the nearest high inside the wedge, right up against the upper edge of the wedge.
With a falling wedge (which breaks up), place the stop loss below the nearest low inside the wedge, a small distance away. Whichever way you choose, work out your position size from the stop loss distance.
Trading the rising wedge
This is a fairly clear wedge: in front of it is a strong uptrend, then price starts to squeeze into the wedge, making higher highs and higher lows one after another but with an ever narrower range, then breaks below the lower edge and reverses into a hard fall.
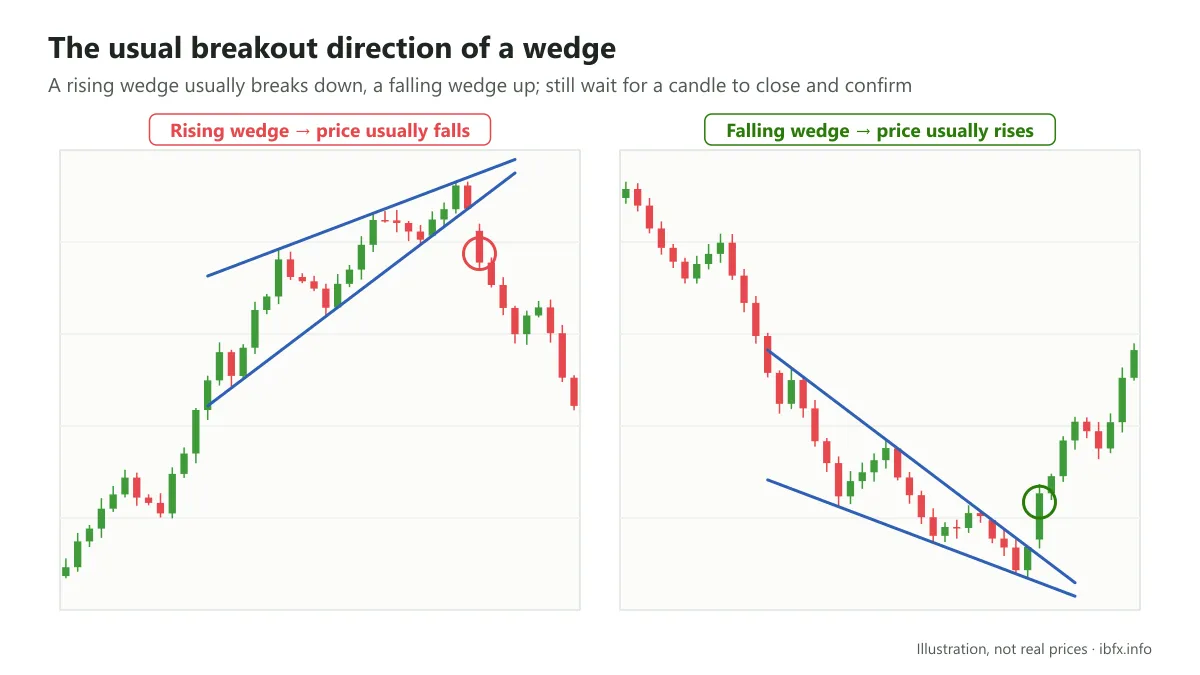
If you are a new trader, remember this: a rising wedge usually breaks downward, while a falling wedge usually breaks upward. In short: A RISING WEDGE USUALLY ENDS WITH PRICE FALLING, A FALLING WEDGE USUALLY ENDS WITH PRICE RISING. Even so, there are cases where price breaks the other way, so always wait for a candle to close and confirm the breakout direction.
As said above, a wedge can be a continuation or a reversal. In this case the trend in front was an uptrend, and after the rising wedge formed price reversed downward. The target is measured as shown below.
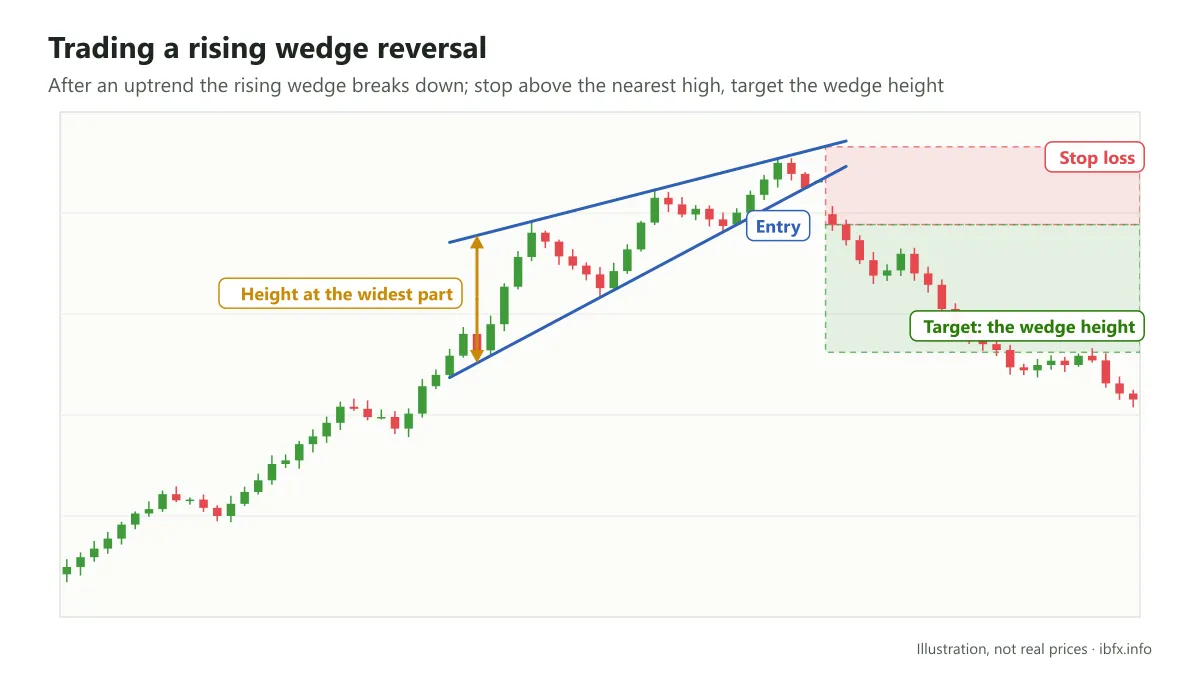
This target is only approximate. Take profit according to the plan you set out; you can take part of it once price has traveled some distance and move the stop loss to your entry point so that a trade already in profit does not turn back into a loss.
Now let us look at a rising wedge of the continuation kind.
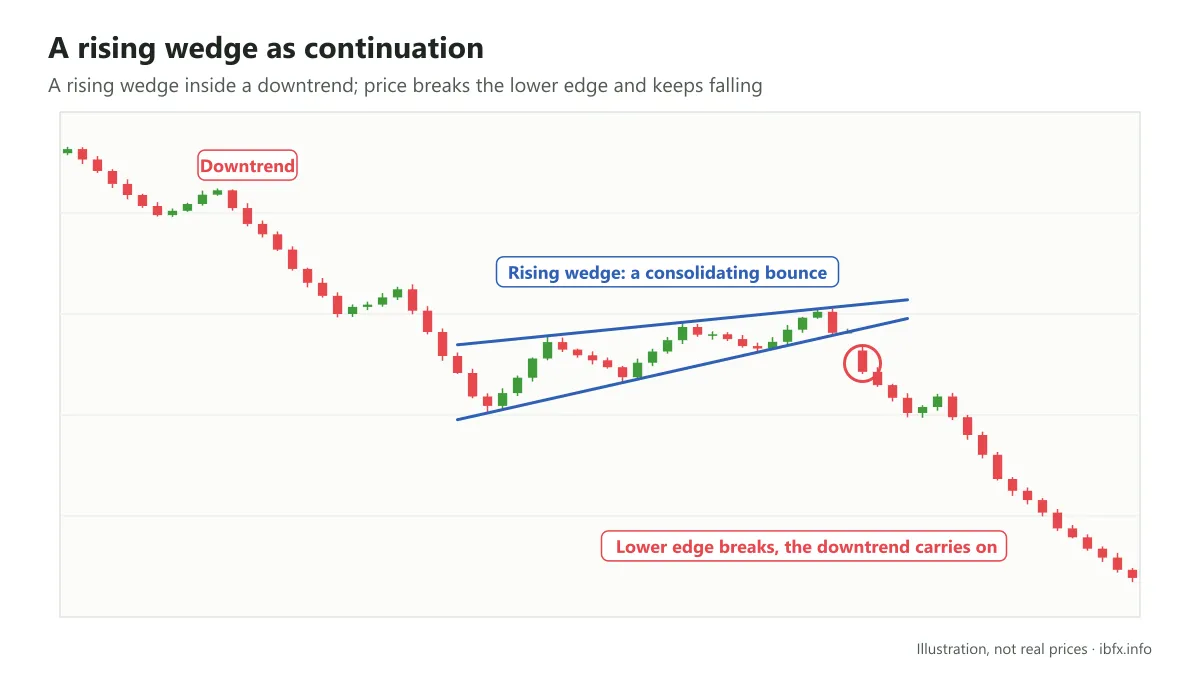
In the example above, in front of the pattern is a fall. After price broke the lower edge of the wedge, price dropped hard.
Here price is in a consolidation phase in the middle of a downtrend. Consolidation does not have to sit at a top or a bottom; it can sit in the middle of a trend as in the image above, because this is a continuation pattern.
After the wedge formed and the consolidation ended, price fell very hard.
Even so, a break of the wedge edge does not mean price runs straight on. Look closely and you will see that price broke through the lower trendline (the support line), support turned into resistance, yet price still hovered around there for a while.
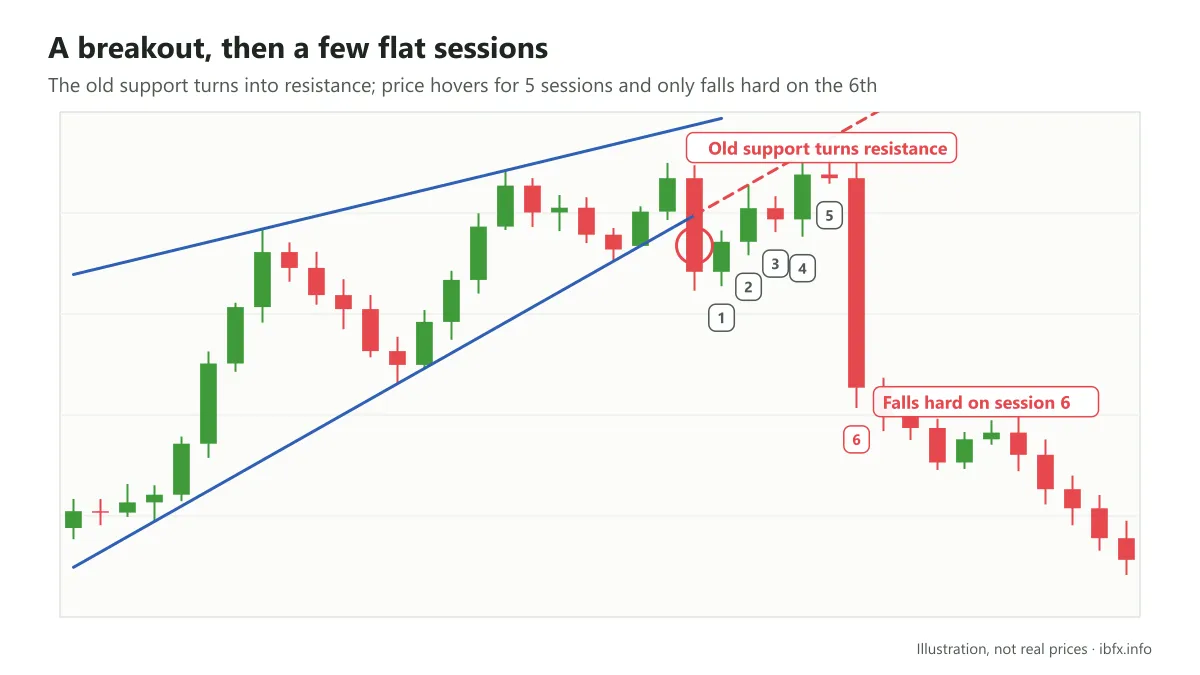
It took until the 6th session for price to really fall, so you need patience when you trade. If you set the stop loss too tight, you can be stopped out right before price goes your way; set it far away and you have to cut your position size. Choose your plan in advance and stick to it.
Trading the falling wedge
In the example below, price makes a falling wedge in the middle of an uptrend, touching the 2 wedge edges many times.
After price broke the upper trendline, price rose hard, carrying on the rise that came before.
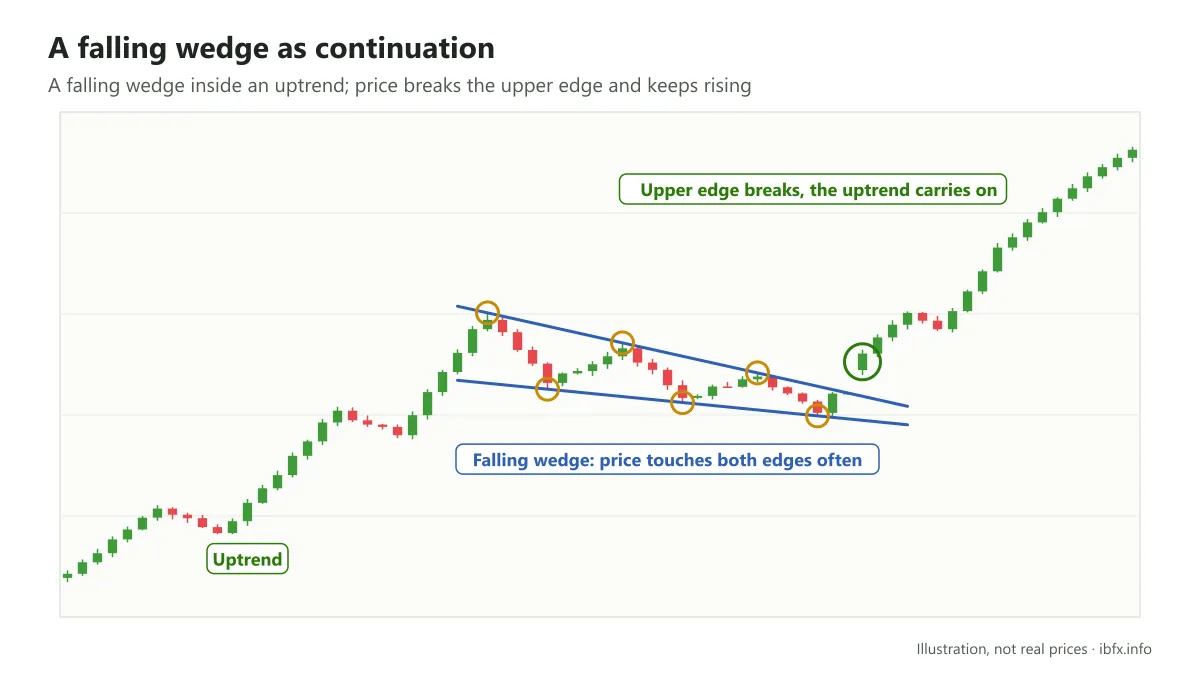
Wedges that show up in the middle of a trend like this are very easy to misread: if price then rises further it is a continuation pattern, but if price falls further that area turns into the top of a reversal. Only when price breaks out clearly do you know which way the pattern went.
So every pattern and every method is only approximate. When you trade the wedge, you ought to combine it with other indicators and tools so that more signals agree with one another.
Next is an example of a falling wedge of the reversal kind.
This is a falling wedge with 2 trendlines both pointing down, formed after price had already fallen quite a lot.
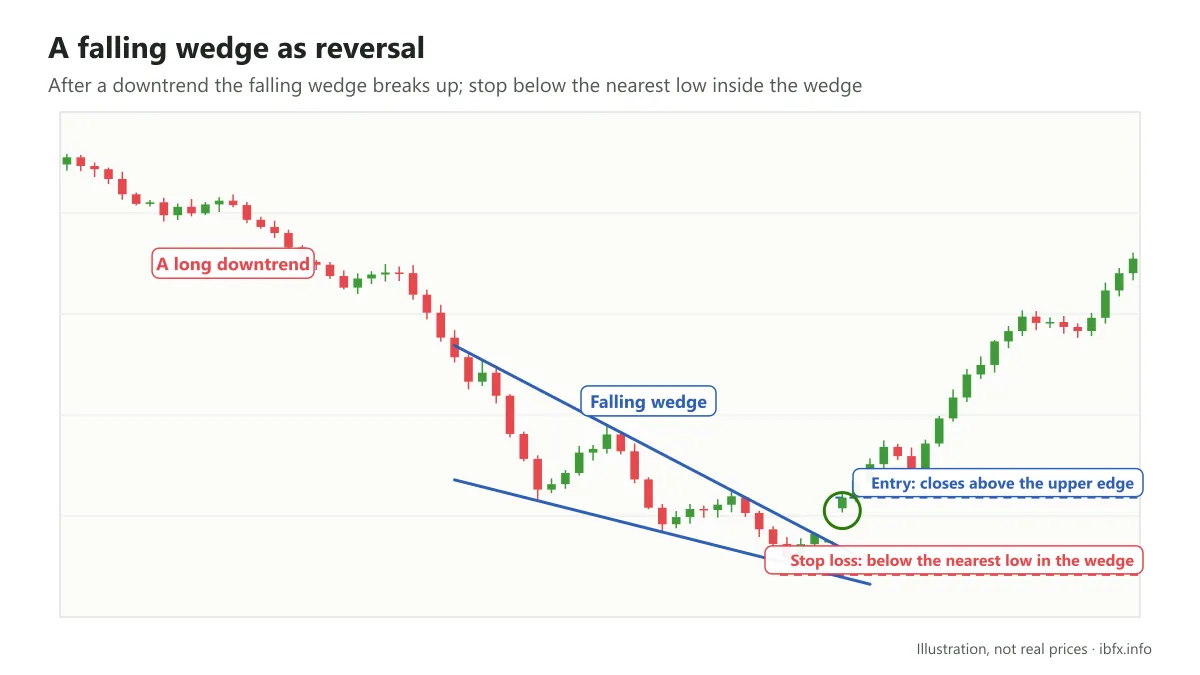
After the wedge formed and price broke the upper edge, price rose quite a long way.
Some questions about the rising and the falling wedge
Is the wedge a continuation pattern or a reversal pattern?
A wedge can be a continuation pattern or a reversal pattern, depending on the trend that came before it.
Do the 2 trendlines in a wedge always have to point the same way?
Yes. If one goes up the other goes up, if one goes down the other goes down, and at the same time they converge.
Where does the wedge tend to show up?
A wedge can show up on any timeframe, at the end of a trend or in the middle of one. On small timeframes price often squeezes in before important news such as Non-farm (the US non-farm payrolls), interest rate decisions and speeches by the Fed Chair, and many traders wait to see which edge price breaks and then trade in that direction. Trading at news time is very risky, though, because the spread widens and there is slippage; while you lack experience you ought to stand aside, and if you do trade, use only a very small position size.
The wedge shows up fairly often in forex trading, so you need a firm grasp of how the pattern is built and of what makes a textbook wedge, to avoid mixing it up when you trade. Practice spotting the pattern on a demo account first.