On this page
The double top and the double bottom are basic price patterns that turn up on the chart very often. Turning up often does not make the pattern useless, but it does mean a great many patterns that “look like” one will fail, so a trader has to know how to filter them. Let us look at the double top and the double bottom together in the article below.
Part I: The double top
What is a double top?
The double top is a reversal pattern that appears at the end of an uptrend to signal a change in price from rising to falling.
What a double top is made of
The ingredients that go into the dish called the double top, the one the trader gets to “tuck into”, are:
- An uptrend formed before it
- Two tops (of course)
- The neckline
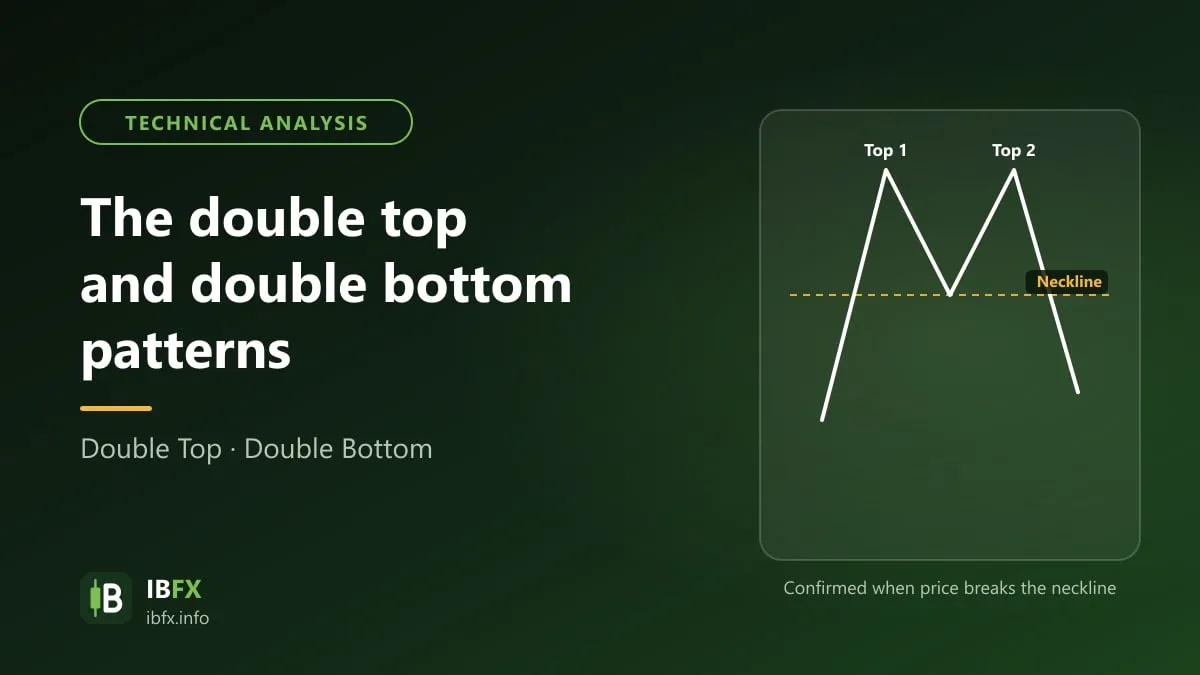
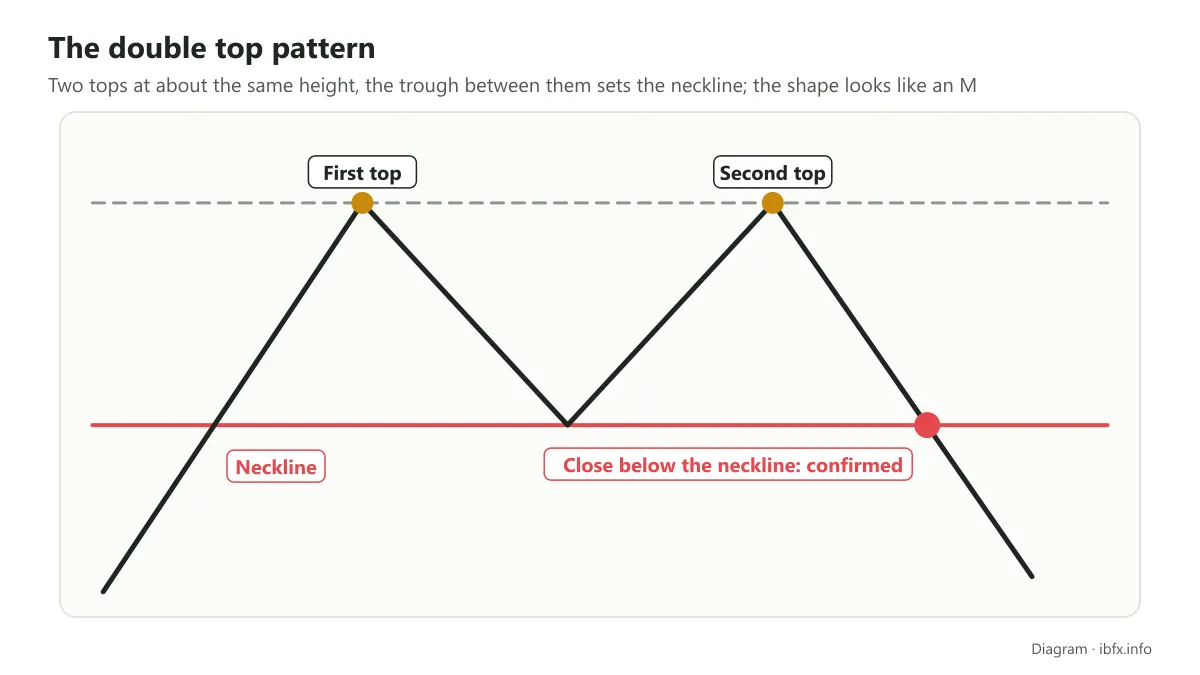
So when the price chart mixes those 3 main ingredients, the ones I have just listed, together and plates them up for the trader to look at, they look like the letter M.
When price reaches the first top it tends to turn, and the middle trough forms in that turning area. But price does not carry on down; it goes back to the uptrend it was in before and makes a second top. Two tops together with the middle trough, plus price breaking the neckline, and the double top counts as formed.
What makes a double top form?
As said above, the double top is a reversal pattern, so for it to form the trend before it has to be an uptrend. When price draws the first half of the M, that is the first top, it did not have the strength to push price any higher. So instead of being able to carry on to a higher high, price dropped.
But it seems the side in control up to then was the Buy side, plotting to “climb onto the roof and catch the chicken”, that is to push price even higher, and failing at it. Then came a leg down, which left the buyers very “hot under the collar”, out to settle it with the Sell side and looking for any way to push price up.
That is why, after a leg down that made the middle trough, the buy side tried to push price up; but it was already weak and still liked to stand out in the wind, so instead of making a top higher than the first one, the buyers could not, and made a second top only level with top 1.
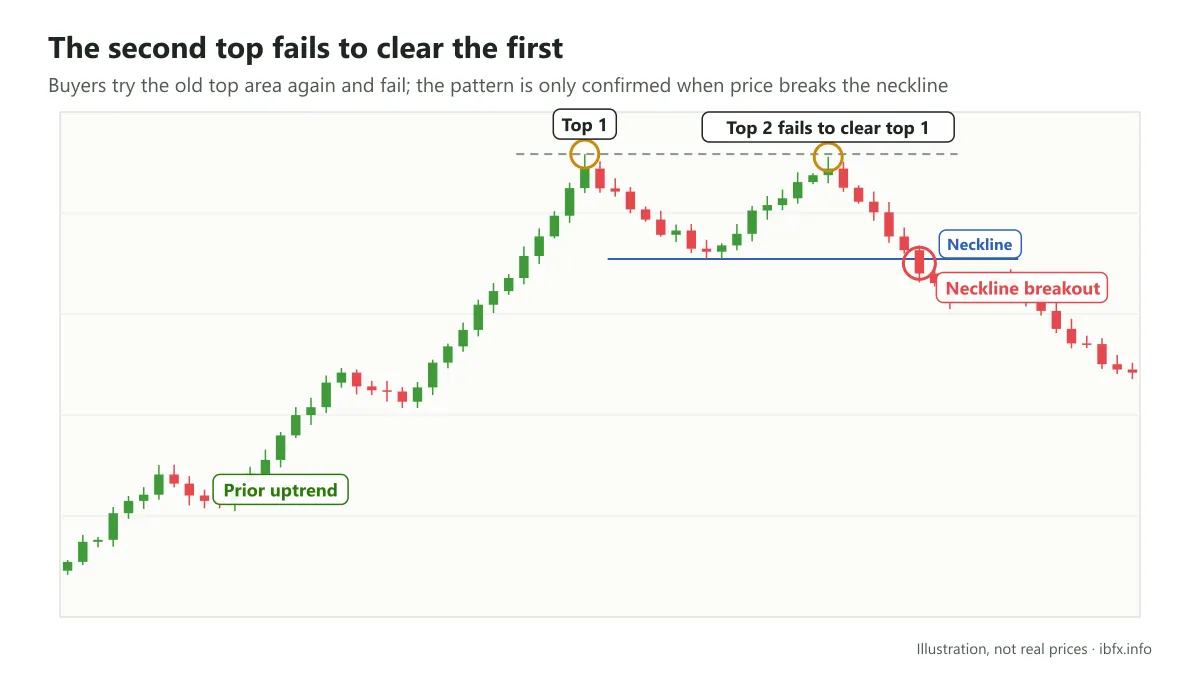
And next, there is no next for the Buy side, because the Sell side had them cornered, so in the end price fell, all the more so if price breaks the neckline.
Looking back at the pattern above, you can see that price badly wanted to break top 1, so after falling it turned back up to test that resistance again. At that resistance there are two possibilities: if resistance is broken, that means a new high above the old one. If that fails, though, and the old top is not broken or the resistance line is not pierced, a top level with the first one is formed right there, and from that point a double top may appear, a signal that a downtrend may follow (once price breaks the neckline).
What makes a good double top?
The double top shows up densely on the chart. Both the double top and the double bottom are patterns you run into very easily.
So if you do not look closely you will very easily run into the “fake” version of the pattern.
So what are the criteria for judging a double top to be a good one?
- First there has to be a clear trend before it; for a double top the trend before it has to be an uptrend:
Price keeps making higher highs and higher lows, and at some point, when it cannot carry the rally on, it starts making a top level with the one before. At that point you can treat the double top as formed.
That is so because the double top belongs to the reversal patterns, so with no trend before it you cannot say a double top has formed.
You will see any number of twin bumps and twin hilltops, but they do not count as a double top because there is no trend, or because the trend before them runs against the pattern:
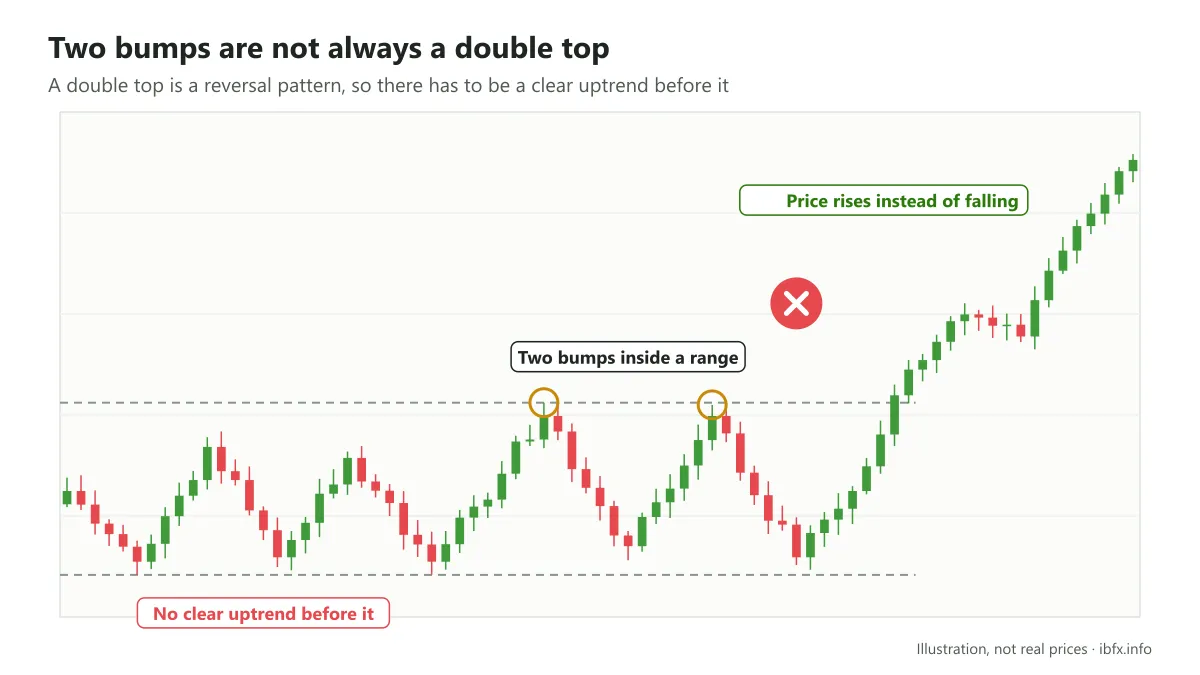
Look at the picture above and you will see price in a sideways accumulation. The trend before it really is not clear at all, so at a glance you would think this is a double top, but price does not reverse at all: instead of falling it rises.
- It has to break the neckline
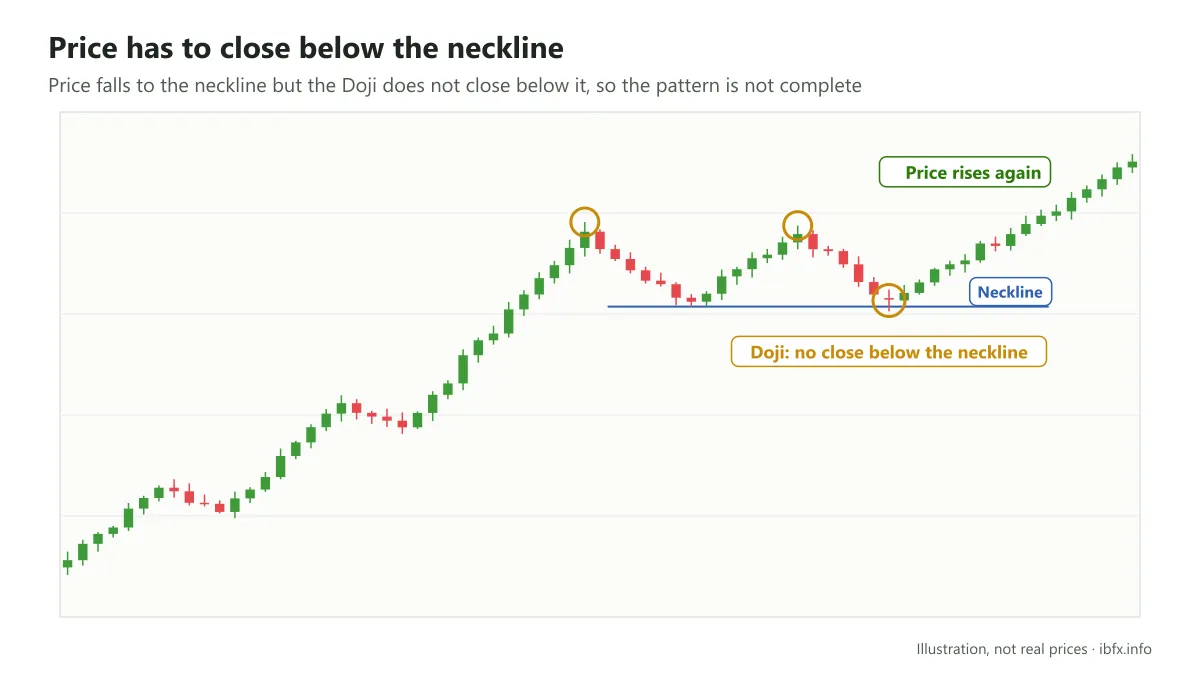
You saw in the section on what the pattern is made of that I said there has to be a neckline and that a candle has to close below it. But as you see here, after price came down and was about to break the neckline, it swung straight back up. And right at that spot a Doji turned up as well, so price failing to break through the neckline in the picture makes fair sense.
- How long a double top takes to form
On the D timeframe, the gap in time between the 2 tops is usually 3 to 4 weeks or more for the pattern to count as “good” (this is experience to go by, not a hard rule).
That is the theory; now I will show the theory so you understand it. And in a great many cases a double top that was forced to ripen still falls quite a long way.
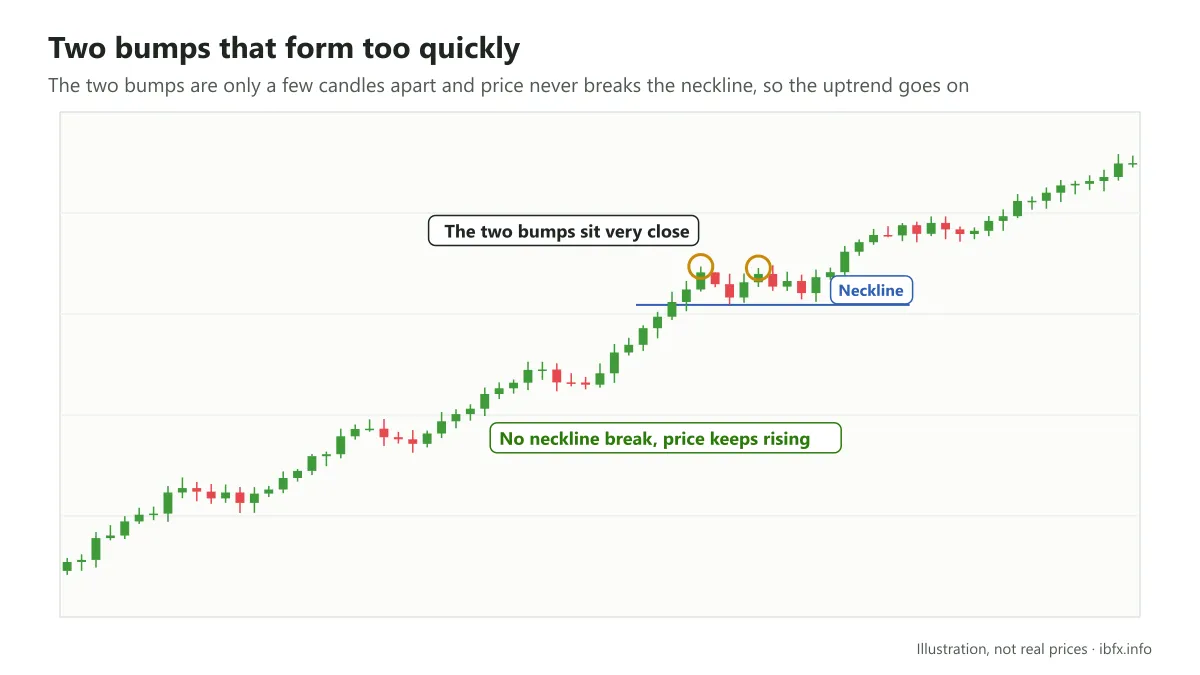
As you see in this picture, after a long rally two bumps formed, but price did not fall at all and carried on rising; the proof is that price did not break the neckline, and on top of that the pattern formed over a short time, so it could not be broken either. The pattern therefore counts as unfinished, or as a pattern that has failed.
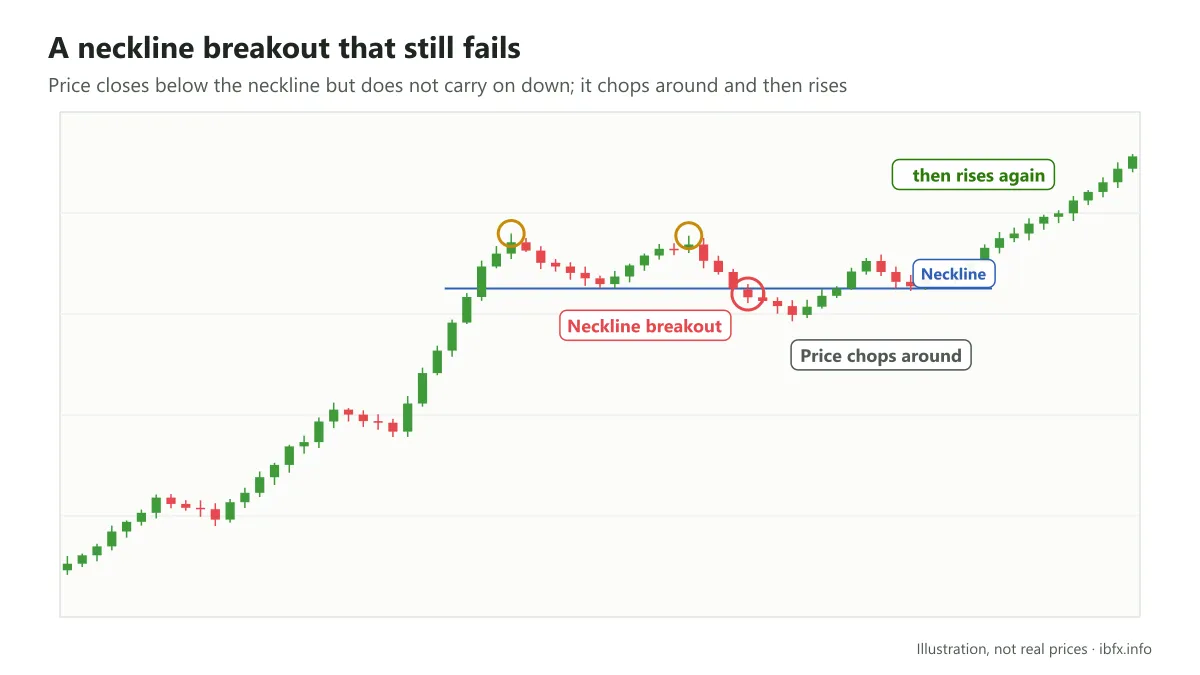
Or as you see in the example above, price did break out but did not fall properly; instead it chopped around higher up and then fell, but that was only a run-up to push price on higher.
How to trade the double top
Some specific rules when you trade the double top:
There are 2 ways to trade it:
1. Trade as soon as price breaks the neckline
2. Wait for price to re-test before you enter
In theory the 2nd way is safer and works better. The first way, though, gets you in earlier, so if price goes the right way the run is longer; in exchange, you meet more false breaks.
But even in the example below, when price re-tested, price did not carry on down either; instead it reversed higher. So which one you pick is up to you!
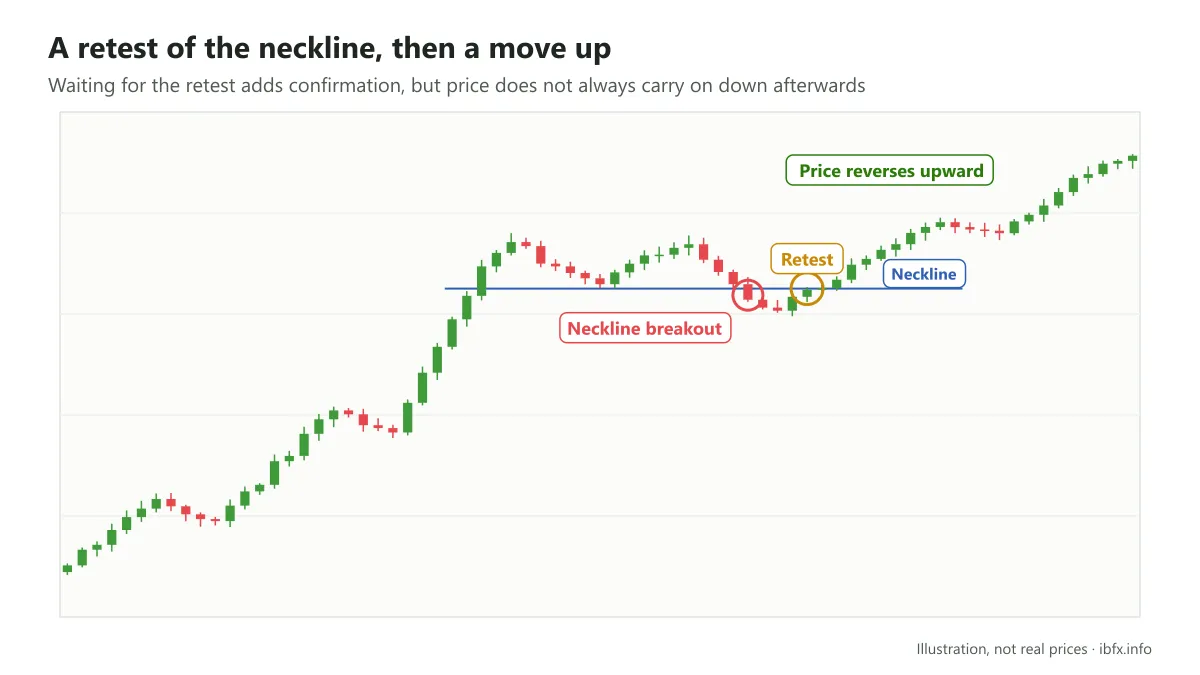
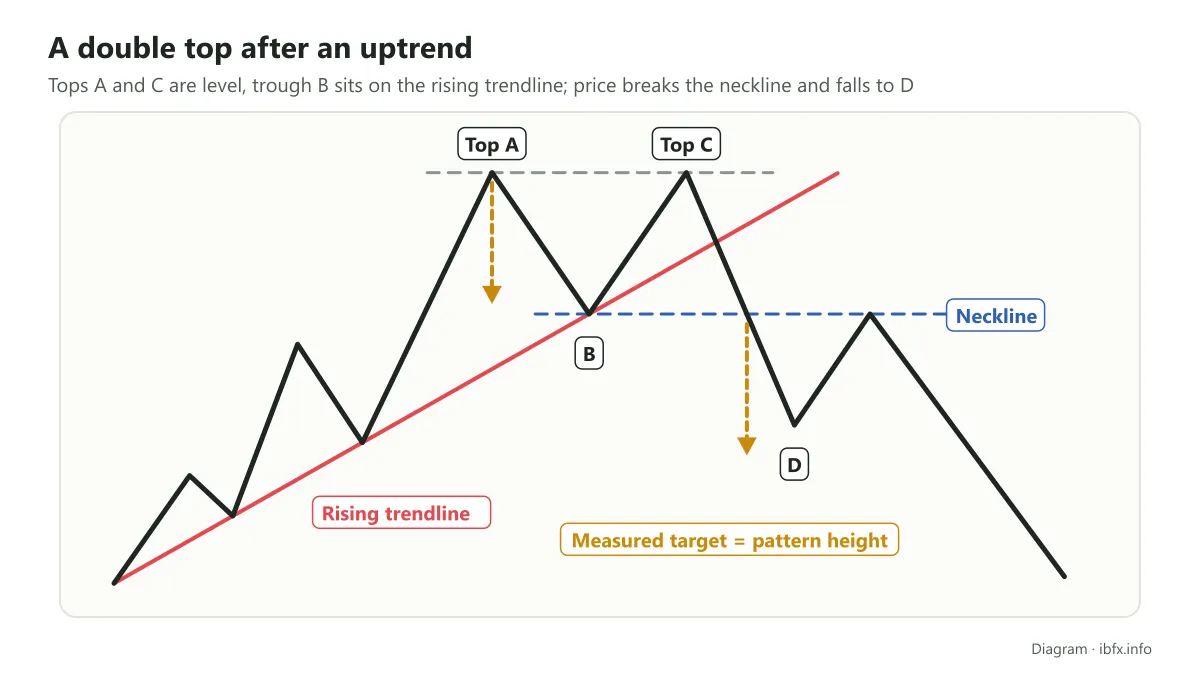
Beyond that, whichever timeframe you trade on, take profit on that timeframe. A take profit target to go by: measure the distance from the top down to the neckline, then take that same distance down from the point where price breaks the neckline.
Put the stop loss above the top, far enough away to stay clear of the noise (this goes for both ways of trading above), and work out your position size from that distance.
- Way 1: Trade as soon as price breaks the neckline
On the whole this way can pay well when it works, but the risk that comes with it is very high too, one reason being that the pattern is not all that reliable. Not to mention that in many cases, even when the pattern has followed its full structure and has retested the neckline, being stopped out can still happen.
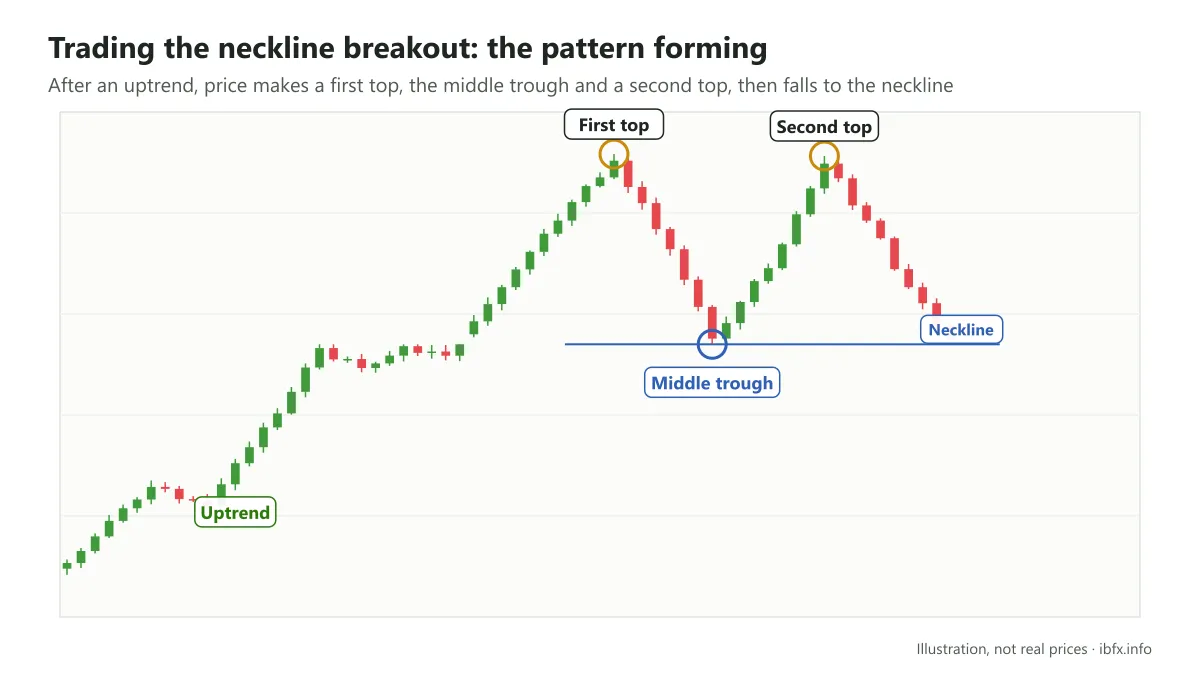
In the example above, after the uptrend that came before, price was pushed on higher to make the first top, then the middle trough, then the 2nd top. As soon as price breaks the neckline, as below:
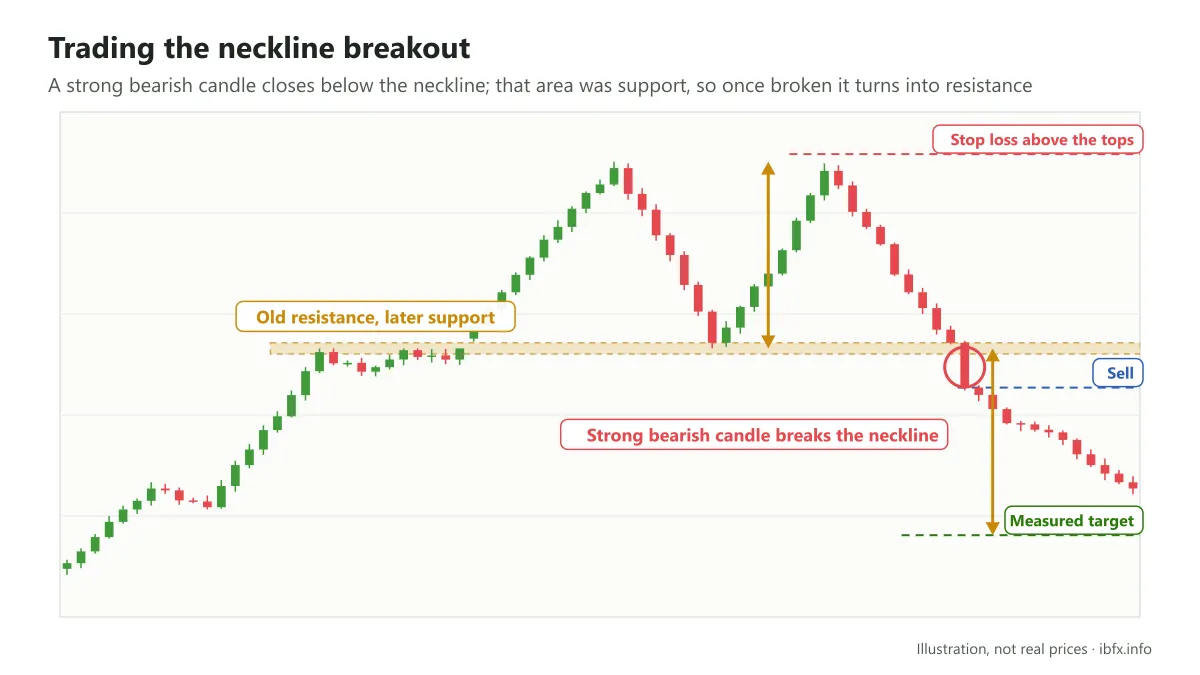
In this example, after the neckline break price fell quite a long way. This is a look back with the result already known, though; when you see the pattern form, you need to identify a clear trend along with a strong bearish candle forming. Not to mention that this is also a support area, so when price breaks it, support turns into resistance, which backs up the Sell here.
What is support and resistance? How to identify support and resistance levels
And in fact, waiting for the retest before entering does not always turn out better than entering right as price breaks through the neckline.
The example above shows that: if you wait for the re-test before entering, you cannot even take as much profit as you would right when price breaks the neckline. So “cut your coat according to your cloth”!
Be really patient: wait for a candle to close below the neckline before you enter!
Way 2: Trading when price re-tests the neckline
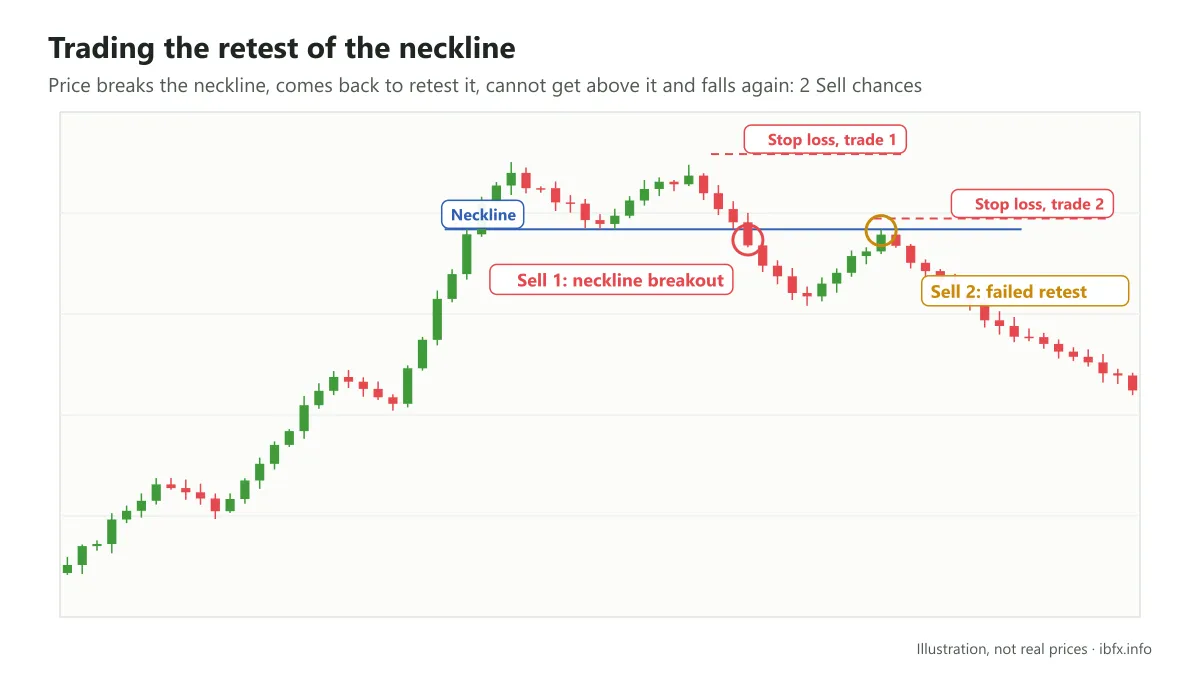
The example I have just given shows that after the double top formed, price broke the neckline and fell hard. Price then re-tested the neckline, and when it could not hold there it carried on down. In this case there are 2 chances to enter:
- The 1st: enter as price breaks the neckline, and take profit the way described above.
- The 2nd: wait for the re-test of the neckline to fail, then Sell again; each trade has its own stop loss.
Beyond that, whichever timeframe you see the pattern form on, take profit on that timeframe; a pattern on H4, for example, usually does not run as far as one on D1.
Or in a case where price does re-test, it still cannot match a pattern that formed on the D timeframe, or the W.
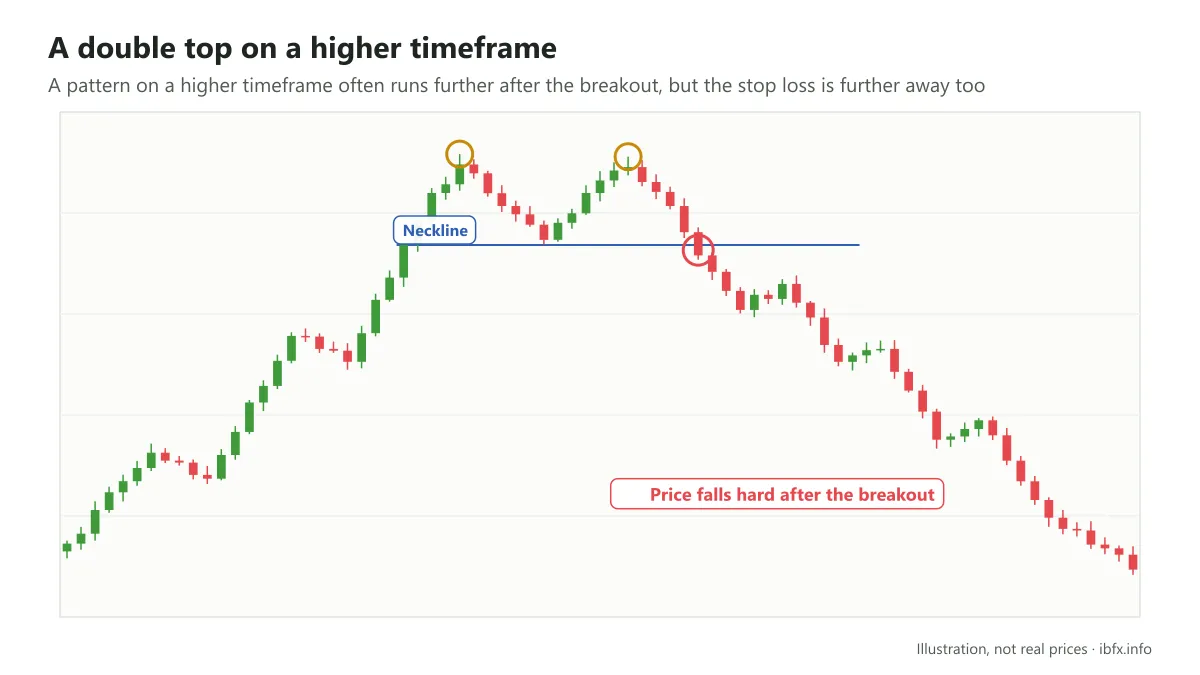
A double top on the D timeframe: price falls hard after the neckline break
Beyond that, keep the stop loss in mind too:
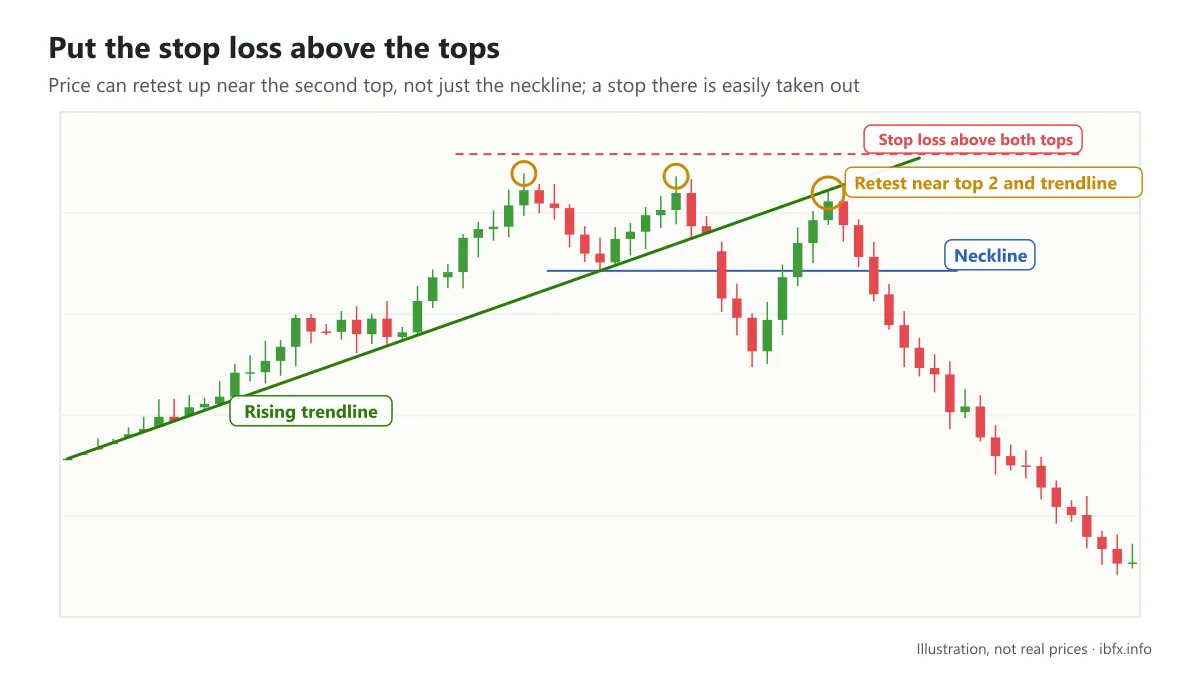
The picture above is a double top as well, and price re-tested not at the neckline but sometimes all the way up near the second top. That is why you have to put the stop loss a few pips above the 2 tops of the pattern. Only that way are you sure of not being taken out, if you are still holding the trade with a steady nerve.
Beyond that, the leg up is also re-testing the rising trendline that was there before, and only when price fails there does it start falling hard.
Part II: The double bottom price pattern
What is a double bottom?
The double bottom is a reversal pattern that appears at the end of a downtrend to signal a change in price from falling to rising.
What a double bottom is made of
Like the double top, the double bottom is also made up of 3 parts:
- A downtrend
- 2 bottoms
- And the neckline
And when the double bottom has formed it looks like the letter W.
When price reaches the first bottom it tends to turn, and a middle peak forms in that turning area. But price does not carry on up; it goes back to the downtrend it was in before and makes a second bottom at roughly the same level as the first. Here, where price does not make a lower low, price starts edging up, and when it breaks out past the neckline, I can report one thing to you: the double bottom has formed.
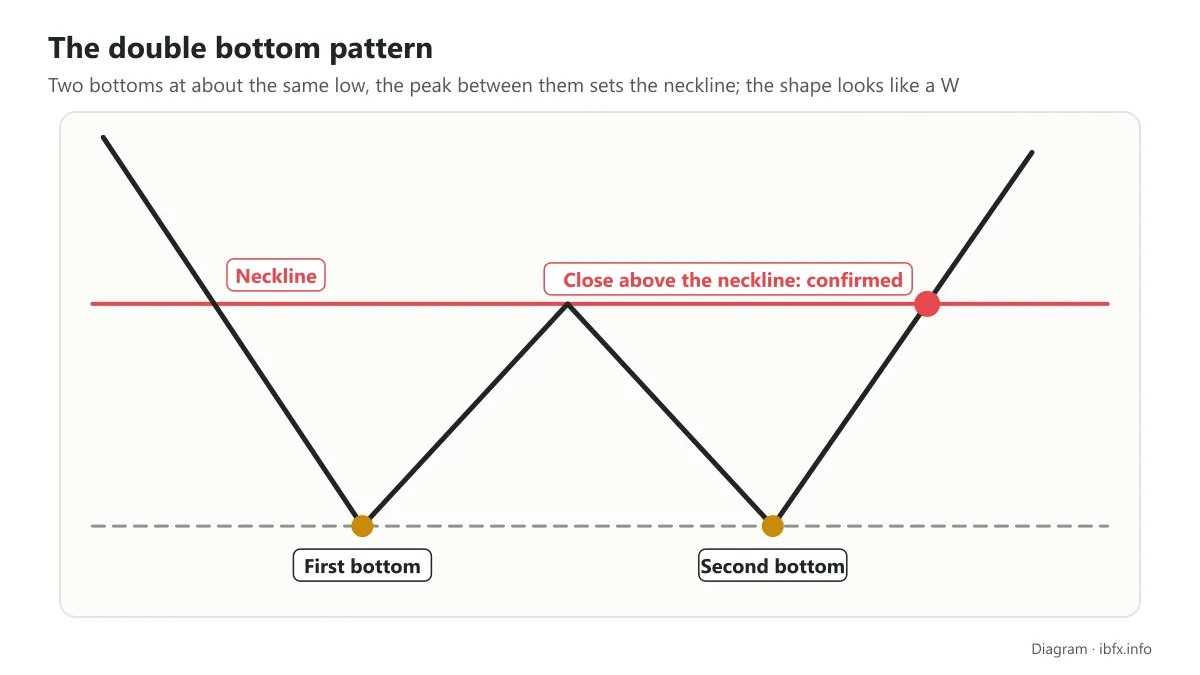
What makes a double bottom form?
On the price psychology of the double bottom: price falls and makes the first bottom, and the side in control here is the Sell side, but because it cannot go on making a lower low, instead of a next bottom lower than the first the Buy side comes up and grabs the flag, and so a middle peak is made.
But because the force behind it is not strong enough, as soon as the sell side saw the Buy side grab the flag and make that peak, it got hot under the collar and set out to push the buy side down into the mud, which is how the 2nd bottom was formed. The Sell side did not have the strength to push price to a lower low, though, and once this 2nd bottom appears, in many cases the Buy side starts to get the upper hand over the Sell side, a mood that shows up in reversal candles such as the Doji.
And right after that the Buy side turned the wheel to push price higher; if price breaks the neckline at this point, the buy side has pulled off its revolution: the reversal is set, from falling to rising.
What makes a good double bottom?
Like the double top, a double bottom that counts as good also needs a clear trend before it, here a downtrend; the gap between the 2 bottoms (on the D timeframe) is usually 3 to 4 weeks or more, and above all it has to break the neckline:
In the example below you might think this is a double bottom, but after price broke the support of the sideways range, price fell very hard.
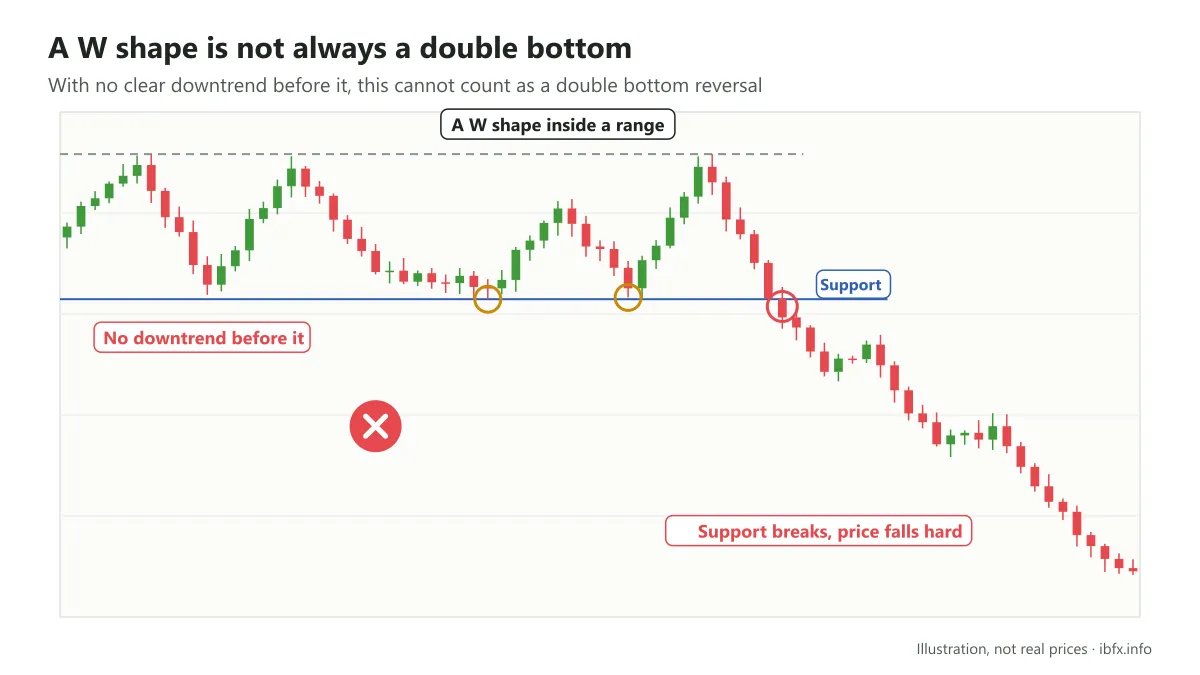
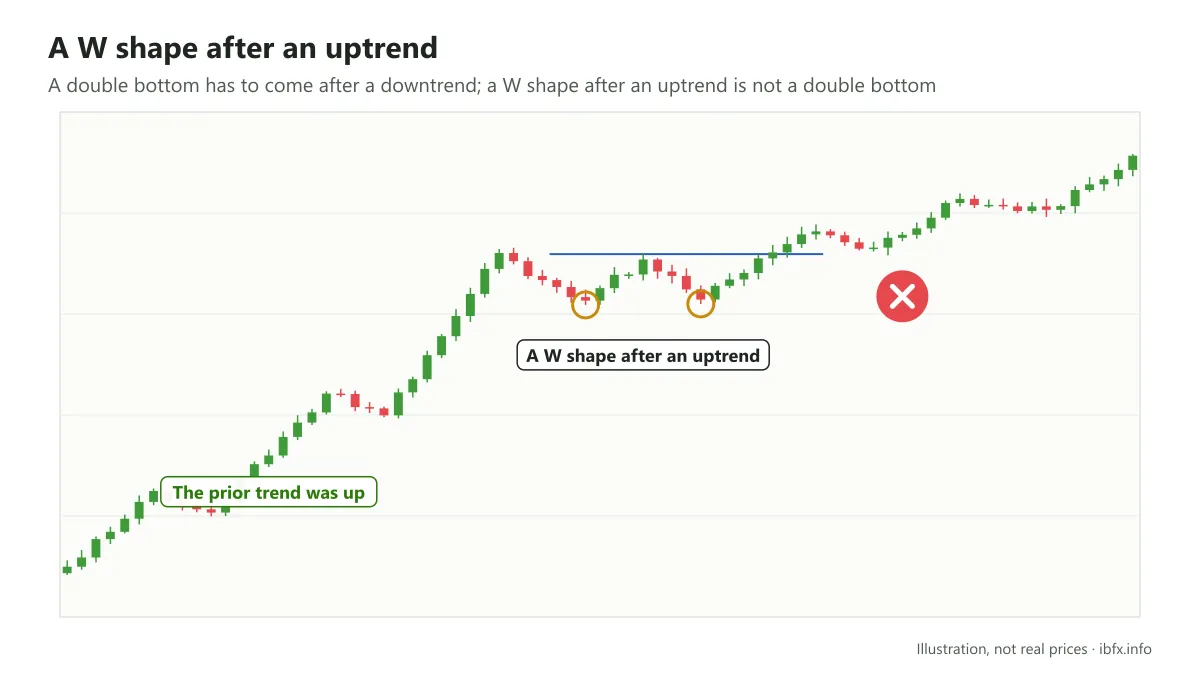
So if there is no clear trend before it, here a DOWNTREND, there is no way to treat it as a double bottom.
Or as in the example below, the trend before it is an uptrend when for a double bottom it should be a downtrend, so even though it looks like a W it is still not a double bottom:
How to trade the double bottom
For the double bottom the way of trading is the same as for the double top, that is, 2 ways:
Trade as soon as price breaks the neckline
Wait for price to re-test the neckline, and only then enter
Beyond that, the most IMPORTANT thing is still to IDENTIFY THE TREND.
Stop loss: below the lower of the 2 bottoms, far enough away not to be taken out, and work out your position size from that distance.
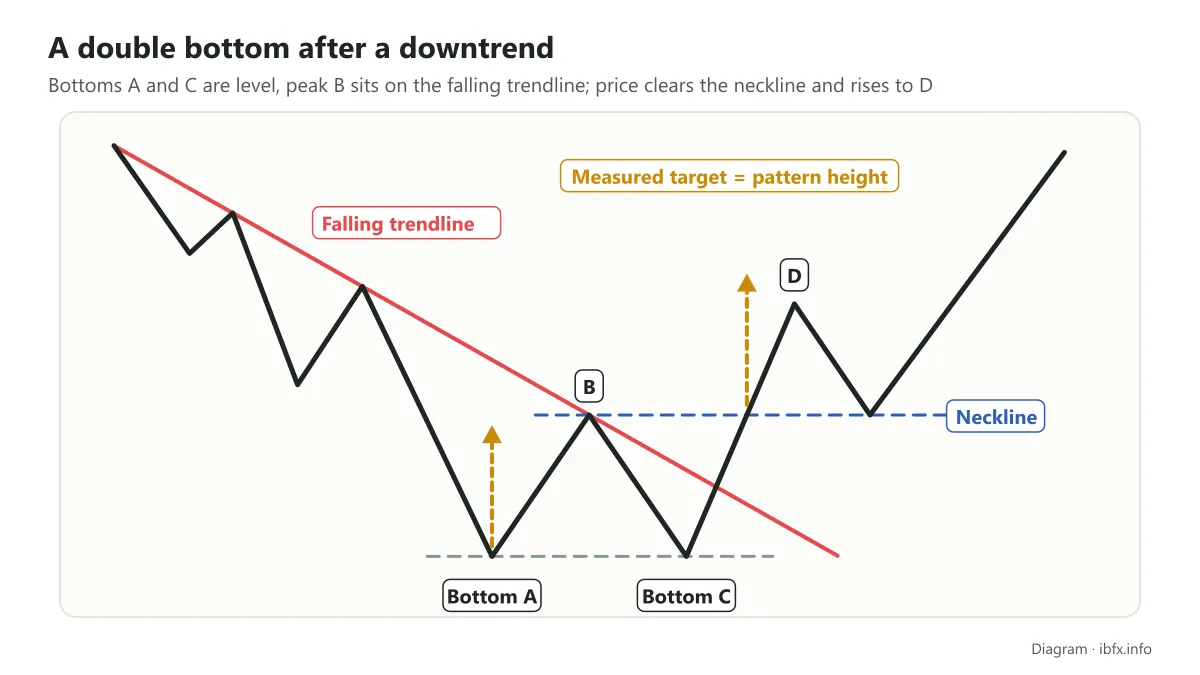
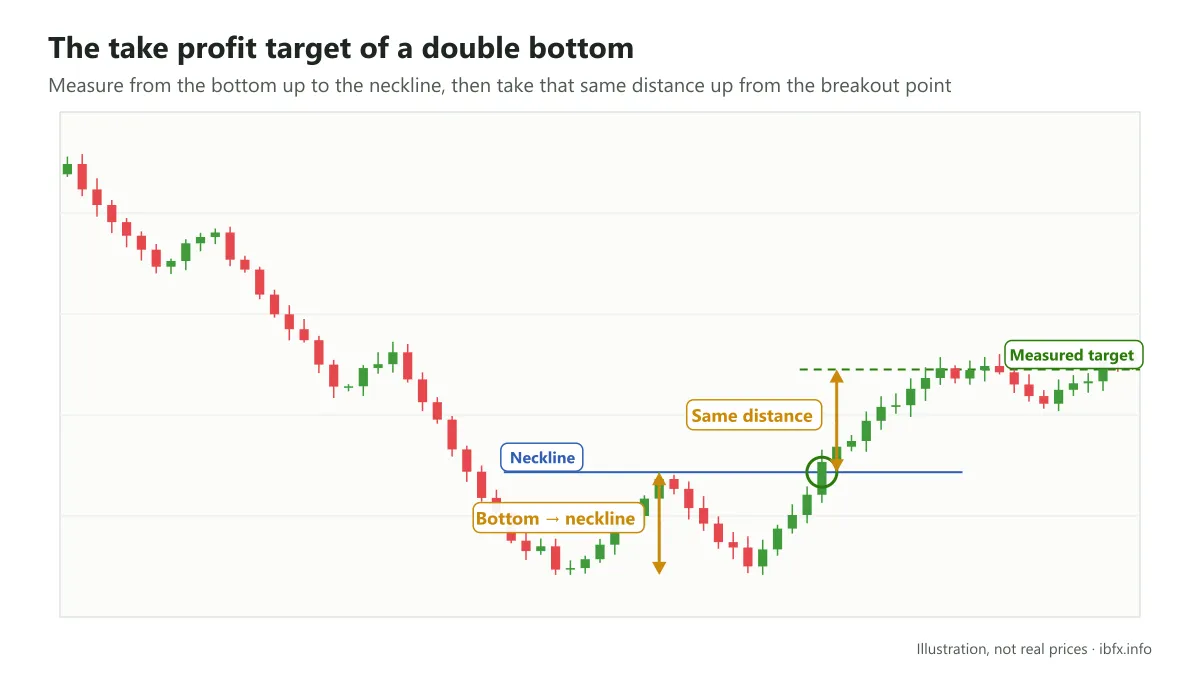
Take profit: measure the distance from the bottom up to the neckline, then take that same distance up from the point where price breaks the neckline, as in the example below:
Now let us look at the example below to get a clearer picture of how to trade the double bottom:
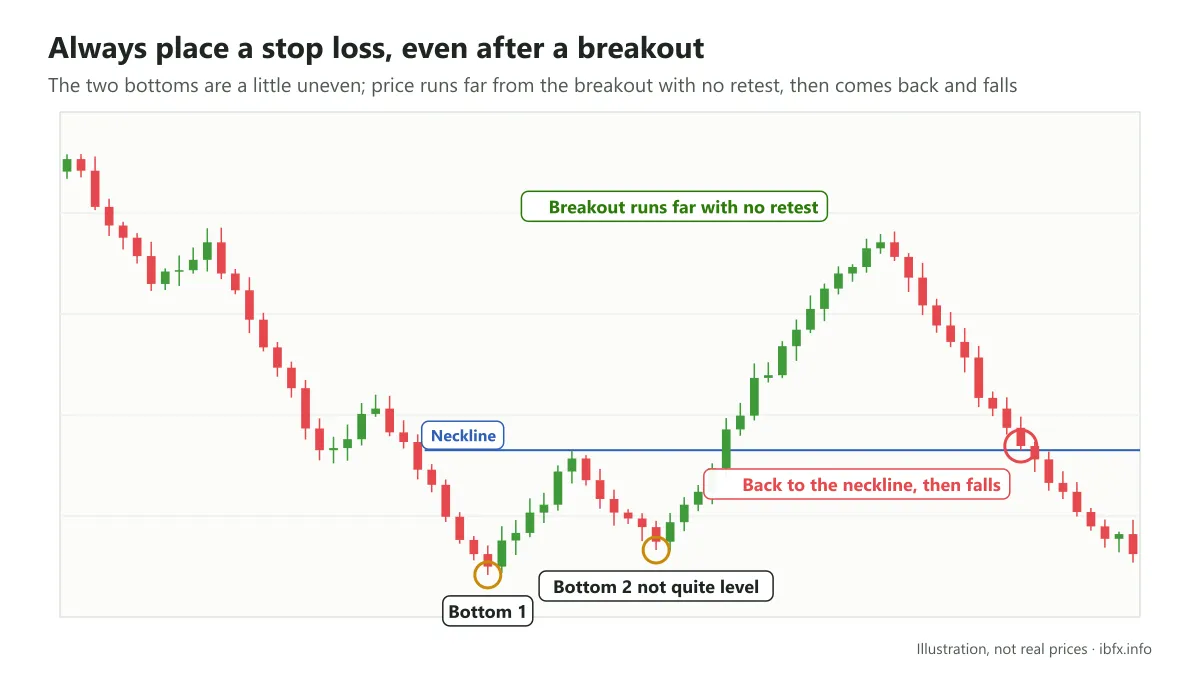
In this example bottom 1 and bottom 2 really are not level, they are slightly out from each other, but it is still acceptable. After breaking out past the neckline, price ran a very long way in one go, with no re-test at all.
And when price pulled back down and re-tested the neckline, instead of rising further it turned down. That is exactly why you should always place a stop loss, whatever the case.
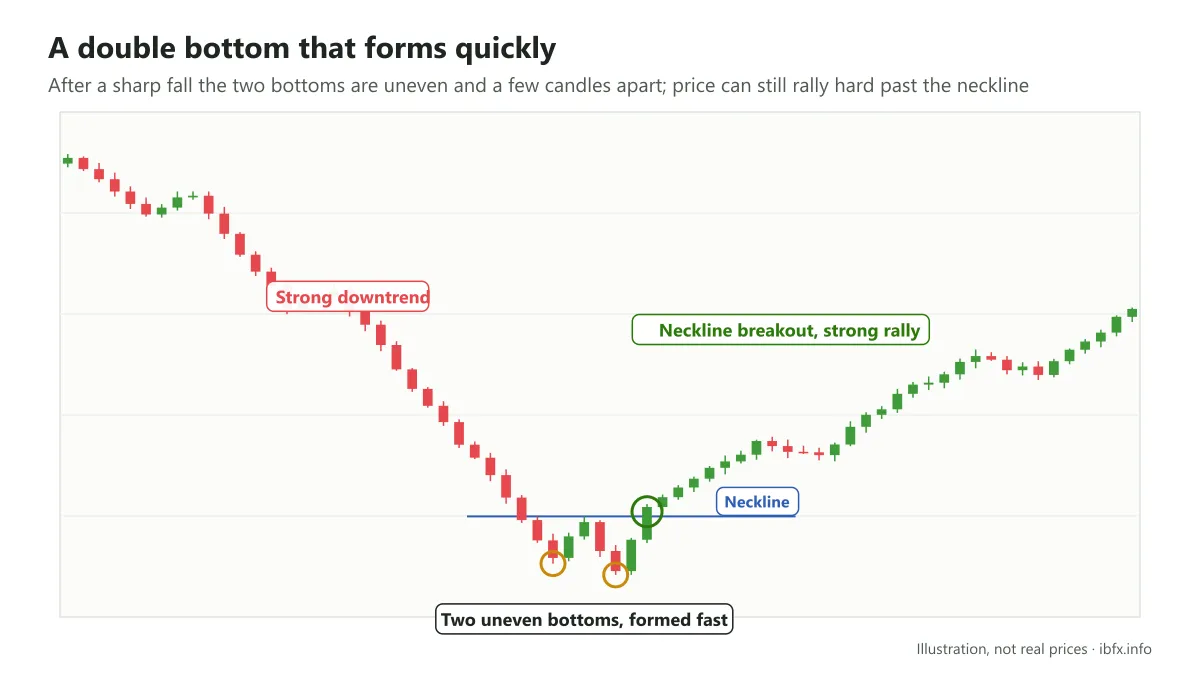
In this example you can see price formed a double bottom that was “forced to ripen”. After an extremely sharp downtrend it made the first bottom, then went on to make the middle peak, then the 2nd bottom. And these 2 bottoms are not the same size, a little out of line and ugly.
When price broke through the neckline, though, it put in an extremely strong rally.
Some questions about the double top and the double bottom
Is the double top or double bottom a continuation pattern or a reversal pattern?
A REVERSAL pattern.
How should you take profit on a double top or a double bottom?
The double top and the double bottom are easy-going patterns that show up a great deal on the Japanese candlestick chart, so they will struggle to meet expectations or to run as far as other patterns. So whichever timeframe you trade on, take profit on that timeframe.
Should you enter when price breaks the neckline, or wait for price to re-test the neckline?
If you want in early, wait for a candle to close on the other side of the neckline and then enter; if you want more confirmation, wait for the re-test (the trade-off being that you may miss the chance). Whichever you pick, you have to place a stop loss.
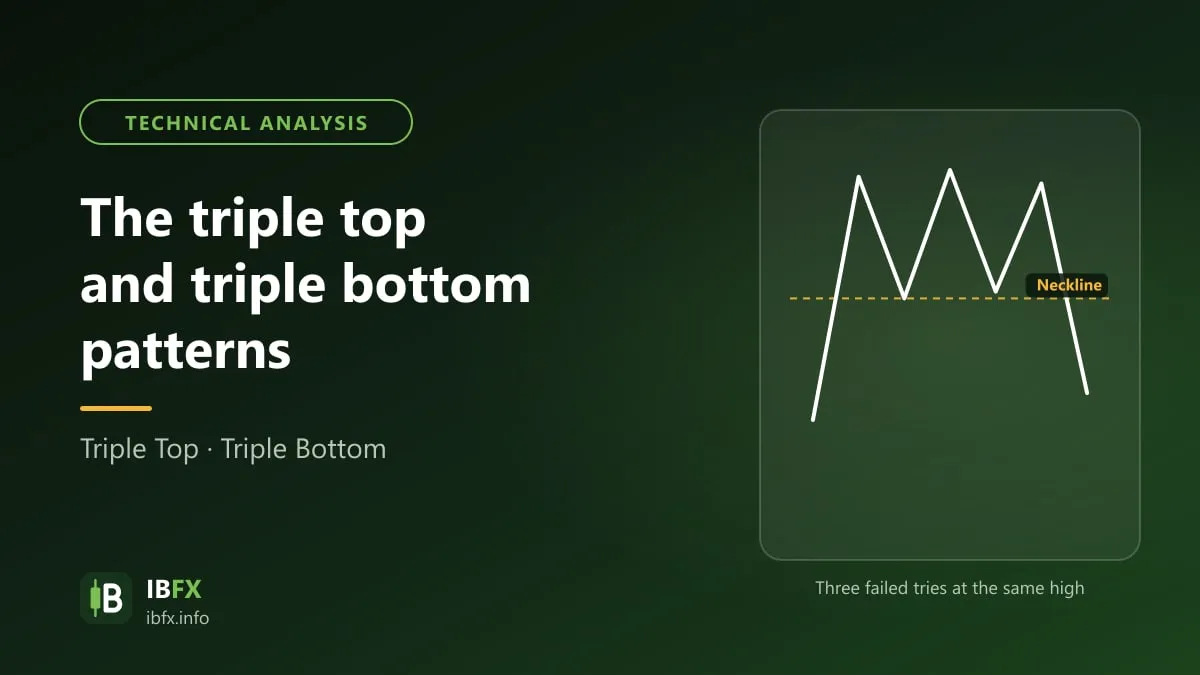
Read more: the head and shoulders pattern and its inverse, and the triple top and the triple bottom.
See also: the head and shoulders pattern, normal and inverse, and the triple top and triple bottom patterns.