On this page
Carrying on the series of lessons on price patterns, today we walk you through a “close relative” of the double top and double bottom: the triple top and the triple bottom. Even with more tops and more bottoms, this kind of pattern is usually seen as a variant of the double top and double bottom.
The triple top and triple bottom are fairly rare compared with the double top and double bottom. In the way they build, they look much like the head and shoulders pattern (the difference being that the tops come out at near enough the same height), so plenty of traders watch for them. Let us look at how to spot and how to trade the triple top and the triple bottom in the article below.
Part I: The triple top
What is a triple top?
A triple top is a pattern built from 3 tops at near enough the same height, a reversal pattern that sits at the end of an uptrend. Once it is complete (price breaks the neckline), the pattern signals that the trend may turn from up to down.
What makes up a triple top
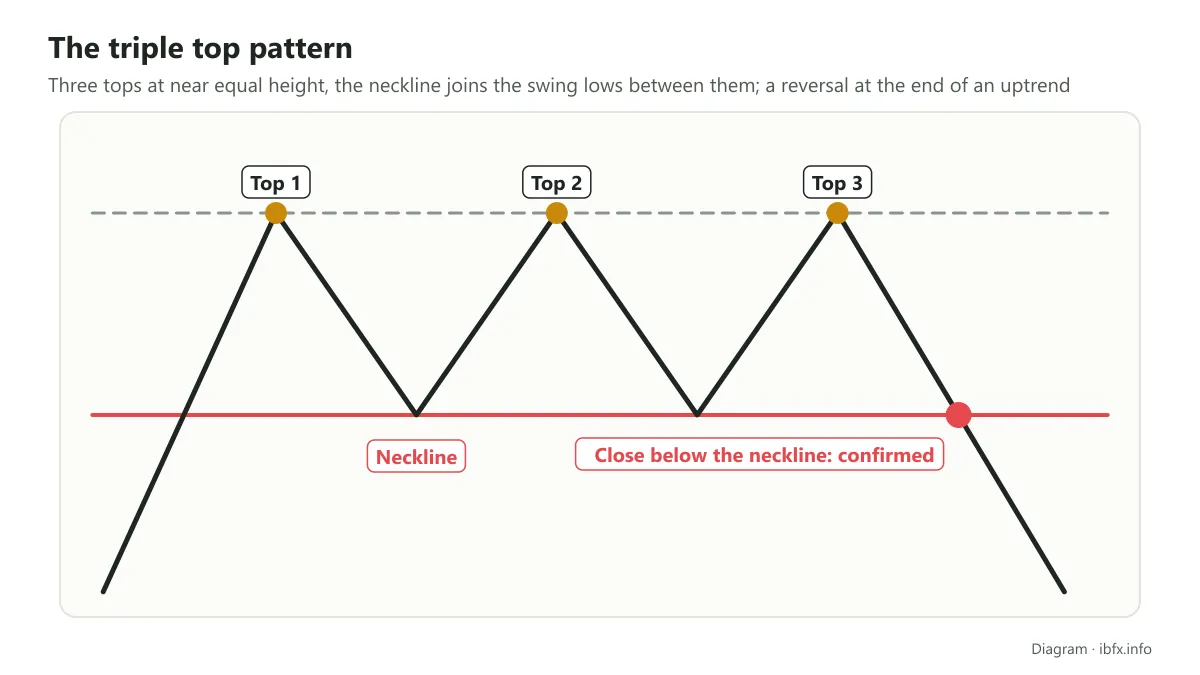
The triple top is seen as a variant of the double top: after the 1st top and the 2nd top are in place (the same as a double top), price fails to break the neckline and fall further, and turns back up to make a 3rd top.
If the 3rd top comes out at near enough the same height as top 1 and top 2, a triple top is most likely forming.
Just like the double top, the triple top is made up of very little:
- Three tops at near enough the same height
- The neckline (joining the swing lows between the tops)
- An uptrend before it
If the double top looks like the letter M, the triple top looks like an M with one more top added to it.
What makes a triple top form?
When a triple top appears at the end of an uptrend, you can see that buyers have begun to stall: after the first top, price goes up to make a 2nd top but cannot clear it, so (for the moment) buyers and sellers are in balance.
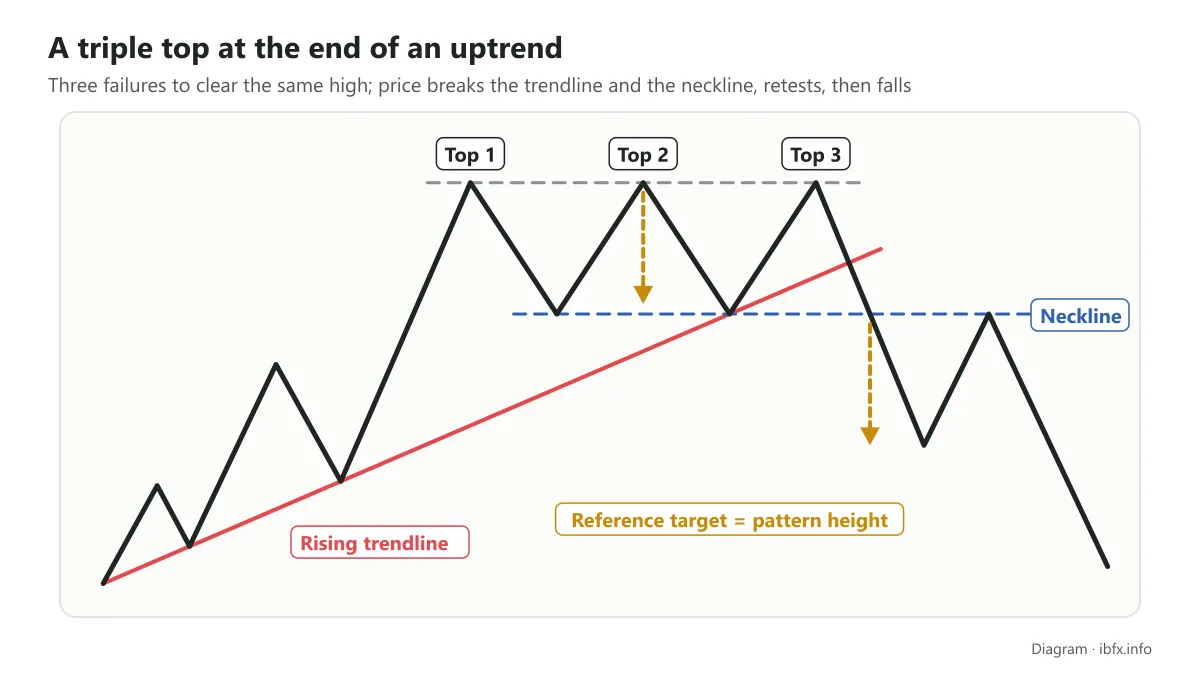
When sellers push price down to a 2nd swing low, buyers push price back up to a 3rd top. This stage can be seen as consolidation, with the two sides pulling against each other. Because the pattern appears at the end of an uptrend, price failing 3 times to clear the high shows sellers slowly taking back control. Once the neckline below is broken, price starts making lower lows, which is to say the change from up to down is beginning to take shape.
What counts as a textbook triple top?
While the 3 tops are being built the market moves sideways, so the triple top comes out looking much like a rectangle pattern.
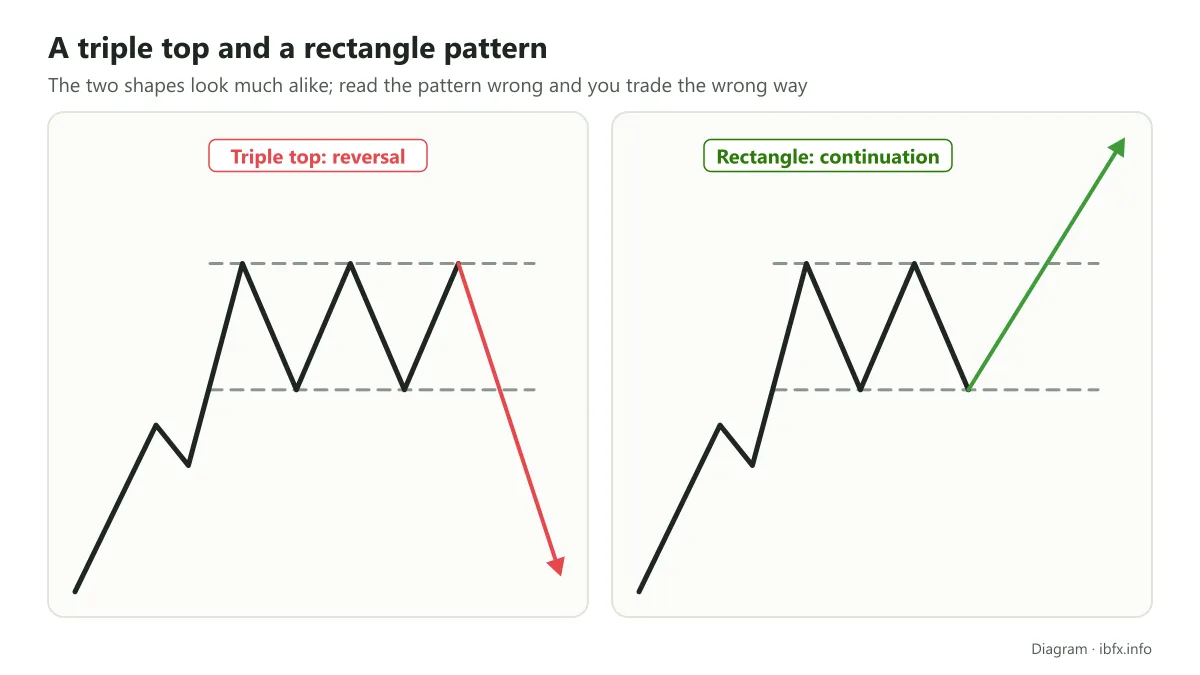
If you are not paying attention, the two are easy to mix up. The rectangle is usually put in the continuation pattern group, while the triple top is a reversal pattern. Read the pattern wrong and you will enter in the wrong direction.
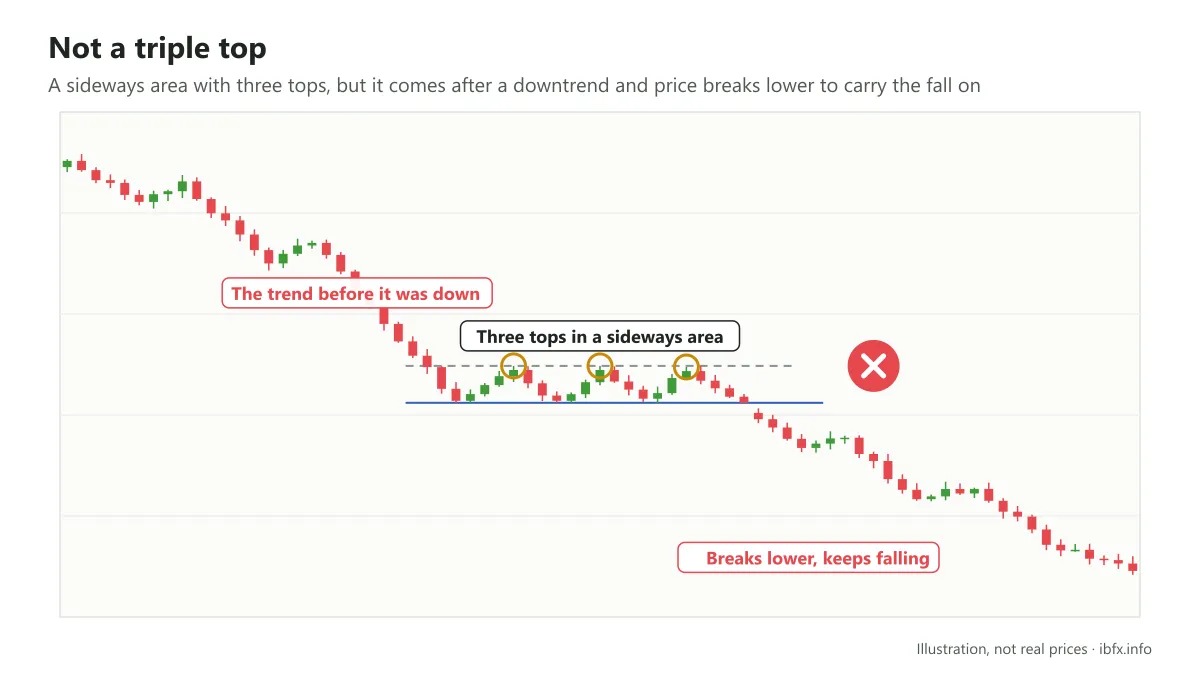
At a glance at the example above, you might think this is a triple top. But the trend before it was a downtrend, and once the sideways stage ends, price breaks lower to carry the fall on. So this is not a triple top.
The example below is the same: it looks like a triple top, but at heart it is only a stage where price consolidates before carrying on the fall that came before.
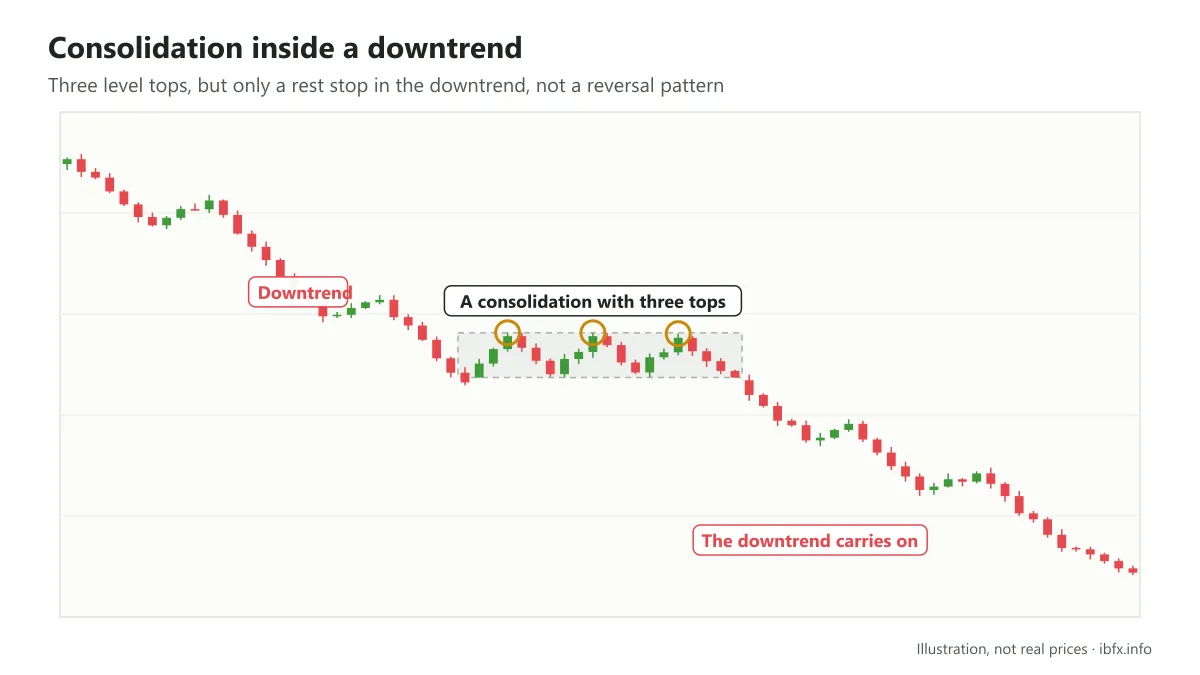
That is why a textbook triple top has to meet the following:
- The trend before it is an uptrend
- There are 3 tops at near enough the same height, without too much difference between them
- Trading volume usually falls away across the tops, then rises when price breaks the neckline (in forex this is the tick volume your broker supplies, which is for reference only)
- A candle has to close below the neckline
Here is an example of a textbook triple top:
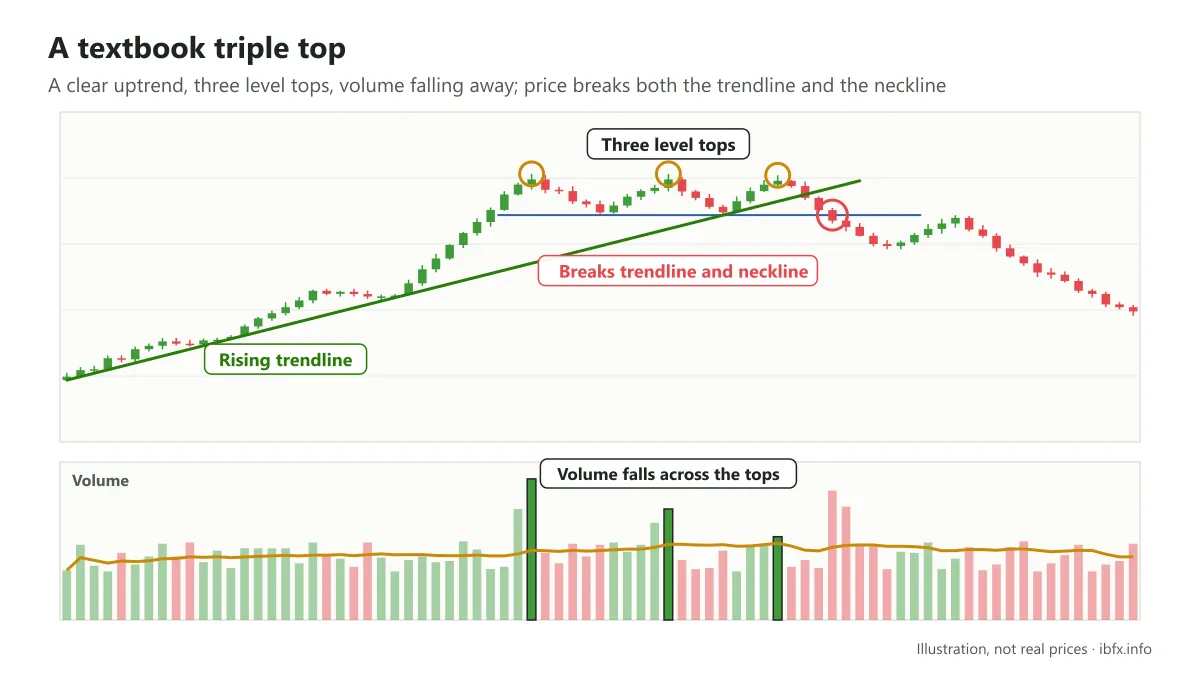
Look at the example above: the trend before it is clearly an uptrend.
Then price makes the first top, drops to a swing low, rises to a 2nd top level with the first, drops to the next swing low, rises to a 3rd top, then falls through the neckline and drops hard. Trading volume from the first top through to the 3rd top also falls away noticeably.
On top of that, in the example above, if you draw a rising trendline you can see price touched the trendline several times without breaking it; once price broke through both the trendline and the neckline, it fell hard.
How to trade the triple top
There is an old saying, “three strikes and you are out”: three tops appearing close together show that buyers attacked 3 times and none of those attacks had the strength to break the resistance level, which shows the “bulls” running out of steam. Over this time sellers grow more active, happy to sell at the higher prices, which creates a point of balance between buying and selling pressure.
After buyers fail 3 times, the “bears” step into the market with more force and push price down. At the same time, those who bought earlier may have to take their stop loss, which adds even more to the selling pressure.
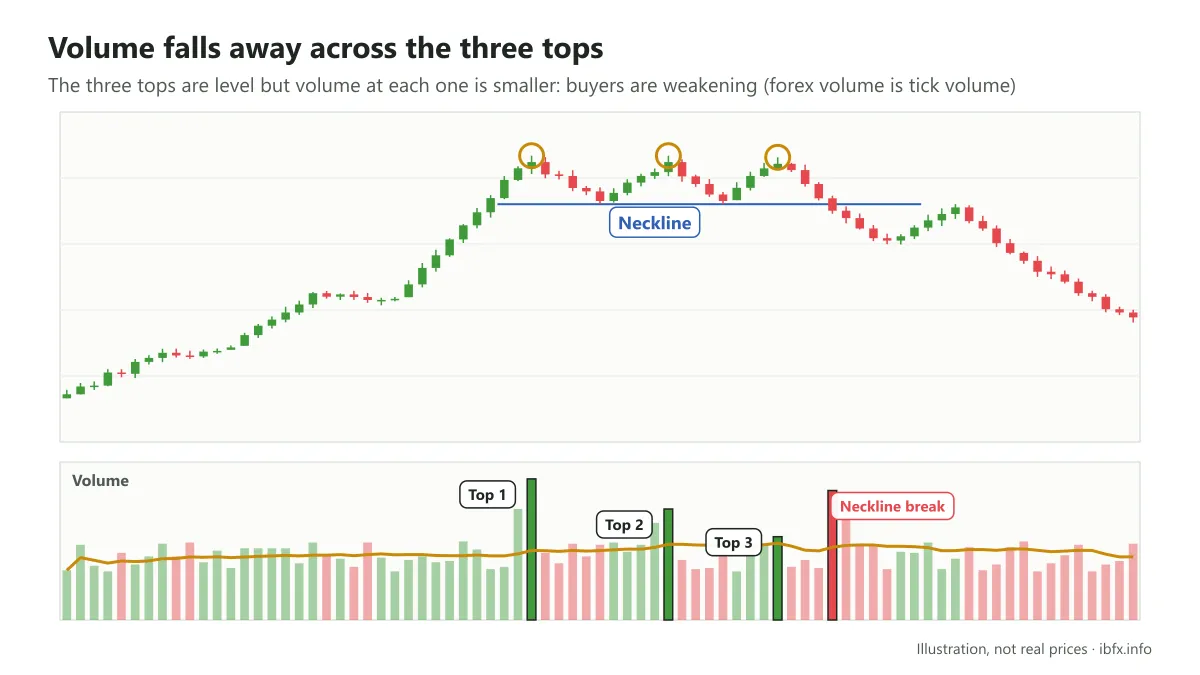
Even though the 3 tops are level with each other, if you watch the trading volume at the 3 tops you will see it falling away, which shows buyers getting weaker.
There are 2 ways to trade the triple top:
- Trade as soon as price breaks out (a candle closes below the neckline)
- Trade when price retests the neckline
The 2nd way has an extra step of confirmation so it is safer, but price does not always come back to retest, so you may miss the trade.
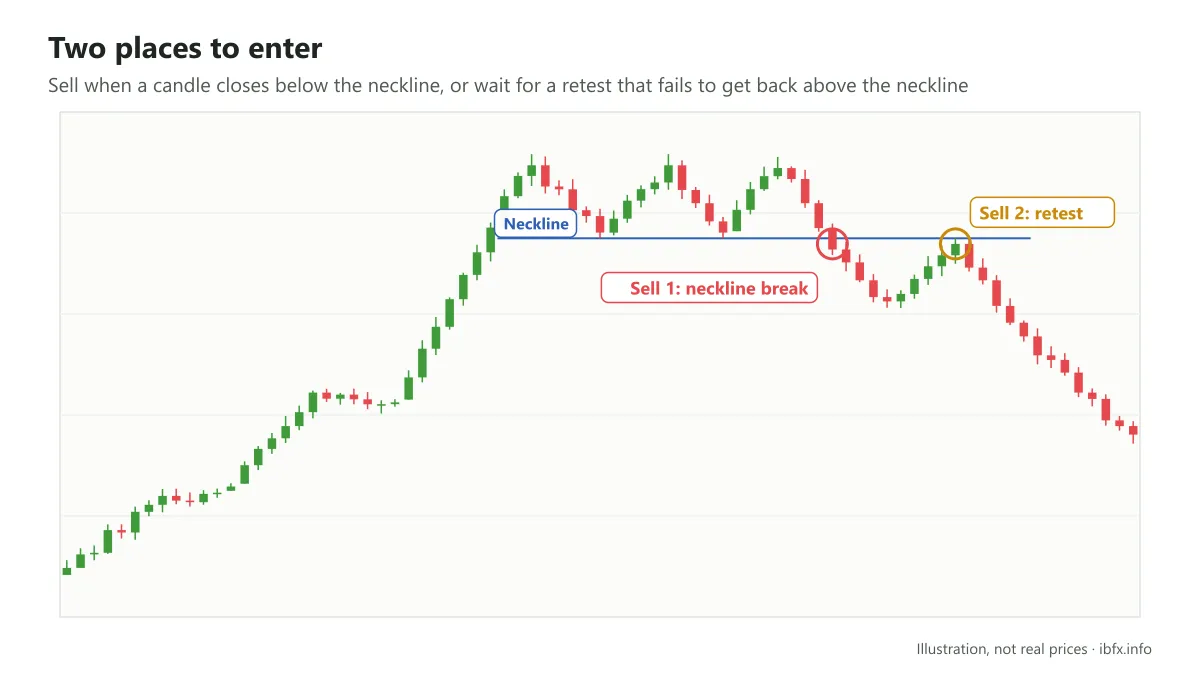
In the example above there are 2 chances to enter: after price breaks the neckline it falls quite a long way, then it bounces back up to retest but cannot get back above the neckline, so it carries on falling.
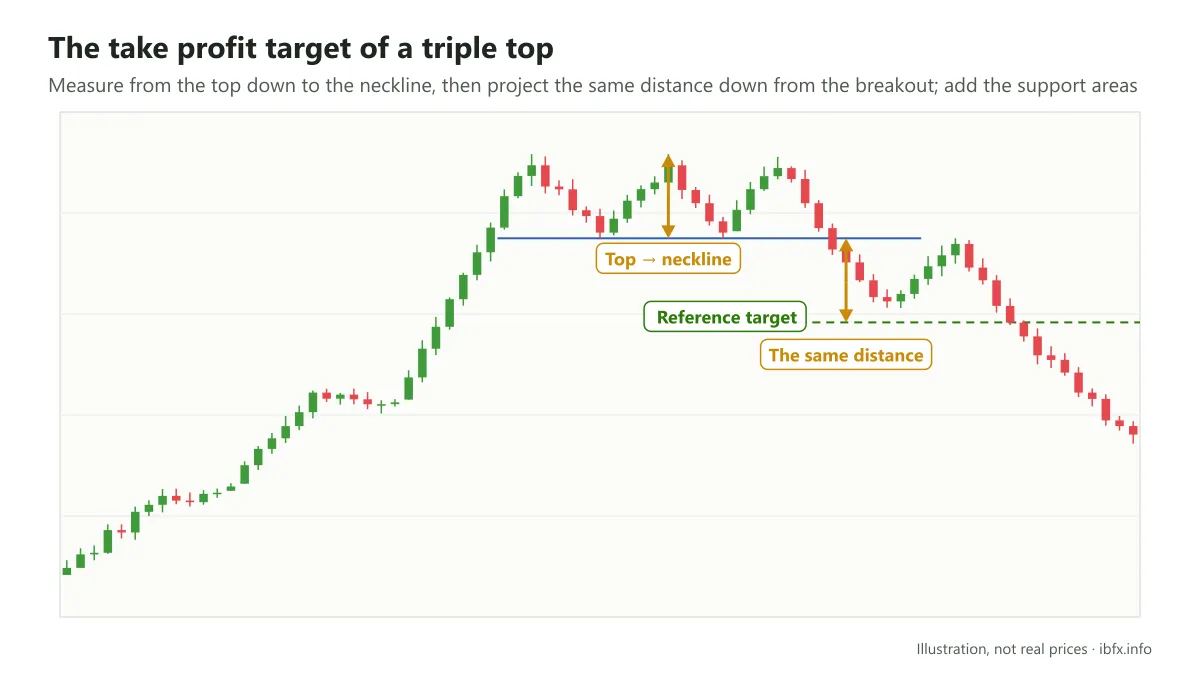
A reference take profit target, the measured move: measure the distance from the top of the pattern down to the neckline, then project that same distance down from the point where the neckline broke. Price may not reach the target, so put it alongside the support areas below.
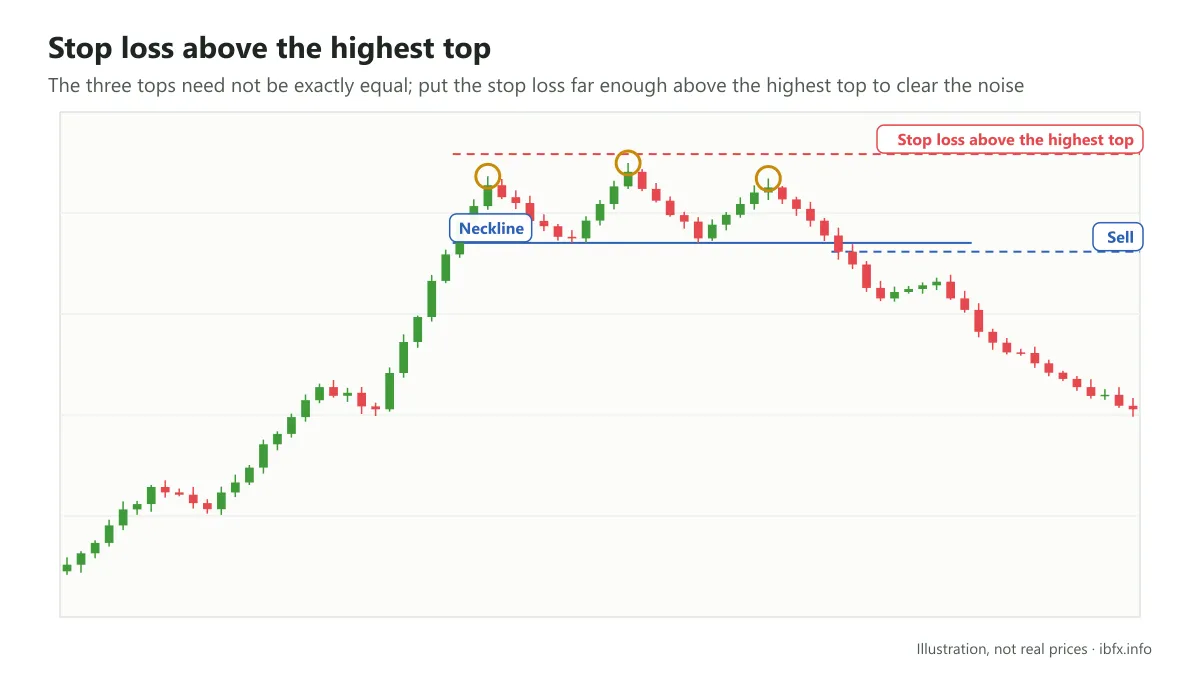
Whichever timeframe you trade, measure and take profit on that timeframe. Put the stop loss (SL) above the highest top of the pattern, far enough to clear the noise, and work out your position size from that distance.
Part II: The triple bottom
What is a triple bottom?
In the main, the triple bottom has the same make-up, the same way of forming and the same market psychology as the triple top, only the other way round: the side that comes out on top is the buyers, on condition that price breaks the neckline above.
So the triple bottom is a reversal pattern that forms at the end of a downtrend: price falls 3 times to the same support area but cannot break it. When buyers push price through the neckline, the trend may turn from down to up.
What makes up a triple bottom
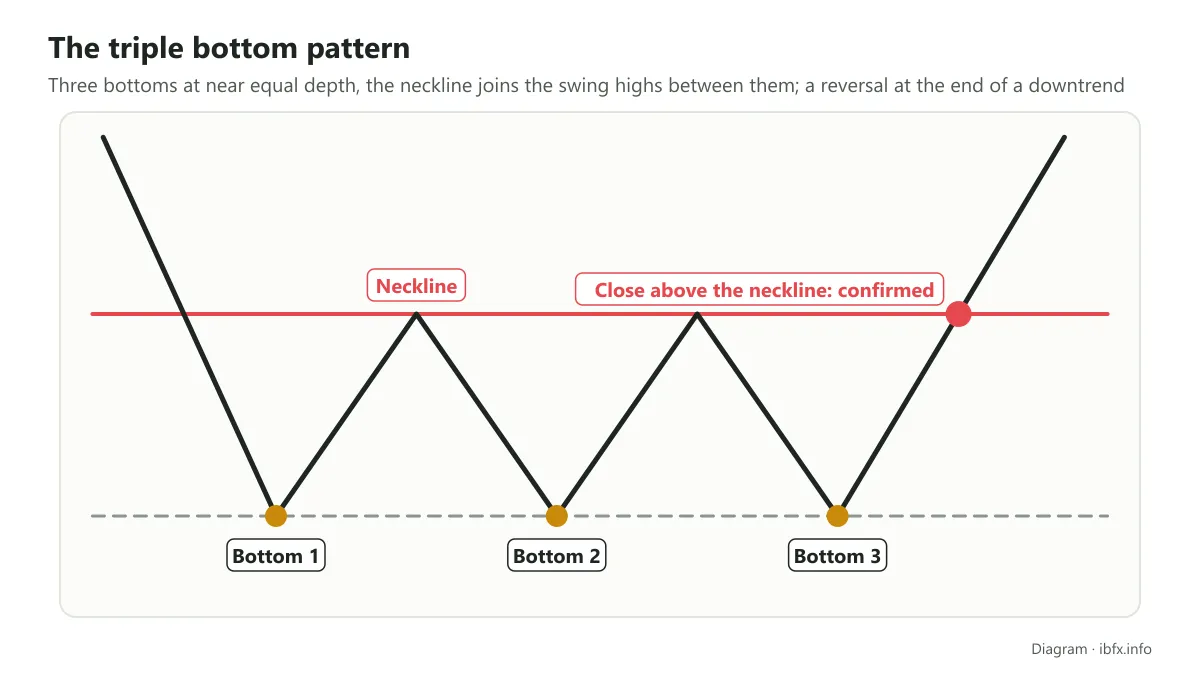
A triple bottom is made up of 3 bottoms at near enough the same depth, the neckline (joining the swing highs between the bottoms), and a trend before it that has to be a downtrend. The pattern is only complete when price breaks the neckline.
What makes a triple bottom form?
The stretch while the pattern forms is also a stage of consolidation. The longer price consolidates, the stronger the move after the breakout usually is.
The trend before it is a downtrend, but over this stage sellers and buyers are all but in balance. So instead of carrying on making lower lows, price only makes bottoms level with each other; when buyers have the strength to push price above the neckline, an uptrend may begin.
What counts as a textbook triple bottom?
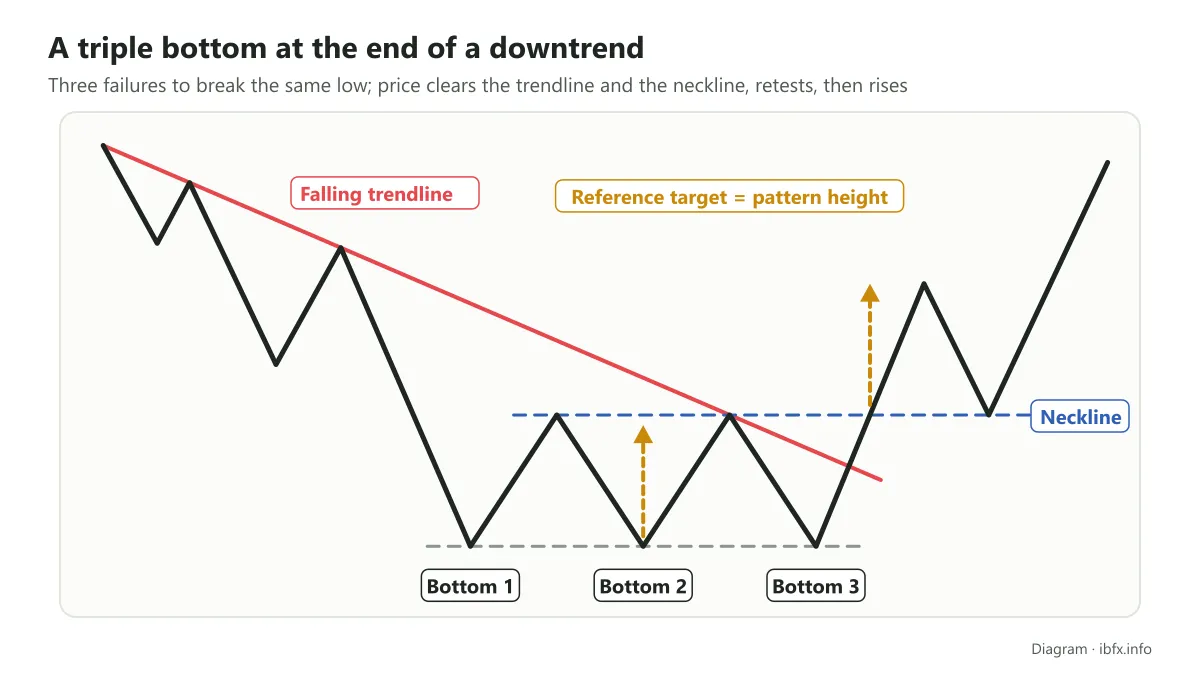
A clean triple bottom has to have a clear downtrend in front of it. Once the 3 bottoms are in place, price has to break the neckline before the change from a downtrend to an uptrend is confirmed. Just as with the triple top, a triple bottom needs to meet these:
- The trend before it is a downtrend.
- There are 3 bottoms at near enough the same depth, not too far out of line with each other.
- Trading volume usually falls away while the pattern forms and rises when price breaks the neckline.
- A candle has to close above the neckline.
Look at the example below:
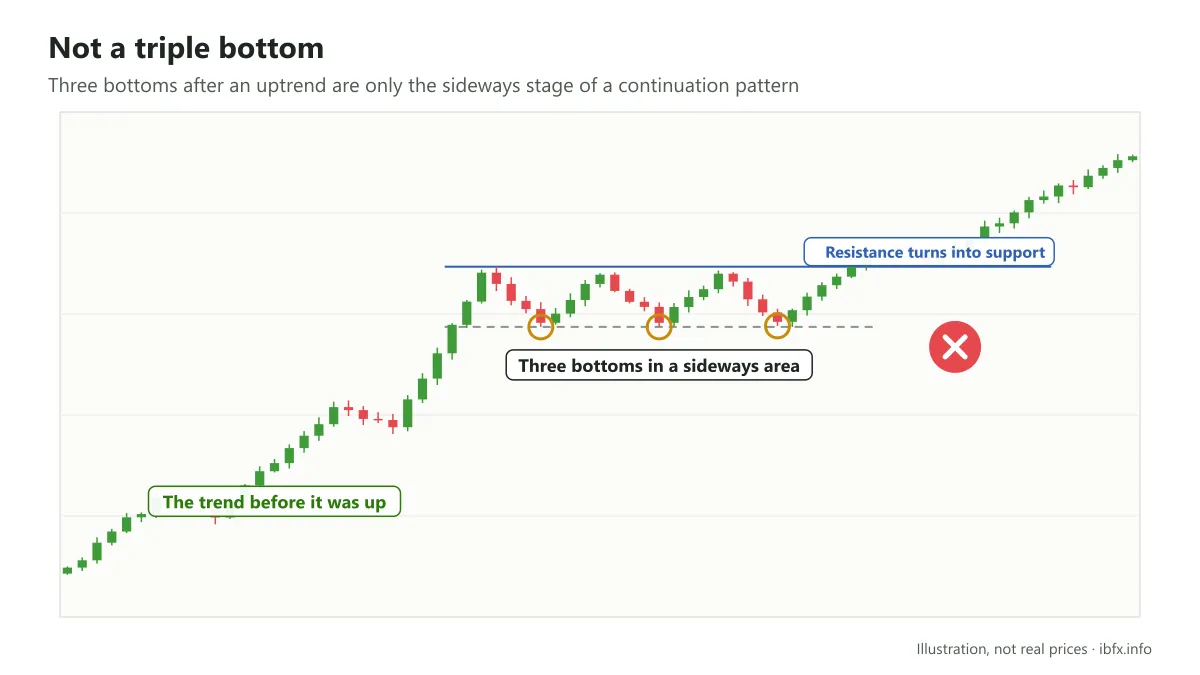
If you read this as a triple bottom, you have got it wrong.
Price makes the first bottom, rises to a swing high, falls to a 2nd bottom, then a 3rd bottom, but what came before was an uptrend, so this is only the sideways stage of a continuation pattern. Once it has consolidated enough, price breaks resistance (resistance turns into support) and carries on rising. So one of the most important parts of the triple top and the triple bottom is that the trend before it has to run against the direction of the breakout, and that you have to wait for price to break the neckline.
And here is a clean triple bottom:
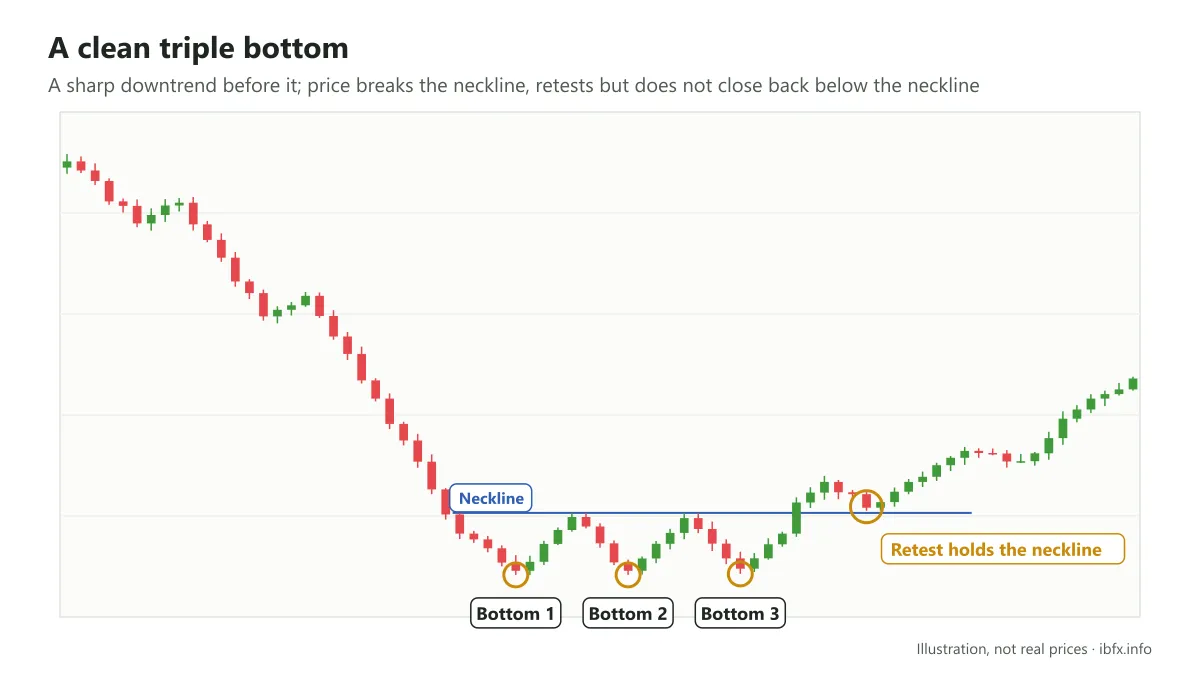
The trend before it is a very sharp downtrend.
Price falls to the first bottom, bounces to the first swing high, falls again to the 2nd bottom, bounces to the 2nd swing high, then falls to the 3rd bottom, and finally breaks the neckline and rises.
After the neckline breaks, price only goes up a short way before coming back to retest at the circled area; price does not close back below the neckline, and only then does it carry on rising.
How to trade the triple bottom
The triple bottom is traded the same way as the triple top:
- Enter when price breaks the neckline
- Or wait for price to retest the neckline before you enter
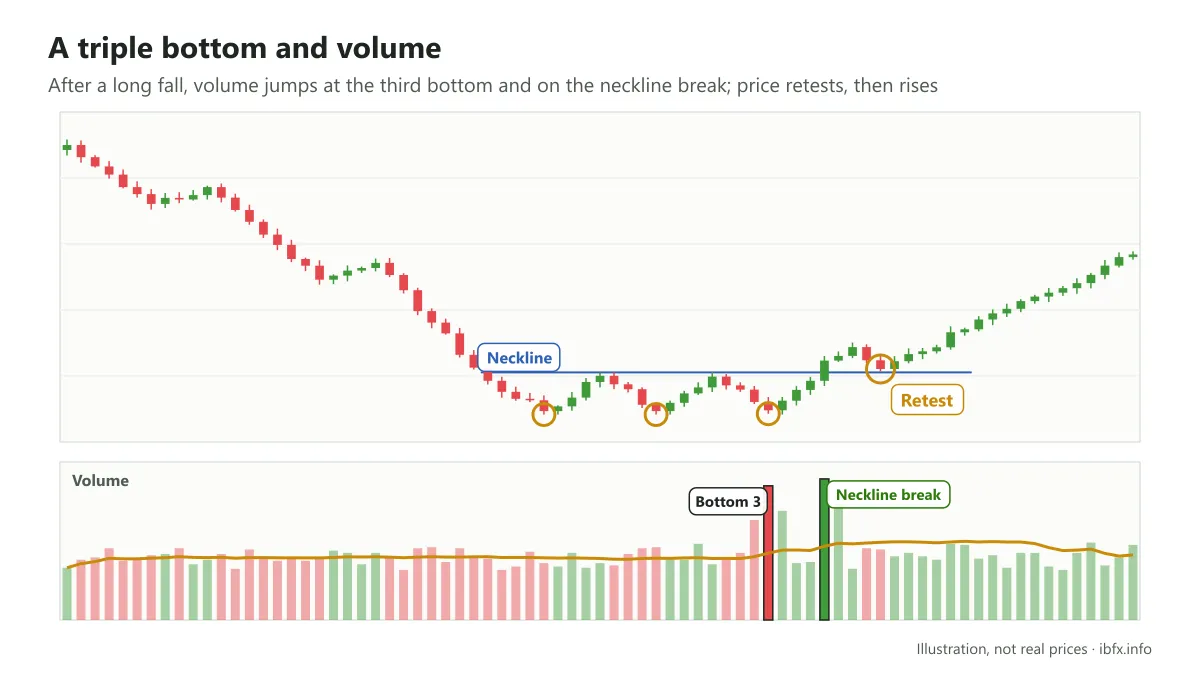
As you can see, after a very long fall, price makes the first bottom, the 2nd bottom and the 3rd bottom, then breaks the neckline and moves up.
Price then retests the neckline and carries on rising, so in this example entering on the break and entering on the retest both came out in profit. Note as well that trading volume jumps at the area of the 3rd bottom and at the breakout. With a triple top or a triple bottom you need to watch 2 things:
- One, price has to break the neckline (a candle closes on the other side of the neckline).
- Two, watch the trading volume for extra confirmation of the breakout.
Here is another example of a triple bottom:
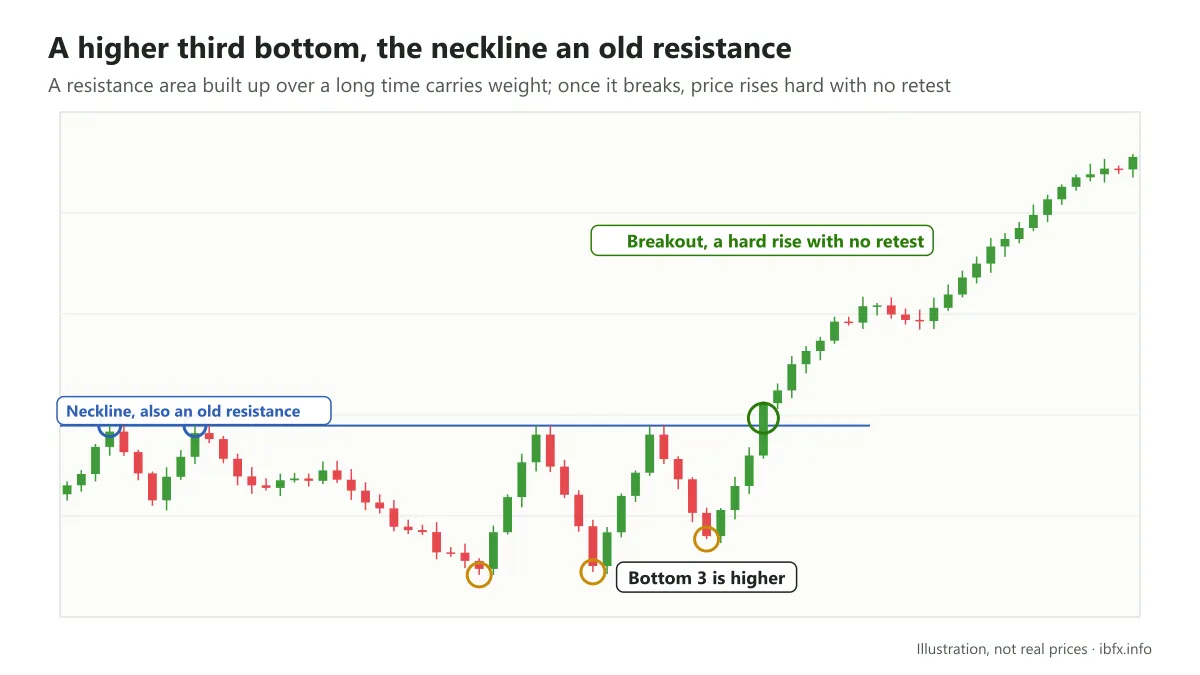
Here price makes 3 bottoms, and the 3rd bottom is not level but higher than the ones before it, yet this is still a clean pattern.
That is because there is a clear trend before it, and the horizontal line is both the neckline and a resistance area.
This resistance area was built up a long time ago, so it carries a lot of weight. When price broke through the line, it did not come back to retest but rose hard straight away.
So there are cases where waiting for the retest means missing the trade, while entering on the break gets you a better price; each way has its own strengths and weaknesses.
Newer traders should still think about waiting for price to retest the neckline, because:
- It gives extra confirmation that the pattern really has formed.
- It cuts the risk of being caught by a false break, at the cost of missing some chances.
On the subject of the retest, look at the example below:
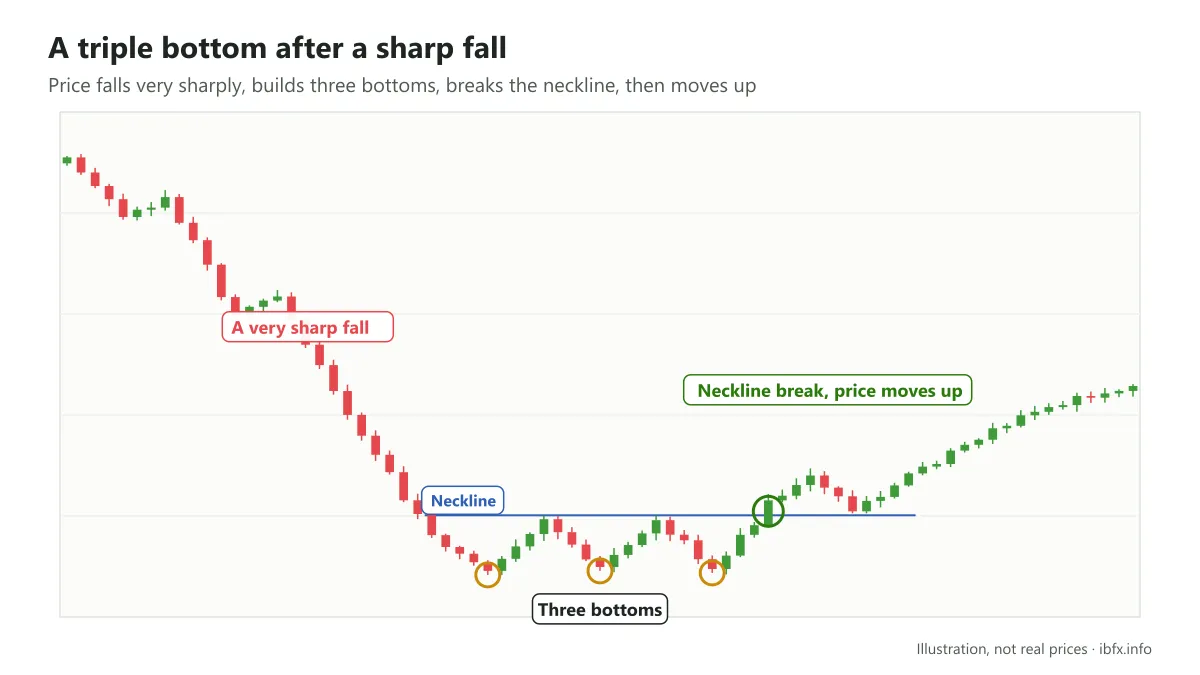
Price falls very sharply, and after making 3 bottoms and breaking the neckline it moves up.
Price then retests the neckline and carries on rising hard. You can use either of the 2 ways just described, and you always have to put the stop loss below the lowest bottom of the pattern:
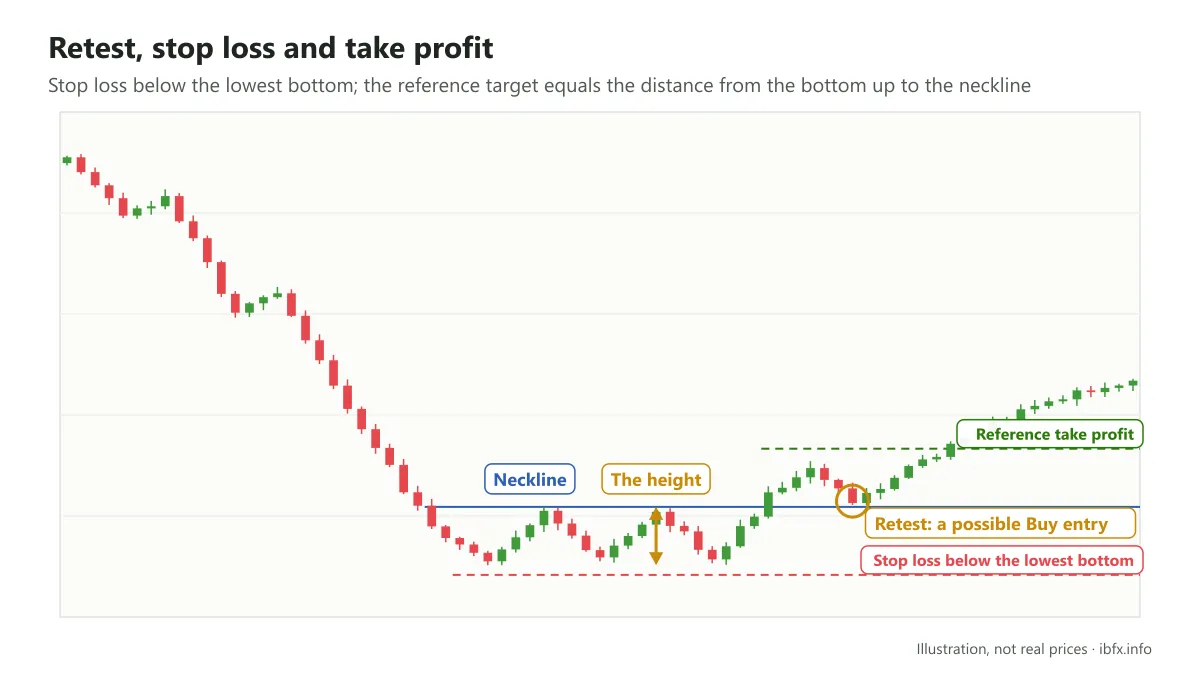
Put the stop loss below the bottom, far enough to clear the noise; the larger the timeframe, the wider that distance.
That is why you have to work out your position size from the stop loss distance, so that if the trade loses, the account only gives up a small part of itself. See also: The 2% money management rule.
Some questions about the triple top and triple bottom
Is the triple top and triple bottom a reversal or a continuation pattern?
The triple top and triple bottom are reversal patterns.
What kind of stage is the market in while a triple top or triple bottom plays out?
It is usually seen as a stage of consolidation, with price moving sideways. If you see that the market may be forming a triple top or a triple bottom, think about staying out, because price going up and down over and over makes trading very hard; wait for price to break the neckline before you enter.
How much is the triple top and triple bottom worth next to the double top and double bottom?
Plenty of traders hold that the signal from a triple top or triple bottom is more reliable because the resistance or support area has been tested more times. But this pattern turns up less often, and no pattern is right every time, so you still have to place a stop loss.
These patterns are basic knowledge, but a great many schools of trading use them, Price Action among them. Practice spotting the pattern on a demo account before you put it into your own trading system.