On this page
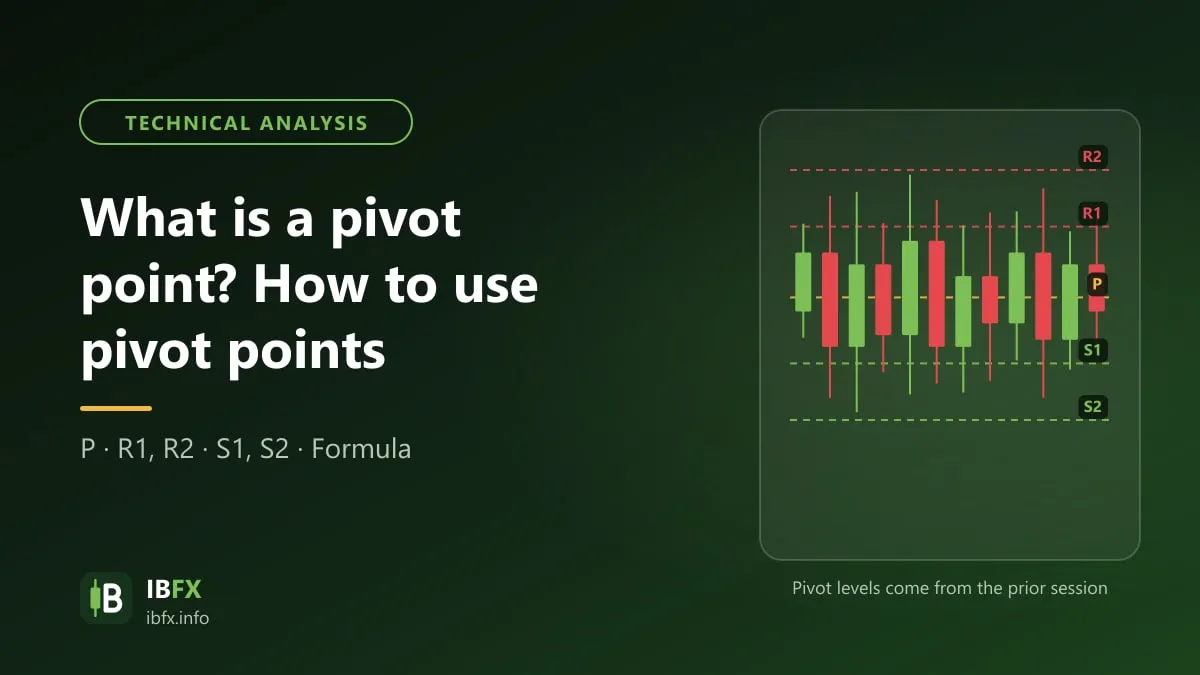
Pivot points split the chart into zones with ready-made boundaries: the PP in the middle, R1, R2 and R3 above it and S1, S2 and S3 below. When the market has no clear trend, price tends to turn at those levels, and that is what range trading between them rests on. This article covers how to read the bias of the session, how to enter around the pivot levels and where to put the stop loss.
What is range trading with pivot points?
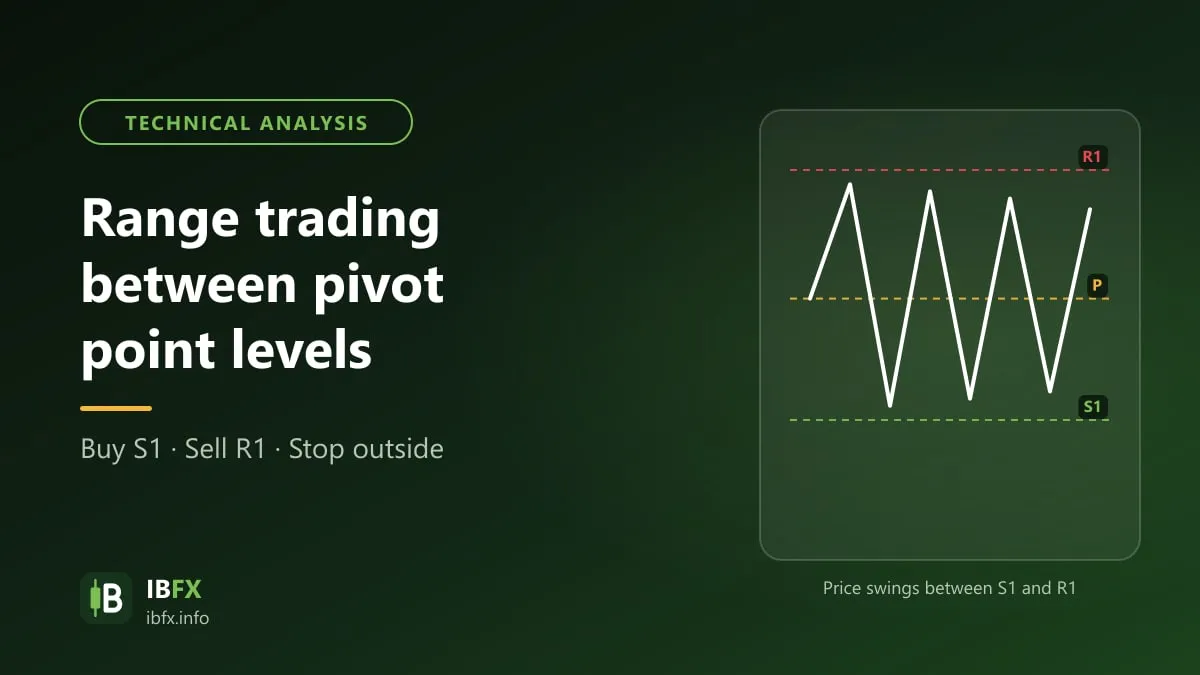
The pivot point is nothing new to traders, and a great many people use it as a familiar tool when they trade forex. The pivot point splits the chart into price zones that sit between the R, PP and S levels. Range trading here means the way you trade while price moves between those zones: buying near a support level, selling near a resistance level, or going with price when it breaks a level. So how do you trade between these price zones?
What is a pivot point?
The central price level (the pivot point) is worked out from the high, the low and the closing price of the previous day (or the previous period), added together and divided by three:
Pivot point = [High (previous) + Low (previous) + Close (previous)] / 3
Read more: What is a pivot point? How to calculate the pivot point
Besides the pivot point there are 6 other price levels, three support levels and three resistance levels, all of them worked out from the pivot point.
The three resistance levels are called R1, R2 and R3 (R for Resistance). The three support levels are called S1, S2, S3 (S for Support). From top to bottom the order is R3, R2, R1, the pivot point, S1, S2, S3; the price range between two neighboring levels (between PP and R1, or between R1 and R2, for example) is a price zone.
These values are worked out as follows:
- Resistance 1 (R1) = (2 x Pivot point) – Low (previous period)
- Support 1 (S1) = (2 x Pivot point) – High (previous period)
- Resistance 2 (R2) = Pivot point + (High – Low) (previous period)
- Support 2 (S2) = Pivot point – (High – Low) (previous period)
- Resistance 3 (R3) = Resistance 1 + (High – Low) (previous period)
- Support 3 (S3) = Support 1 – (High – Low) (previous period)
You do not have to work these formulas out yourself: TradingView and many other platforms come with a Pivot Points indicator, while on MT4 you need to install one. Your main job is to study how price moves between the zones, especially around the pivot point, R1 and S1. Keep in mind that the pivot value depends on the server’s daily closing time, so it can differ slightly from one broker to another.
Because those levels are based on the previous day’s high, low and close, the wider the previous day’s range, the wider the gaps between the levels on the next day. The other way round, the narrower the range, the tighter the gaps between the levels.
How to trade using the pivot point and its price zones
The pivot point was at first used mainly by stock and futures traders, and today it is also widely used in forex.
Unlike indicators that change with every candle, the pivot levels are worked out in advance at the start of the session, so a trader knows beforehand which price zones could produce a reaction, and can use them as support and resistance zones, or as stop loss and take profit levels. These are reference zones, not a certain forecast.
One thing to note is that the pivot point always sits in the middle, at the center of R1, R2, R3 and S1, S2, S3. If price is trading above the pivot point, the market for the day is seen as leaning to the upside; price can still turn down, though, so you need other tools as well to confirm the trend.
If the market is sideways, price can swing around the pivot point as in the chart below.
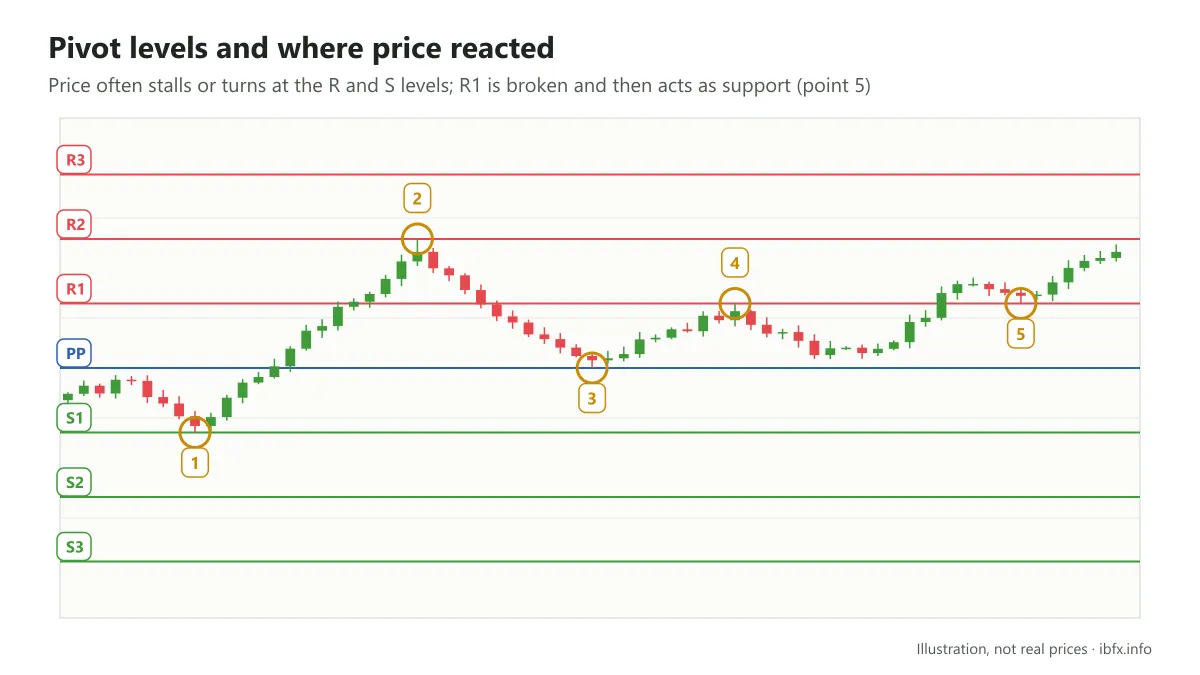
R1, R2 and R3 usually act as resistance, but once price breaks above them they can become support when price comes back down. In the same way, S1, S2 and S3 are usually support, and once they are broken they can become resistance.
So the most important thing about the pivot point is the support and resistance levels it creates.
While price moves between the zones, R1 and S1 are the main levels to watch, along with the most important level of all, the pivot point.
First, you need to work out whether the session leans to the upside or to the downside. A simple way is to compare the opening price of the current session with the pivot point: if the opening price is above the pivot point, the market is leaning to the upside; if price then keeps holding above the pivot point, that is one more sign of confirmation. If the opening price is below the pivot point, the session may lean to the downside and you can give priority to looking for short-term Sell trades.
Next, you watch how price reacts around the main levels such as R1 and S1.
Support and resistance in technical analysis
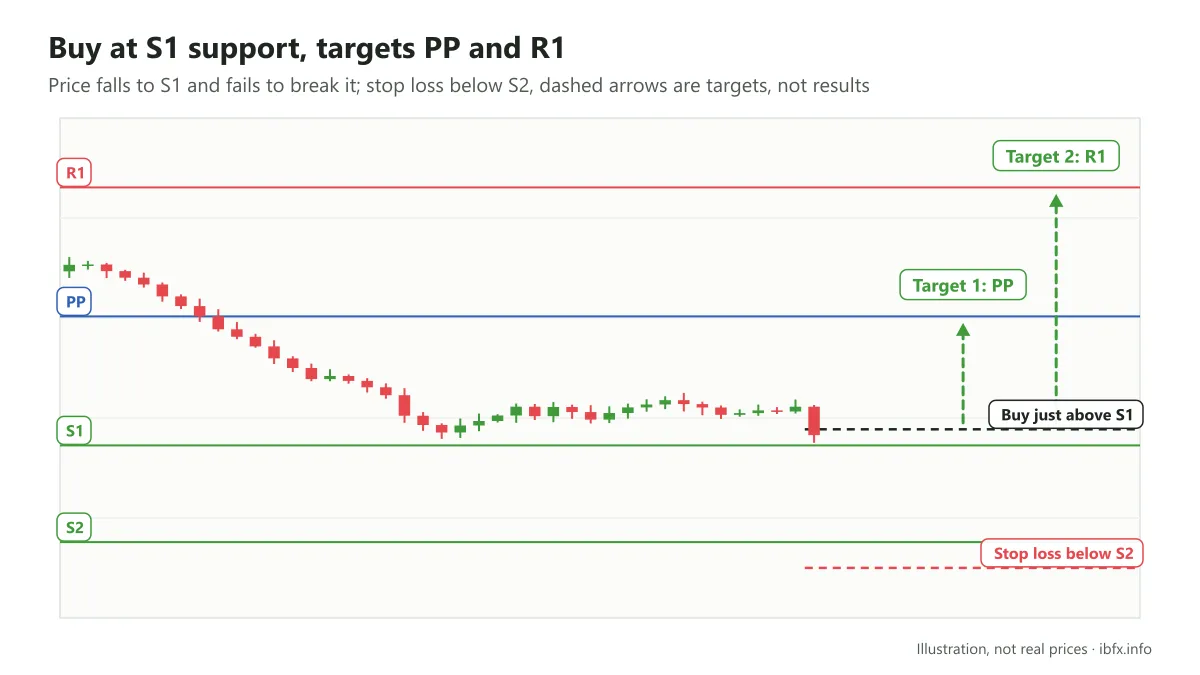
This is exactly how you put support and resistance to work: if price tests R1 or S1 but cannot get through, you can use that level to trade. Look at the following example:
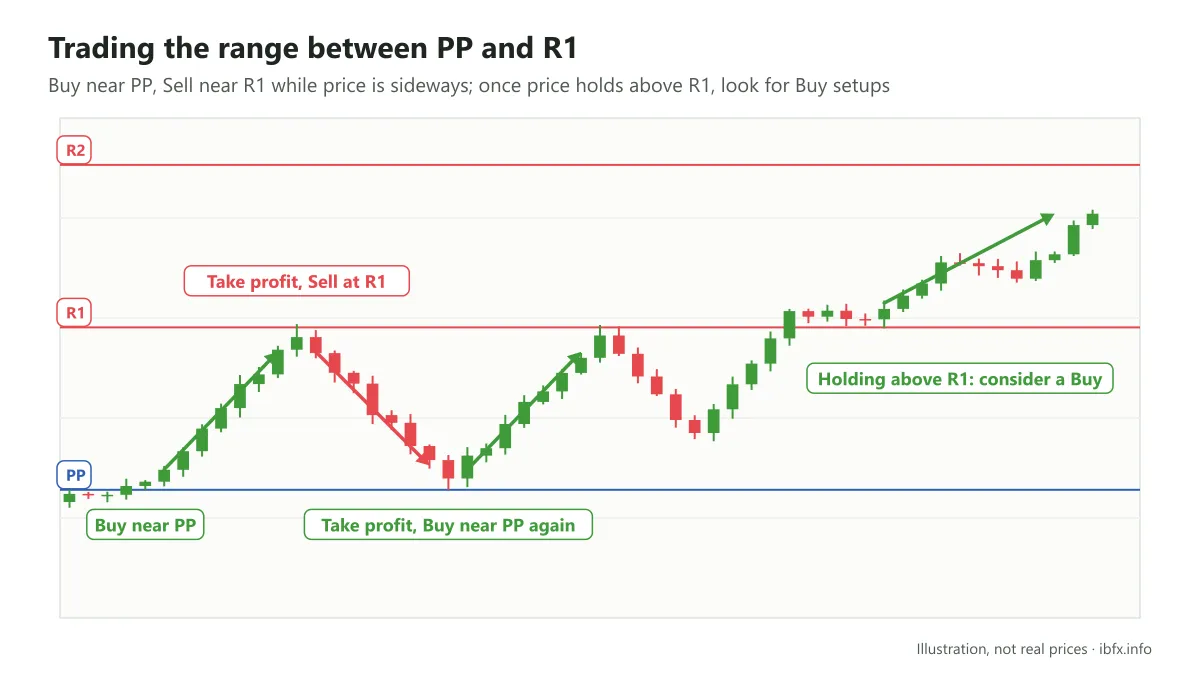
As you can see, while price was still moving sideways between the pivot point and R1, you could Buy near PP and Sell near R1. Price then broke above R1; when price breaks and holds above R1, that is an opportunity to consider a Buy, with the stop loss placed below R1.
The Buy near the PP described earlier works differently: there you place the stop loss a small distance below the nearest low wick (below the pivot point), and take profit at R1. In the example, when price reached R1 it did not get through straight away but turned back down.
After that, price tried to test R1 again but failed because it ran into resistance. The candles near R1 left long upper wicks, which shows price was rejected in the high area. This is a situation in which you can place a Sell, with the stop loss a small distance above the wicks and above R1. Price then fell, so in this illustration both the earlier Buy and the Sell ended in a profit; in real trading it does not work out that way every time.
Trading the price zones of the pivot point is fairly simple, but you should combine it with other tools such as reversal candlestick patterns, avoid trading while strong news is out, and always place a stop loss.