On this page
In forex trading, oscillators such as RSI, MACD and Stochastic are indicators that every trader has heard of at least once, because they are fairly simple to use.
Oscillators usually work best when the market moves sideways, the times when many trend indicators give noisy signals. The other way round, in a strong trend an oscillator can sit in the overbought or the oversold zone for a very long time and give a lot of wrong signals. That is why understanding the strengths and the weaknesses of an oscillator like Stochastic matters.
Carrying on our series about trading in general and forex in particular, today’s article introduces the Stochastic Oscillator, an indicator that becomes far more useful once you know how to combine it with other tools or with patterns.
What is an oscillator?
Before we get into the detail, a few words about the family of oscillators.
Indicators in this family (Stochastic among them) are usually shown in a separate window below the price chart. Following its formula, the indicator line moves up and down between an upper and a lower boundary, which lets a trader read the momentum of the market through 2 ideas that come up often: overbought and oversold.
What makes oscillators useful to a trader is that they measure the MOMENTUM of the market, that is, the speed at which price changes, and from that they give signals such as divergence and convergence or overbought and oversold conditions.
These signals are like a “fire alarm”, warning a trader to think about closing a position or to start looking for an entry, but they are not certain buy or sell orders in themselves.
There is only so much room in this article to go into momentum, but you can simply think of momentum as the speed at which price changes.
What is the Stochastic Oscillator?
Like many other oscillators, the Stochastic Oscillator belongs to the momentum family and was developed by Dr George Lane around the 1950s.
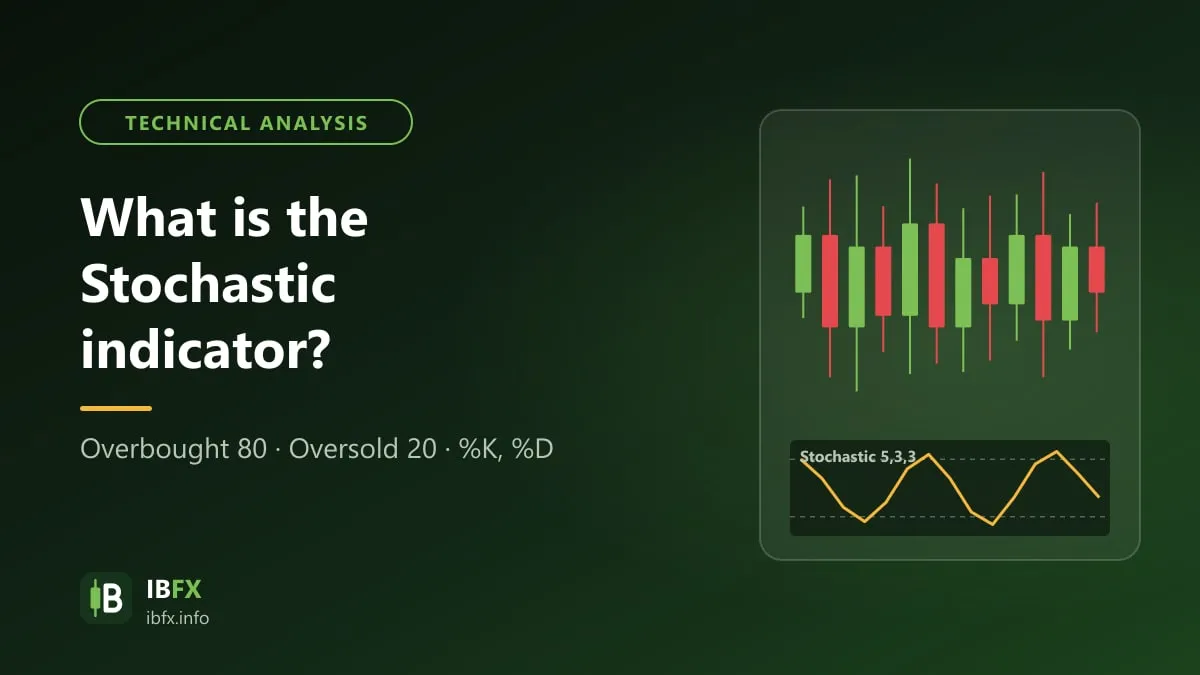
The name Stochastic is often translated as “random oscillation”, but the indicator has nothing to do with probability: it compares the closing price with the price range (high – low) over a set number of sessions. That number of sessions can be changed; TradingView uses 14 by default, while MT4 uses %K = 5, %D = 3, Slowing = 3.
According to George Lane, in an uptrend the closing price tends to sit near the top of the price range; the other way round, in a downtrend the closing price tends to sit near the bottom. So the Stochastic Oscillator tells you where the current closing price sits inside the price range of the period you have chosen:
%K = (Current closing price – Lowest price of N sessions) / (Highest price of N sessions – Lowest price of N sessions) × 100
The %K line is the faster line, while the %D line is the slower one.
The parts of the Stochastic Oscillator
The Stochastic Oscillator is made up of 2 lines:
- The main line, called %K;
- The other line, %D, which is a 3-period average of the %K line.
- Besides these 2 parts there are also 2 boundary lines set by default at 20 and 80. That means that if the indicator rises above 80 the market is in an overbought state; if the indicator falls below 20 the market is in an oversold state. A trader uses this to look for signals, together with other factors. Note that these levels can be changed, and plenty of people prefer to use 25 and 75, but a beginner should leave them at the default.
Because the %D line is built from %K, the %K line is the faster one, while the %D line is the slower one.
%K is the line that shows the real value of the oscillator in each session.
%D, meanwhile, is worked out with a simple moving average over a period of 3 days. Lane used %D to produce buy or sell signals based on bullish and bearish divergence. Lane stated that %D divergence is “the only signal that will make you buy or sell”. The signal of the %K and %D lines crossing each other is also used by many traders as a reversal signal, and the most common use of all is still watching the overbought and oversold zones.
What does the Stochastic Oscillator tell you?
The Stochastic Oscillator is range-bound, which means it always sits between 0 and 100. That makes it a useful indicator for warning about overbought and oversold conditions.
Traditionally, the oscillator rising above the 80 level is treated as an overbought signal and falling below the 20 level as an oversold signal. Of course, that on its own is not enough to say a reversal is about to happen; on the contrary, in many cases the trend carries on even though an overbought or oversold state has occurred. That is why you need to combine the Stochastic Oscillator with several other kinds of indicator to work out a change of trend, which we cover in detail below.
According to George Lane, the Stochastic Oscillator is used to compare the closing price with the high and low price range of a stock over a period of time, usually 14 days. In many interviews George Lane said that the Stochastic Oscillator does not follow price or volume or anything of the sort, only the speed or the momentum of price.
George Lane also held that the momentum of price usually changes before price changes direction. Read that way, the Stochastic Oscillator can be used to warn of a reversal when the indicator shows bullish or bearish divergence.
How to set up the Stochastic Oscillator
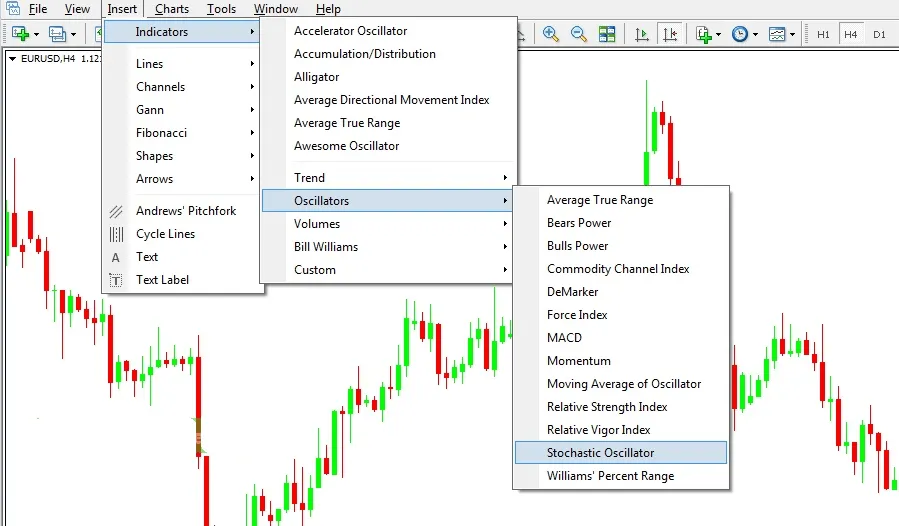
Stochastic is available on both TradingView and MT4. Here are the steps for MT4:
Open the MT4 trading platform
Then choose Insert -> Indicators -> Oscillators -> Stochastic Oscillator, as in the picture below:
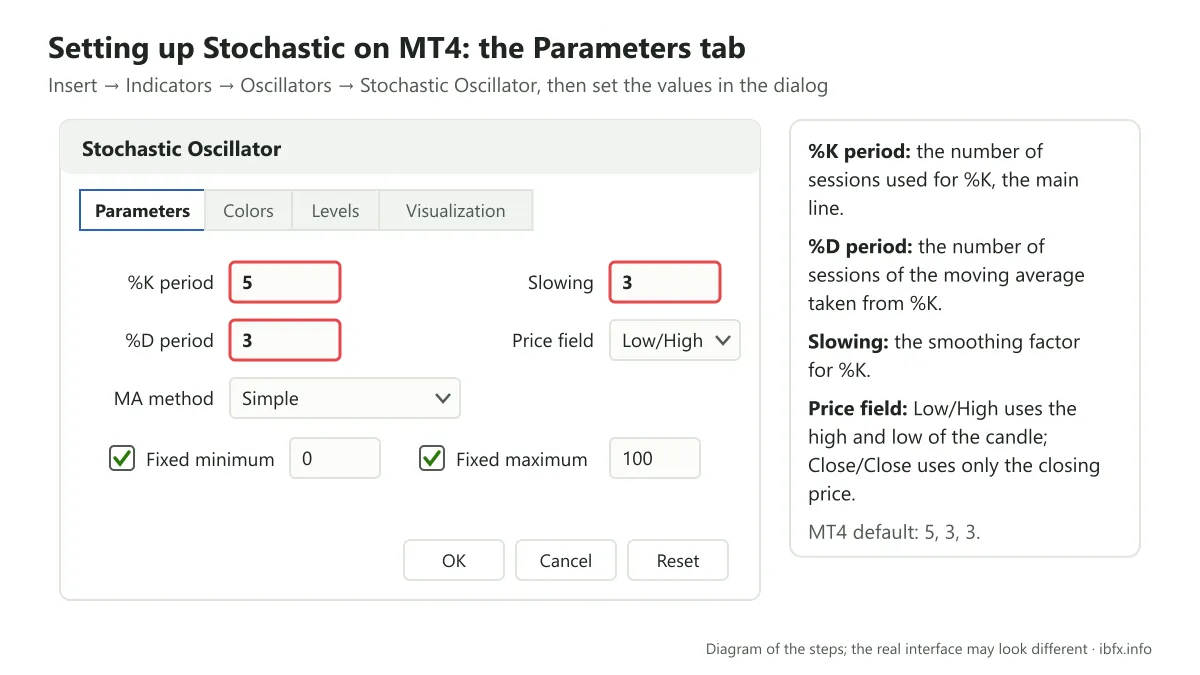
The window of this tool then appears, with the following fields:
The Parameters tab:
+ %K period: the number of sessions used to work out the %K line (the main line, drawn solid)
+ %D period: the number of sessions of the moving average worked out from %K
+ Slowing: the smoothing factor for the %K line
+ Price field: how the price data is taken, either Low/High (using the low and the high of the candle) or Close/Close (using only the closing price)
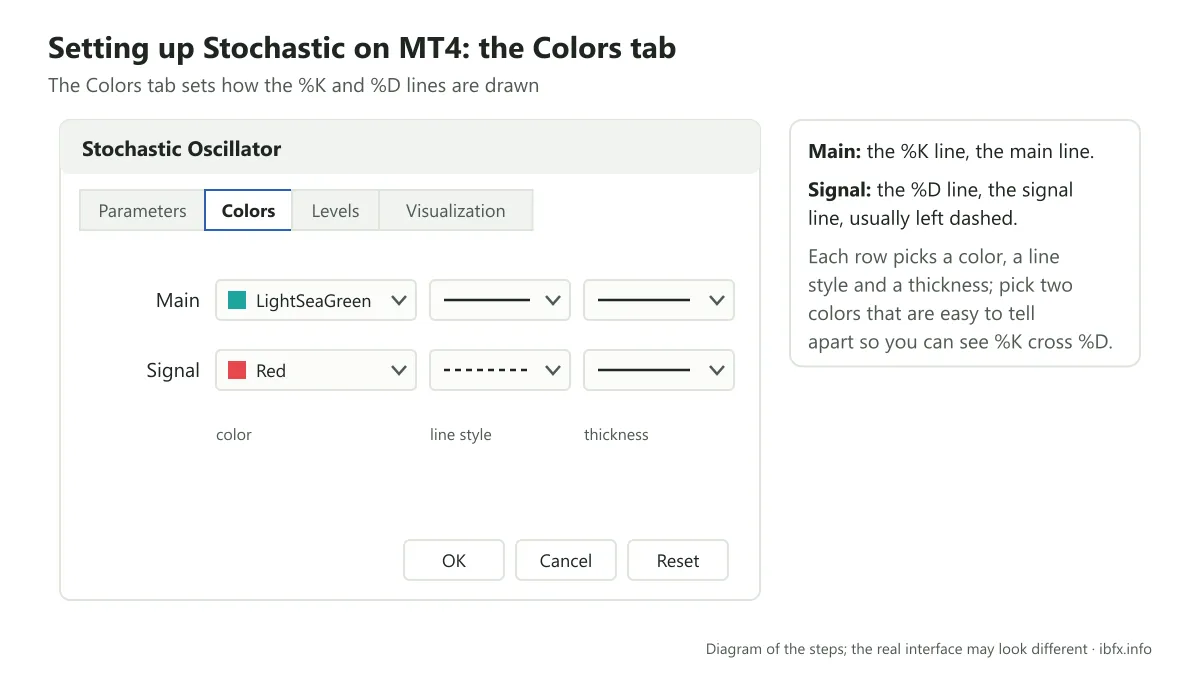
The Colors tab: where you set the colors of the %K and %D lines
+ The %K line is the main line (Main)
+ The %D line is the signal line (Signal)
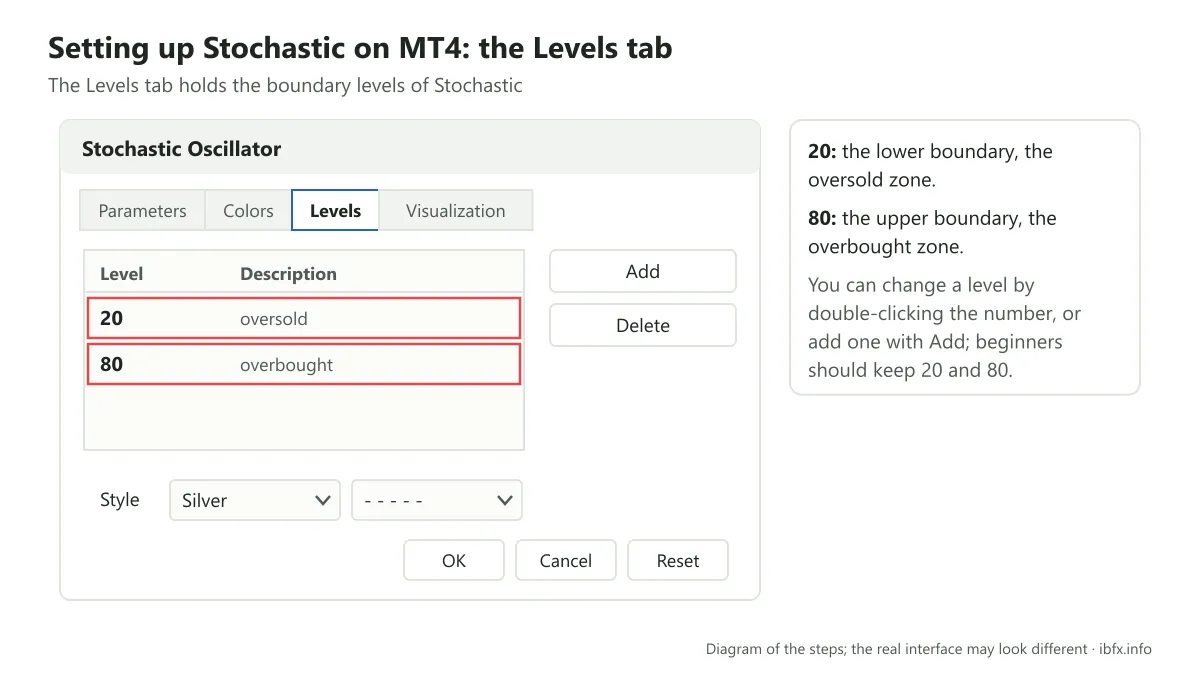
The Levels tab: the boundary levels of the Stochastic tool
+ 20: the lower boundary, also called the oversold zone
+ 80: the upper boundary, also called the overbought zone
The Visualization tab:
This is where you can choose which timeframes the tool is shown on.
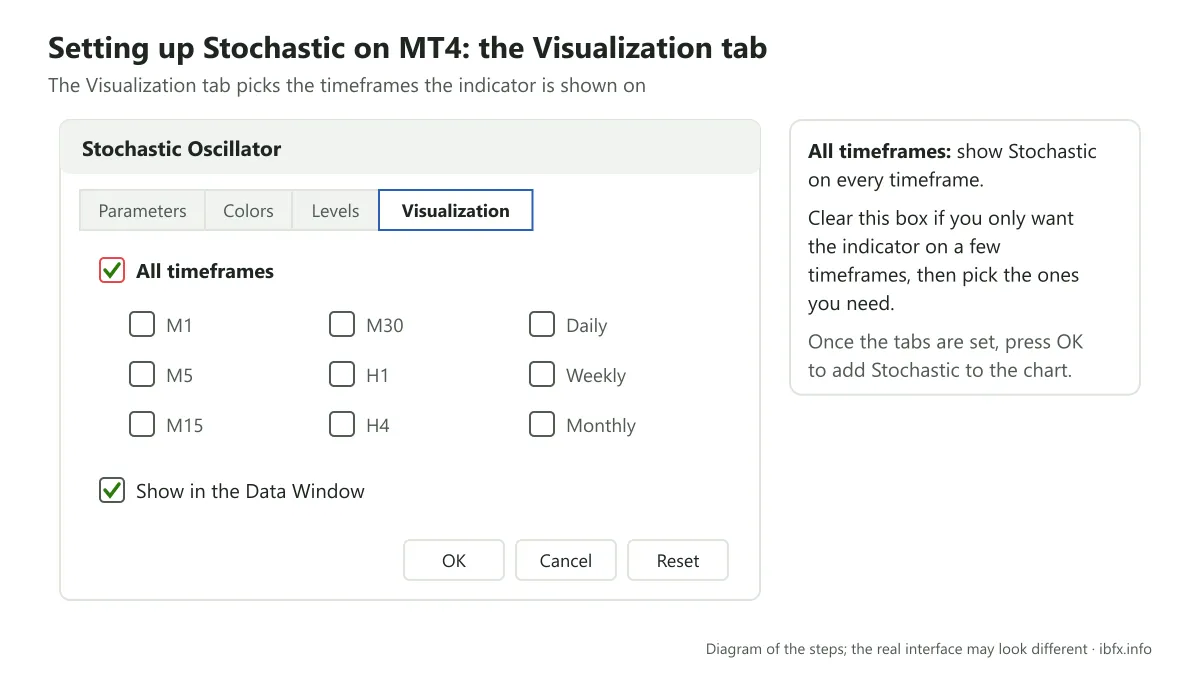
Finally press “OK”, and the tool is set up on MT4 for you to watch and to trade with.
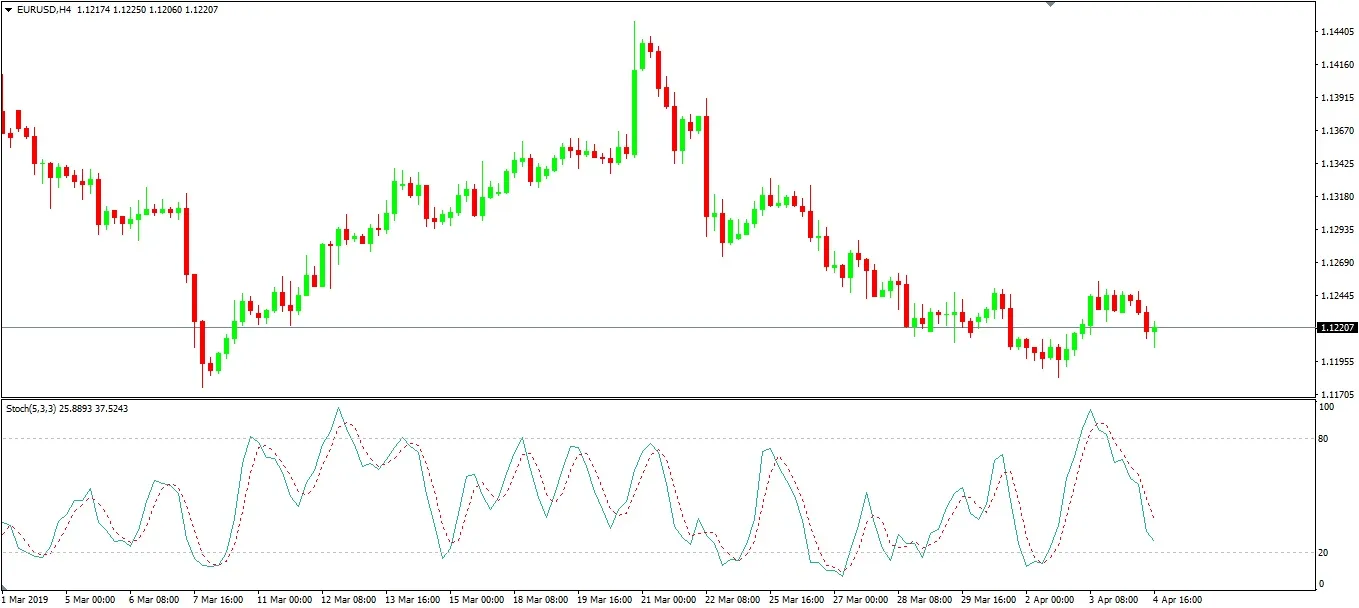
How to use the Stochastic Oscillator
At heart, like a great many other momentum indicators, the Stochastic Oscillator helps a trader work out the OVERBOUGHT and OVERSOLD zones.
That said, as the saying goes, one tree does not make a hill, but three trees together make a mountain: the Stochastic Oscillator is only really useful when it is combined with other indicators or other approaches, so that some of the noisy signals are filtered out and the trader can work out where to enter and where to exit.
Stochastic Oscillator together with RSI
This is a method many traders use, built on the idea that signals should confirm each other. RSI and the Stochastic Oscillator are both momentum indicators, so when both read overbought or oversold the signal is clearer. But because they both measure momentum, these two indicators often give the same signal; for better confirmation you should also bring in support, resistance or candlestick patterns.
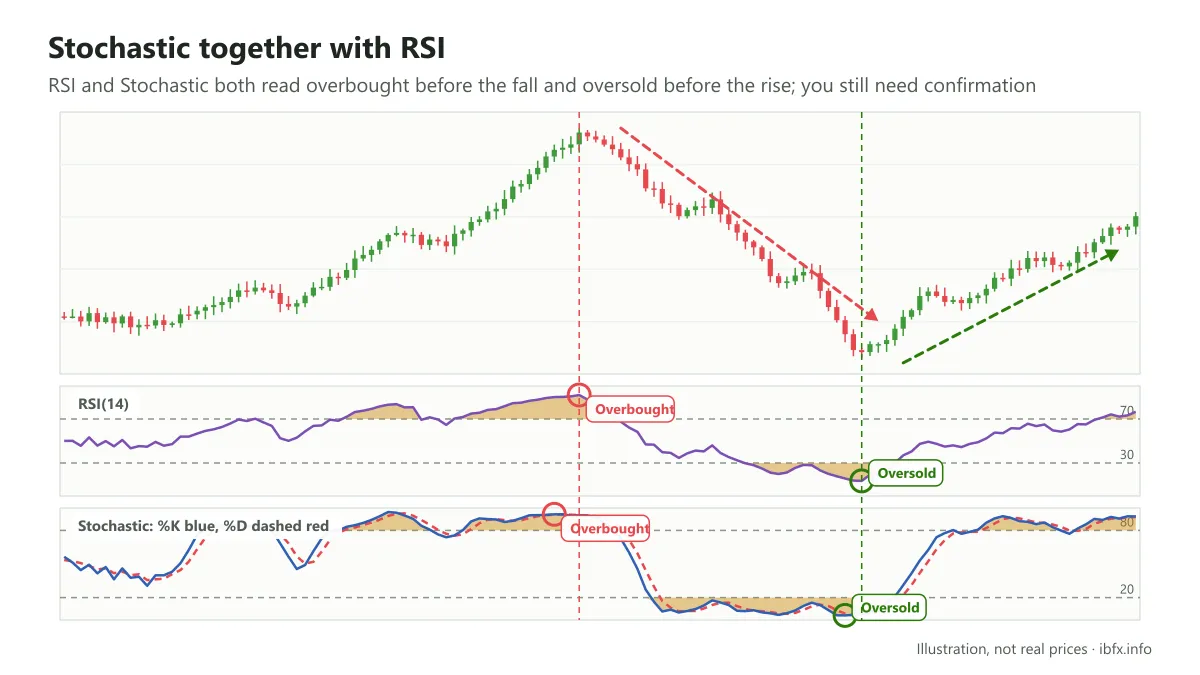
Looking at the example above, you can see that when RSI and the Stochastic Oscillator agreed on the same overbought signal, price fell quite a long way afterwards.
After that, RSI and the Stochastic Oscillator both gave an oversold signal, and price rose again.
Stochastic Oscillator with overbought and oversold signals and the trendline
This can be seen as the most common use of momentum indicators in general and of the Stochastic Oscillator in particular, because they give a trader a signal that the market has run into a state of “excess” and “surplus”, that is, that it has become overbought or oversold.
At that point the trader either chooses to close a position that is already open, or starts to watch the signal the Stochastic Oscillator has just given, then waits for a trendline break to confirm that the signal from the Stochastic Oscillator was right and enters the trade. Look at the example below to see more:
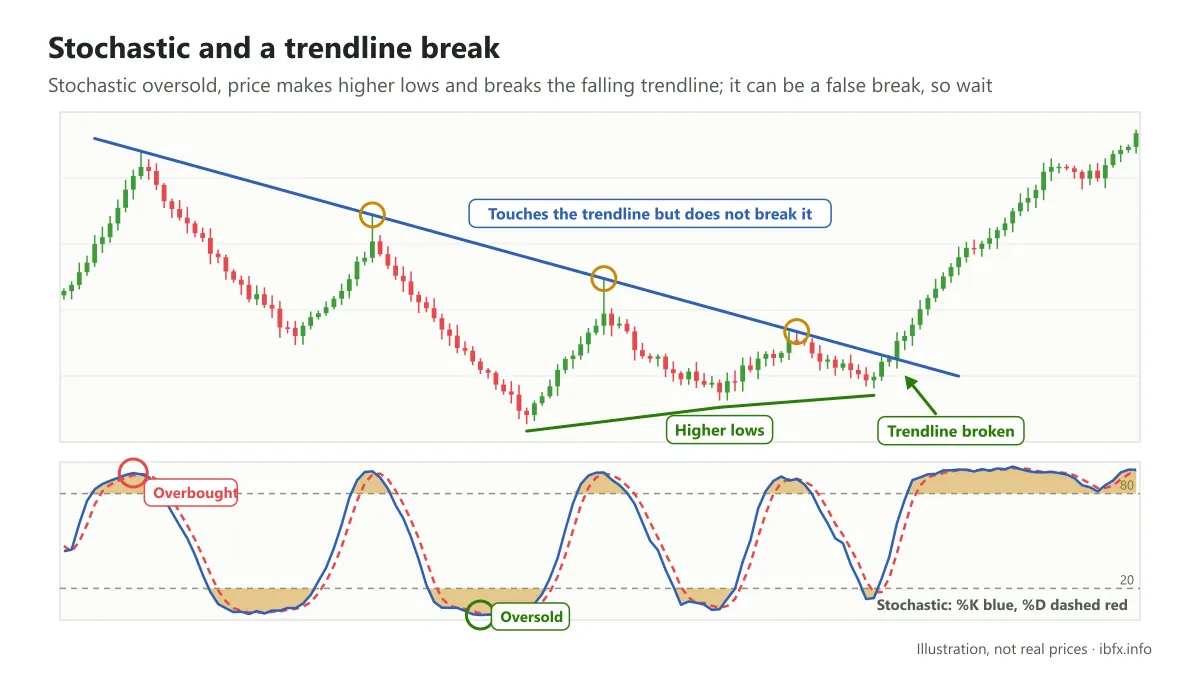
You can see that after the Stochastic Oscillator showed signs of being overbought, price started to make lower highs and lower lows, and then price fell.
Price touched the trendline above it many times but could not break it. Once the Stochastic Oscillator gave an oversold signal, price started to make higher lows, then broke the trendline and rose sharply.
After watching a higher timeframe like the one above (H1, for example), you may want to look at smaller timeframes to enter.
Experienced traders usually do not enter the moment price breaks a trendline; they may wait for a signal that confirms it, because in many cases price makes a “false break”, meaning that after the break it falls rather than rises, or the other way round.
For that reason, a safer approach is to wait for price to retest the zone it has just broken, together with a moment when the Stochastic Oscillator falls into an oversold state:
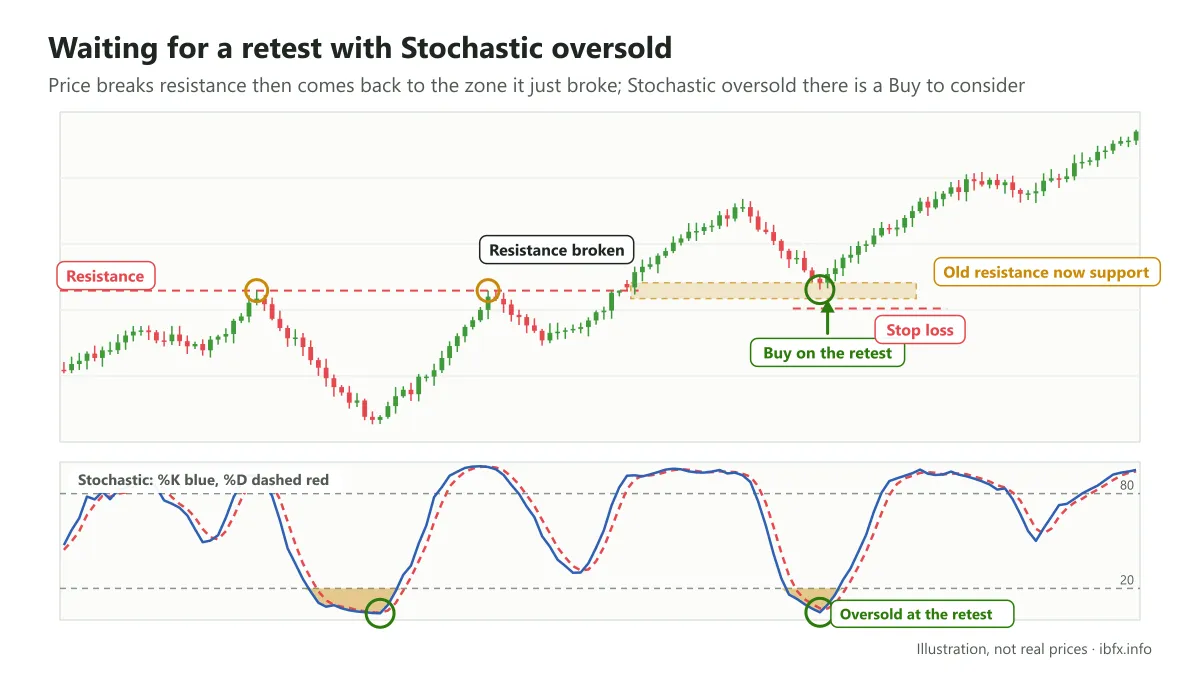
You can see that price pulled back down to the old resistance zone (which now acts as support), while the Stochastic Oscillator signaled oversold. When all the signals come together, the earlier trendline break, the pullback retesting the old resistance zone and the Stochastic Oscillator reading oversold, this is a situation worth considering for a Buy, with the stop loss below the retest zone.
So from the 2 uses above you can see that the Stochastic Oscillator is far more useful when it is combined with other tools. You can also combine the Stochastic Oscillator with reversal candlestick patterns or with EMA lines and MACD.
Stochastic Oscillator with reversal candlestick patterns
A reversal candlestick pattern shows how price actually reacted, so when one appears together with an overbought or oversold signal from the Stochastic Oscillator the signal is usually more reliable.
For the reversal patterns, you can read this detailed article:
You need to understand these patterns well, and the moment a reversal candle appears in an area where the Stochastic Oscillator is also giving an overbought or oversold signal is the moment you can enter. Look at the example below to see more:
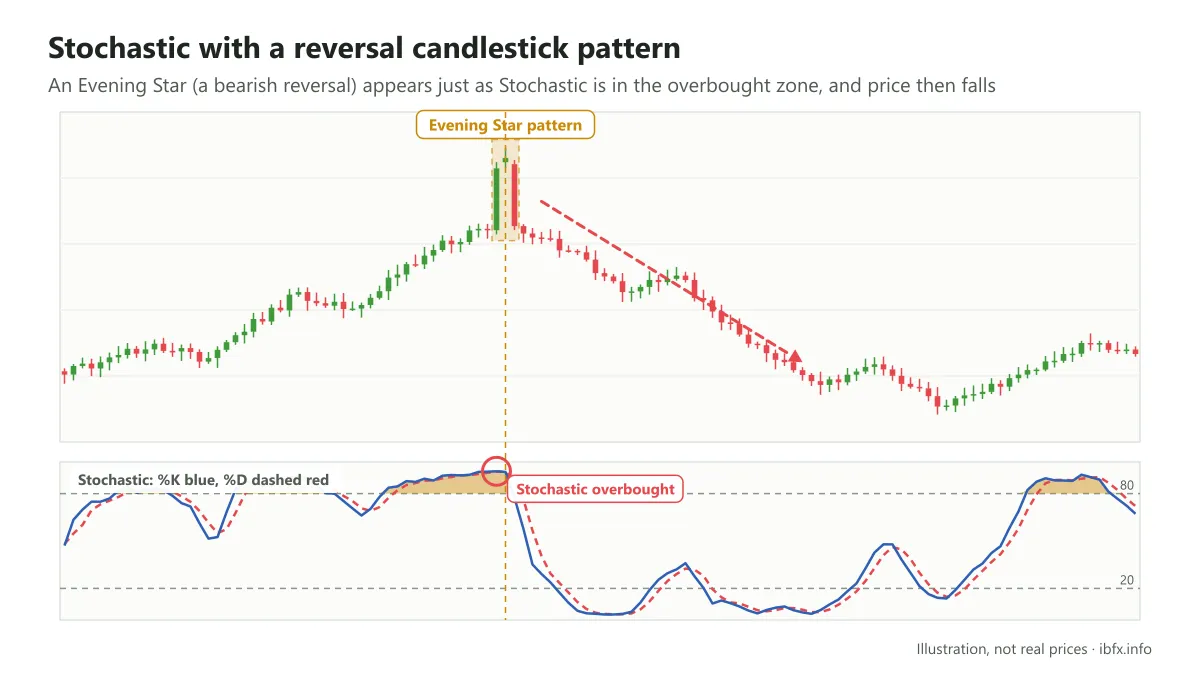
Three candles make up the Evening Star pattern (a bearish reversal pattern) just as the Stochastic Oscillator sits in the overbought zone, and price then fell, as you can see in the picture above.
Combining the Stochastic Oscillator with price patterns
Price patterns are also one of the things you have to know if you want to trade forex. There are 2 basic kinds of price pattern: continuation patterns and reversal patterns.
It works much like the ways of combining the Stochastic Oscillator with other indicators we covered above. To use it, you need to spot the pattern, and when the pattern forms at the same time as the Stochastic Oscillator moves into the overbought or oversold zone, you wait for the pattern to break before you enter, which tends to work out better.
Look at the example below to understand how the signals from the Stochastic Oscillator line up with all the other indicators and patterns.
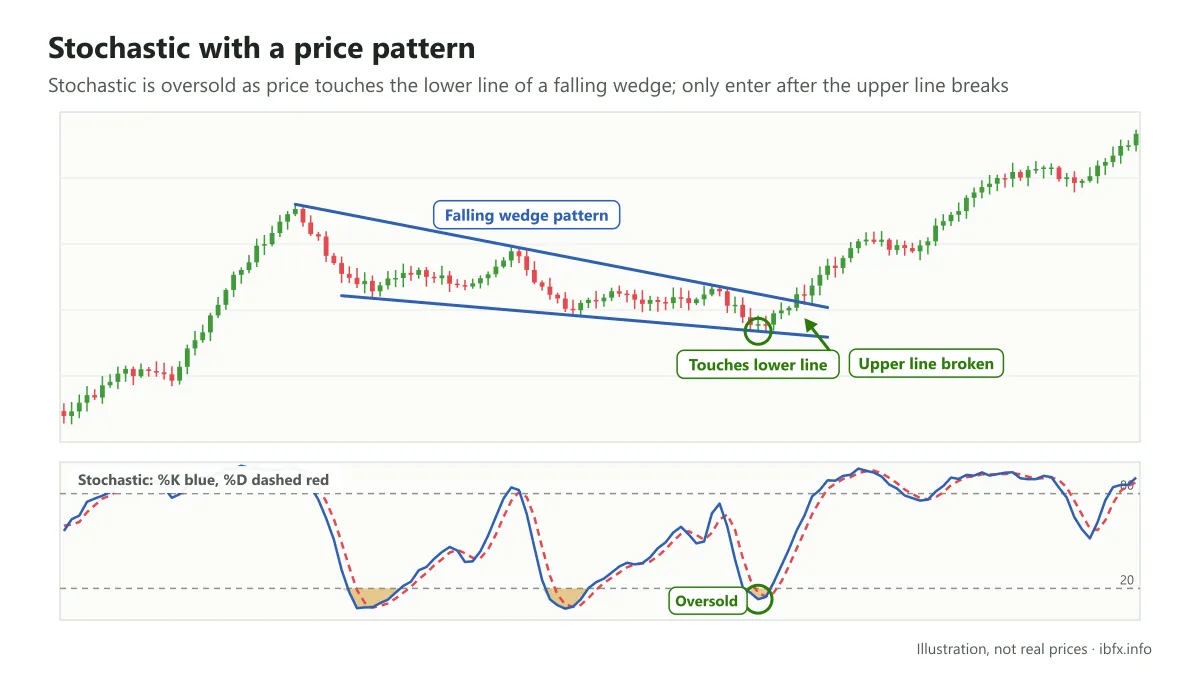
Price formed a wedge pattern, and at that point the Stochastic Oscillator gave an oversold signal, suggesting that price might break the upper line. In this example, price rose after it broke the upper line of the wedge; wait for a real break before you enter.
Stochastic Oscillator with the Moving Average
The moving average is one of the most flexible indicators and one of the most used by traders, because it is one of the tools that can help you recognize or signal that a trend has ended or reversed. On top of that, the EMA is very personal: each trader uses the value of the EMA line in a different way, some preferring the EMA 200, others the EMA 34, the EMA 89 or the EMA 9. The longer the period of an EMA, the more people watch it and the harder that “barrier” is to get through.
So if price closes and stays above the EMA it is treated as an uptrend, while if price closes and stays below the EMA it is treated as a downtrend.
From that, you have probably already worked out how to combine the EMA with the Stochastic Oscillator, haven’t you?
If price is above the EMA line (an uptrend) and the Stochastic Oscillator moves into the oversold zone, you can look for a Buy; the signal is stronger still if a bullish reversal candlestick pattern also appears.
The other way round, if price is below the EMA (a downtrend) and the Stochastic Oscillator moves into the overbought zone, you can look for a Sell, as in the example below:
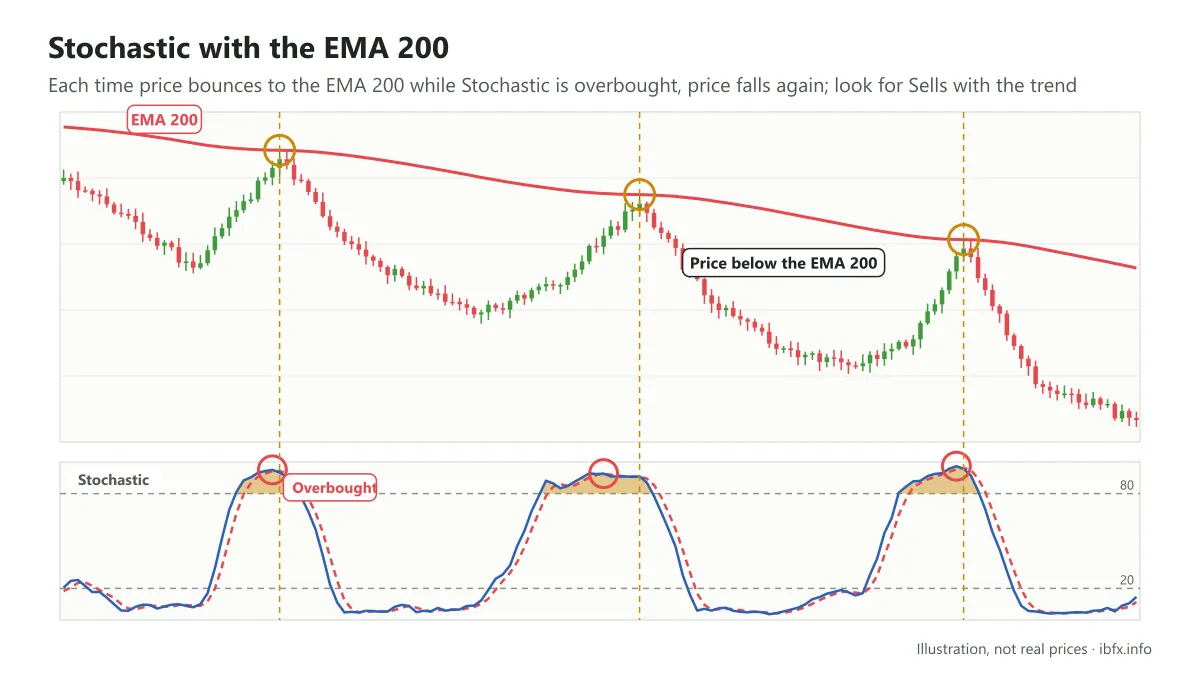
You can see that price bounced up close to the EMA 200 several times in a row without getting through it. Each of those bounces was also a moment when the Stochastic Oscillator moved into the overbought zone, and price then carried on falling.
A few things to keep in mind about the Stochastic Oscillator
Seeing an oversold or overbought signal from the Stochastic Oscillator does not mean you should enter straight away.
As mentioned earlier, the Stochastic Oscillator needs agreement from other signals such as the RSI indicator, a trendline or reversal candlestick patterns before you can settle on an entry, and when several different kinds of signal agree the odds that the market follows the analysis are usually better, though never certain.
The larger the timeframe the Stochastic Oscillator is read on, the more reliable the signal usually is
This is true not only of the Stochastic Oscillator but of any indicator or pattern: the smaller the timeframe, the noisier the signal and the easier it is to be misled.
Always trade with the trend
Working out which way the market is trending is the first condition for cutting down risk; see also how to read Japanese candlestick charts and what a trend is. The Stochastic Oscillator is only one indicator among many, so besides combining several factors you should trade with the market: when the market is falling, wait for a bounce to sell; when it is rising, wait for a pullback to buy. This matters a great deal for traders who are new to the job: do not try to trade against the trend.
How to enter a trade with the Stochastic Oscillator
As mentioned, to use the Stochastic Oscillator you first need to work out the trend on a higher timeframe such as D1.
After that, look for a signal on smaller timeframes such as H1, M30 or M15, combining the Stochastic Oscillator with the tools and patterns covered above.
Always place the stop loss on the far side of the nearest high or low, or of the resistance or support zone, far enough away not to be swept, and work out your position size from the stop loss distance. Practice on a demo account before you trade for real.