On this page
- A history of the oil price worldwide
- Supply, demand and the futures market
- Who trades oil?
- The factors the market watches when it prices oil
- How do crises and conflicts affect the oil price?
- How natural disasters affect the oil price
- Long cycles in the oil price
- The decisions of OPEC and OPEC+
- How does the oil price affect the forex market?
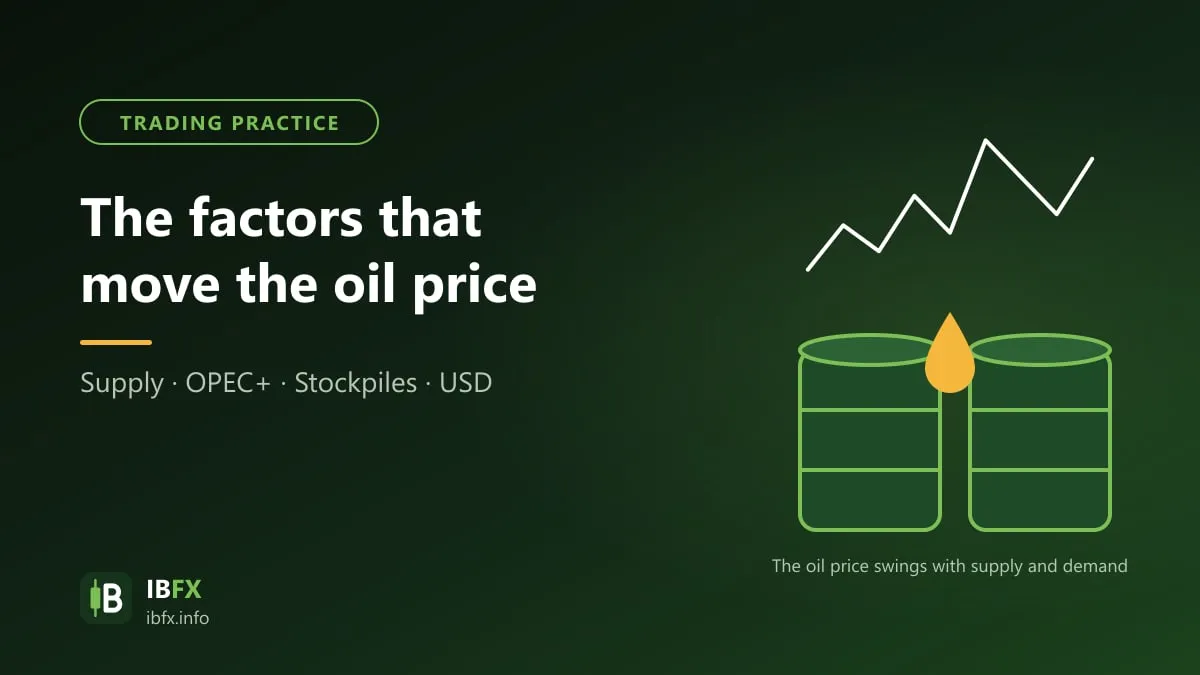
Oil plays a very important part in the global economy, because most transport and many industries still depend on it. That is why the oil price can reach the economy at every level, from what each household spends and what a business earns through to the inflation rate and the GDP growth of a country. Oil is also extremely sensitive to geopolitical events, to policy and to the news, so the price can change very quickly. So what are the factors that move the world oil price?
A history of the oil price worldwide
In the earliest days oil was not valued at all; many wells were drilled for brine, and the oil that came up with it was seen as a nuisance. In 1857 Romania became one of the first countries with recorded commercial oil output, and the United States oil industry was born in 1859 with Edwin Drake’s well at Titusville, Pennsylvania.
At first the demand was mainly for kerosene for lamps. In 1901 the Spindletop well in southeastern Texas blew in at an initial rate of about 100,000 barrels a day, more than all the other oil wells in the United States put together. Many people treat 1901 as the beginning of the modern oil era, although it was not until the 1960s that oil overtook coal to become the largest source of energy in the world.
From then until now the oil price has risen and fallen very erratically. Oil once peaked at about 147 USD a barrel in July 2008, then dropped to around 30–35 USD a barrel only a few months later, and Brent traded around the 70 USD mark in 2018. In April 2020, WTI crude futures even traded below 0 USD a barrel at one point as demand collapsed in the pandemic. These changes in the price depend on the factors set out below.
Supply, demand and the futures market
In principle, when demand rises (or supply falls) the price rises; when demand falls (or supply rises) the price falls. That sounds simple, but in practice it is far more complicated, because the market reacts not only to supply and demand today but to expectations about the future as well.
The world oil price is formed mainly on the futures market, where buyers and sellers agree today on a price for a cargo to be delivered at some point in the future. The two most common benchmark grades are WTI crude, traded on the NYMEX exchange (part of CME Group) in the United States and supervised by the US Commodity Futures Trading Commission (CFTC), and Brent crude, traded on ICE Futures Europe in London.
The CFTC was created in 1974, and WTI crude futures began trading on NYMEX in 1983. Governments and OPEC do not set the oil price directly, but their decisions on output, on reserves and on embargoes weigh heavily on supply and demand, and through that on the price traded on the market.
Who trades oil?
The people in the oil market can be divided into two main groups:
- Hedgers: producers, refiners, airlines, transport companies and so on. They buy or sell futures contracts to fix the price of oil for a point in the future, which helps them plan financially and reduces the risk of the price moving.
- Speculators: funds, banks, individual investors and so on. They have no use for the oil itself and trade to profit from the movement in the price.
The factors the market watches when it prices oil
There are three main groups of factors the market cares about: supply today, the forecast for supply in the future, and the demand for oil.
Output supply
OPEC and its partner countries account for a large share of world oil output and exports. Shale oil output in the United States, however, rose steeply over 2011–2014 and created a surplus of oil, which pushed the oil price down from above 100 USD a barrel in mid-2014 to around 45–50 USD a barrel in early 2015, and then below 40 USD a barrel at the end of 2015.
Before that, OPEC had usually cut output to hold the price up. In November 2014, though, OPEC decided not to cut and let the oil price slide. Many analysts believed OPEC wanted to put pressure on US shale producers, who needed a high enough oil price to cover their costs and their high-interest debt, and to hold on to its market share that way.
The forecast for supply in the future
The market follows oil inventories closely, and the weekly crude oil inventory report from the US Energy Information Administration (EIA) above all, usually published on Wednesday evening at 21:30 GMT+7 (14:30 UTC), or 22:30 GMT+7 (15:30 UTC) when the United States is not on summer time. Inventories rising by more than forecast usually puts downward pressure on the price, and the other way round.
The United States also has the Strategic Petroleum Reserve (SPR), which stores oil in underground salt caverns along the Gulf of Mexico. In an emergency, or when the price is too high, the government can release the reserve to add to supply, as it did in 2022.
The demand for oil
The United States is the largest oil consumer in the world, accounting for about one fifth of global demand, followed by China, which has been one of the biggest drivers of demand growth for many years. Demand forecasts are published monthly by the EIA, by the International Energy Agency (IEA) and by OPEC. Gasoline demand in the United States usually rises in the summer, the driving season (the forecasts of the American Automobile Association, AAA, are often consulted), while demand for heating oil rises in winter. On top of that, strong or weak global economic growth feeds directly into the demand for oil.
How do crises and conflicts affect the oil price?
Crises and conflicts in oil-producing regions usually push the oil price up appreciably, because the market fears supply will be disrupted.
In late 2011 and early 2012, the United States and the European Union increased financial and oil sanctions on Iran over its nuclear program. Iran replied by threatening to close the Strait of Hormuz, the route that carries about one fifth of the oil consumed in the world. WTI crude traded around 95–100 USD a barrel from November 2011 to January 2012, and then went above 100 USD a barrel in February 2012.
In the same way, the unrest in Libya, Egypt and Tunisia during the “Arab Spring” of 2011 took WTI crude above 100 USD a barrel in early March and to a peak of about 113 USD a barrel at the end of April 2011. When supply was not disrupted as seriously as had been feared, the oil price came back below 100 USD a barrel in mid-June.
In 2006, the Israel–Lebanon conflict raised fears that tension would spread across the region, taking the oil price from about 70 USD a barrel in May to nearly 78 USD a barrel in July.
The examples above show that political events make the oil price move sharply and unpredictably, but that if supply is not actually affected the price can turn back just as quickly.
How natural disasters affect the oil price
Natural disasters can push oil and gasoline prices high as well. In 2005 the two hurricanes Katrina and Rita destroyed 113 offshore rigs and damaged 457 oil and gas pipelines in the Gulf of Mexico, sending the oil price sharply higher and taking the gasoline price in some parts of the United States up to 5 USD a gallon. In May 2011, flooding on the Mississippi river that threatened refineries also helped push the average gasoline price in the United States to nearly 4 USD a gallon.
Long cycles in the oil price
Some analysts hold that commodity prices, oil among them, run in cycles of several decades. This is only an observation from history, not a rule you can forecast with.
Measured in inflation-adjusted prices, oil has had major peaks around 1920, 1980 and 2008. The 1980 oil price is the equivalent of more than 100 USD a barrel in today’s purchasing power, while in 2008 the oil price peaked at 147 USD a barrel on the back of strongly rising demand from emerging economies and of speculative money. Straight afterwards, the global financial crisis cut demand and the oil price slid to only about 30–35 USD a barrel at the end of 2008.
The decisions of OPEC and OPEC+
OPEC is the Organization of the Petroleum Exporting Countries, founded in 1960 to coordinate the oil policy of its member states, which includes regulating supply. The number of OPEC members changes over time; as of 2025 the group has 12: Algeria, the Republic of the Congo, Equatorial Guinea, Gabon, Iran, Iraq, Kuwait, Libya, Nigeria, Saudi Arabia, the United Arab Emirates and Venezuela; Qatar left OPEC in 2019, Ecuador in 2020 and Angola in 2024.
OPEC accounts for about a third of world crude oil output. That influence showed clearly in the oil crisis of 1973, when the Arab countries in OPEC placed an oil embargo on a number of states and the price of crude rose almost fourfold.
From late 2016, OPEC coordinated with several large producers outside the group, Russia among them, to form OPEC+. The group has adjusted output many times: in December 2018 it agreed to cut a total of 1.2 million barrels a day (with Russia committing to a cut of about 228,000 barrels a day), in April 2020 it made a record cut of about 9.7 million barrels a day as the pandemic collapsed demand, and from 2025 some members began raising output gradually to unwind the voluntary cuts made earlier. OPEC+ meetings are always events the oil market follows closely.
Oil producers outside OPEC
Outside OPEC, the large oil-producing countries are the United States, Russia, Canada, China and Brazil. The United States has been the largest crude oil producer in the world since 2018, and US crude output first passed 13 million barrels a day at the end of 2023.
How does the oil price affect the forex market?
- The currencies of oil exporters: a rising oil price usually supports the CAD (Canada) and the NOK (Norway), so the USD/CAD pair tends to fall when the oil price rises, although the relationship is not fixed.
- Inflation and interest rates: a rising oil price pushes up the cost of energy and of transport, which raises inflation and through that affects expectations for central bank interest rates.
- The USD: oil is quoted in USD, so a stronger USD usually puts pressure on the oil price and the other way round, although that is not always the case.
If you trade oil through CFDs, bear in mind that the oil price moves very violently around inventory reports, OPEC+ meetings and geopolitical news, that there can be a gap at the start of the week, that the spread widens and that there is an overnight swap. Always place a stop loss, use a small position size (risking about 1–2% of the account per trade) and practice on a demo account first. Note that trading forex and commodities through a foreign broker is not currently recognized or protected by the law in Vietnam. Read more: Is Forex trading legal in Vietnam?, “11 factors that move the world gold price”