On this page
A trading journal is one of the simplest but most useful habits a trader can build. It lets you record every trade: what the market conditions were at the time, what you planned, how you felt, and how it finally turned out. That is how you come to see the mistakes that keep repeating and where your strengths lie, and how you get real data for improving your method instead of relying on a feeling.
What is a trading journal?
A trading journal is where you write down the positions you have taken along with the information that goes with them. There is no need for anything long or lofty; what matters is writing it regularly and covering enough of the necessary details that you can look back at it later and learn from it.
You can keep the journal in a notebook, in an Excel file or in Google Sheets, or with statistics tools that connect to your trading account. The form matters far less than keeping it up regularly.
The benefits of keeping a trading journal
- You notice the mistakes that keep repeating: you may find, for instance, that most of your losing trades come from entering just before a big piece of news, or from moving your stop loss further away when price goes against you.
- You measure how well your method works in numbers: the win rate, the average profit and the average loss, the maximum drawdown, and so on, instead of a feeling that “I have been trading well lately” or “I have been unlucky lately”.
- You find the conditions that suit you: which currency pairs, which hours of the day, which kinds of signal give you better results.
- You control your emotions: having to write down your reason for entering makes you think harder before you press the button, which cuts down on impulsive trades.
- You become more disciplined: you can see plainly the times you followed the plan and the times you did not.
There is one important distinction to make: a losing trade is not necessarily a wrong decision. If you followed the plan and still lost, that is the ordinary risk of the market. But if you entered outside the plan, did not set a stop loss, or raised your position size out of frustration, then even if that trade made money it is still a mistake to be written down and put right. Every time you break a rule, you need to draw at least one specific lesson from it, rather than merely treating it as “the cost of tuition”.
What should you record in a trading journal?
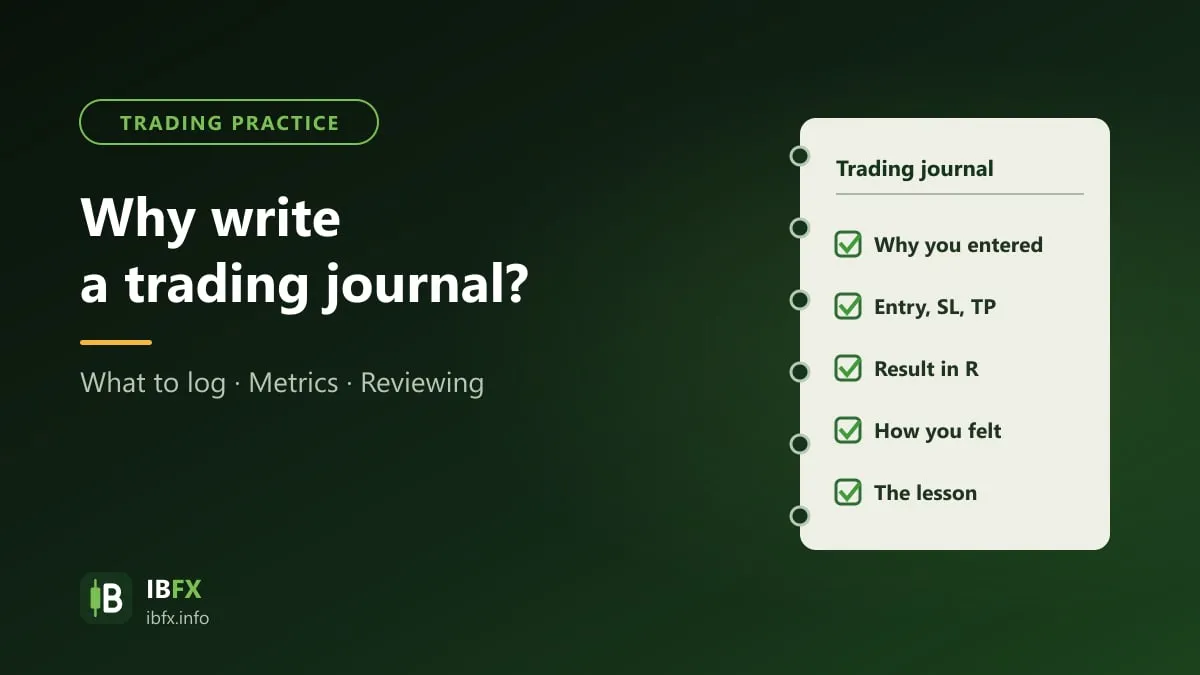
Everyone has their own way of recording, but a useful journal usually has these entries:
- The date and time you entered and closed, the currency pair, the timeframe.
- Whether it was a buy or a sell, the entry price, the stop loss, the take profit, the position size, the amount at risk (what percentage of the account).
- The reason for entering: which signal, which strategy it belongs to, the context of the trend, and the important support and resistance zones.
- The economic news worth watching that day on the economic calendar.
- The result: the profit or loss in money and in R (a multiple of the amount you risked at the start).
- How you felt before, during and after the trade; whether or not you followed the plan.
- The lesson you drew from it.
Take a screenshot of the chart when you enter and when you close, marking the entry point, the stop loss, the take profit and the trend lines on the chart. The pictures help you judge afterwards whether you entered early or late, whether you missed any signal, whether you were impatient getting in, and whether the timeframe you used was the right one. If you are new, you should not trade on a timeframe that is too short. See the IBFX guide on what a trendline is.
The figures worth calculating from your journal
After a few dozen trades, add up the following numbers:
- The total number of trades, the number of winners, the number of losers and the win rate.
- The average profit on a winning trade and the average loss on a losing trade.
- Expectancy per trade = (win rate × average profit) − (loss rate × average loss). For example, with a win rate of 45%, an average profit of 2R and an average loss of 1R, expectancy = 0.45 × 2 − 0.55 × 1 = 0.35R per trade (before costs). A negative expectancy means that the method, or the way you are carrying it out, has a problem.
- Maximum drawdown: the deepest fall of the account, in percent, from its peak.
- Net profit or loss as a percentage of the account.
Bear in mind that while the number of trades is still too small the figures do not mean much statistically; and past results are no assurance of future ones either.
How to review your journal properly
- At the end of each trading day: finish writing up the trades and your emotions while you still remember them clearly.
- At the end of the week: read back through all the week’s trades, look for the mistakes that keep repeating, and at the same time work through your general view of the market for the week ahead.
- At the end of the month: total up the figures, see what your strengths and weaknesses are, and set one or two specific things to improve next month.
How does a scalper keep a journal?
For a scalping trader taking positions in and out many times a day, writing everything down in detail while trading can be a distraction and cost you opportunities. A simpler approach is to export the trade history from MT4 or MT5 to a file at the end of the day, then add a brief note on the reason for entering, whether the plan was followed, and the emotions, for each group of trades.
Writing a trading journal is easy; turning it into a habit is very hard. Start simply and keep it up regularly, because nobody can do more for your progress than you can.