On this page
Most of us met 2 ways of analyzing the market when we started trading forex: fundamental analysis and technical analysis. Each of them comes with a great many different tools, but broadly speaking, fundamental analysis explains the cause of the moves in the market, while technical analysis looks for when the move happens and how large it is.
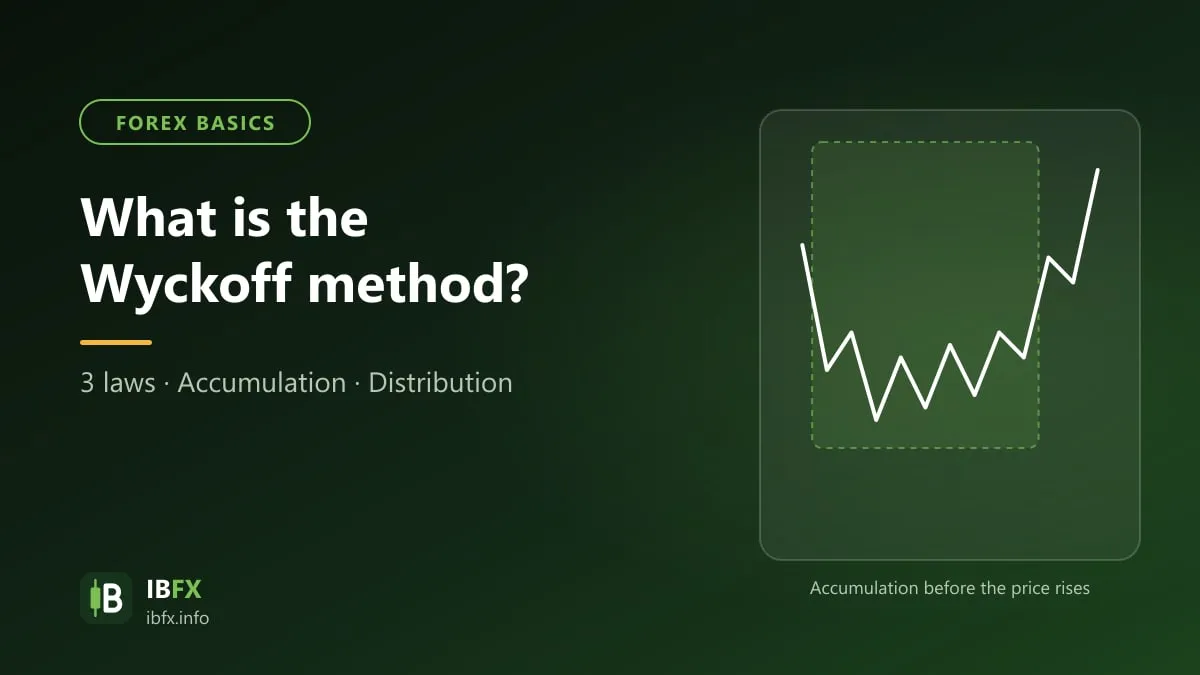
Besides those 2 familiar methods there is one more way of approaching the market: the Wyckoff method. This method is not simply a technical indicator; it also takes in a number of principles, theories and trading techniques that let an investor make a more reasoned decision instead of acting on feeling. The Wyckoff method concentrates on the relationship between price, volume and time in order to read the supply and demand behavior of the large investors.
In this article we will concentrate on explaining what the Wyckoff method is, along with its principles, its laws and the way it analyzes the market.
A little about the man behind the Wyckoff method
Wyckoff’s full name was Richard Demille Wyckoff (Nov 2, 1873 – Mar 7, 1934). At the age of 15 he began his career in the financial markets as an order clerk for a brokerage house in New York. After more than 10 years of work and accumulated experience he opened a brokerage house of his own, and from then on he also grew curious about the logic behind what the market was doing.
Through conversations, interviews and study of the successful traders of his own day, among them Jesse Livermore, E. H. Harriman, James R. Keene, Otto Kahn and J.P. Morgan, he developed the Wyckoff method by systematizing the best trading methods of these “monuments”, together with his own experience and his own way of trading, into laws, principles, trading techniques, money management and mental discipline.
He applied his method to the financial markets, to stocks in particular, and grew his wealth into a very large estate, including more than 9 acres of land and a mansion in New York. (According to Wikipedia.) Once his own trading method had made him wealthier, he took up a passion for teaching and publishing.
Wyckoff founded and, for close to 20 years, edited The Magazine of Wall Street (not the Wall Street Journal), a publication that at one point reached 200,000 subscribers. In 1931 he founded a training school, which later became the Wyckoff Stock Market Institute. The school ran courses on the theory and the practical approach of the Wyckoff trading method, covering the selection of promising stocks, how to enter a Buy or a Sell, the analysis of the phases of a price move and so on. Those courses were later carried on by people who took up the method, such as Robert Evans and Hank Pruden.
Although the Wyckoff method was first applied to stocks, today it is still used on other kinds of financial market, such as currencies, commodities, bonds and online financial markets like forex or crypto. The Wyckoff method was for a time part of the graduate program at Golden Gate University in San Francisco, USA, and it is still studied and applied by many investors.
One point to keep in mind when applying it to forex: the Wyckoff method leans very heavily on trading volume and on comparing a stock with the general market index. Forex has no central exchange, so there is no common trading volume (the volume on MT4 is only the tick volume of the broker), and there is no equivalent “market index” either, so signals based on volume are only a rough guide.
What is the Wyckoff method?
The Wyckoff method is a set of laws, principles and trading techniques designed to help a trader judge the market as a whole, find stocks with profit potential and set a trading target.
On the ground the Wyckoff method laid, a great many models and trading methods have appeared, among them 2 very well known ones in common use in the market: the Spring and Upthrust model and the VSA method (Volume Spread Analysis). In this article, though, we are not going deeply into those 2 methods; we mainly introduce the core parts of the Wyckoff method, so that you get a first clearer picture of this rather particular school of analysis.
In what follows we will set out the core parts of the Wyckoff method one by one, that is, the laws, the principles and the trading techniques:
- The 3 basic laws of the Wyckoff method
- The Wyckoff Price Cycle
- The Wyckoff schematics
- The idea of the “Composite man”
- The 5-step approach to the market
The 3 laws of the Wyckoff method
Wyckoff’s methodology rests on 3 laws that bear on every side of analyzing and judging the market: working out the current and the future trend of each promising stock and of the market as a whole, picking the best stock to trade, marking out the trading range, and projecting a profit target along the trend from the way price behaves inside a given range.
The law of supply and demand
The law of supply and demand sets the direction of price. This is the central principle of the Wyckoff method. When demand is greater than supply, price rises; the other way round, when supply is greater than demand, price falls. You can picture this law simply: when buying pressure (buyers willing to pay a higher price) is greater than selling pressure, price goes up; the other way round, when selling pressure (sellers willing to sell cheaper) is greater, price goes down. In the market every trade has a buyer and a seller, so what decides the outcome is which side is the more active, not the number of people.
This is also the general and most basic law of the financial markets, not something that belongs to the Wyckoff method alone.
Working from this law, an investor can study the balance between supply and demand by comparing price levels with the matching trading volume. Simple and easy to follow as the law is, judging the supply and demand balance accurately on a chart and understanding what it does to the market is hard, and it takes a great deal of time to study and practice.
The law of cause and effect
This law helps set a price target by judging how much potential a particular trend has. To describe it, Wyckoff used the Point and Figure chart, in which the cause is measured by the number of points moving sideways on the chart (the accumulation or distribution phase) and the effect is the distance price travels to match that number of points (once it has left the accumulation or distribution phase). This is set out more fully further on.
For Wyckoff, the longer the sideways phase (accumulation or distribution), the larger the potential move in price once it leaves. This is a way of estimating a price target, not something certain to happen.
The law of effort and result
The law of effort and result gives a warning that a trend may change in the near future. A difference between price and trading volume is one of the important signals that a trend may stop or turn.
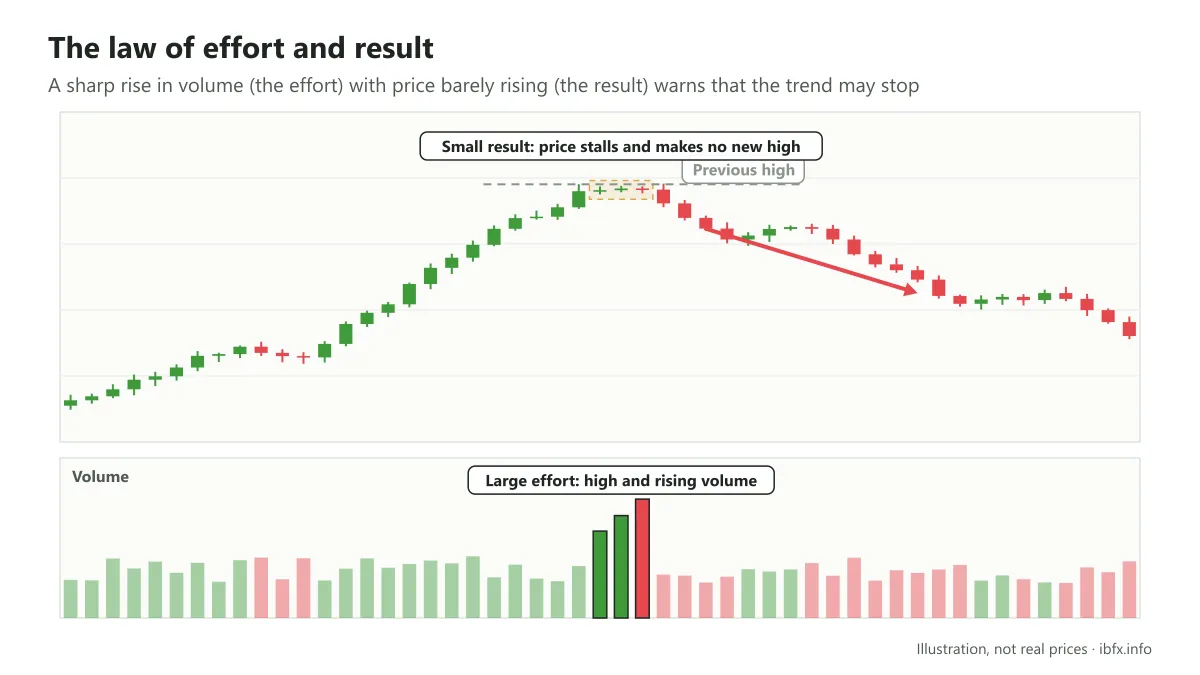
3 trading sessions in a row with large and rising volume (a large effort) appear after a strong rise in price, yet price rises with a very small range and does not clear the high before it. The result was that price turned straight after.
The Wyckoff Price Cycle
For Wyckoff, an investor can understand and estimate where the market is going through a detailed analysis of supply and demand, worked out by studying price action, volume and time. He described a diagram of the phases that run through a price cycle, and from it the reasonable moments to enter. On that reading, the moment to enter a Buy is at the end of the preparation for a rise in price (the end of the accumulation phase), and to enter a Sell at the end of the preparation for a fall in price (the end of a distribution phase).
The 4 phases of the price cycle, or of the price move
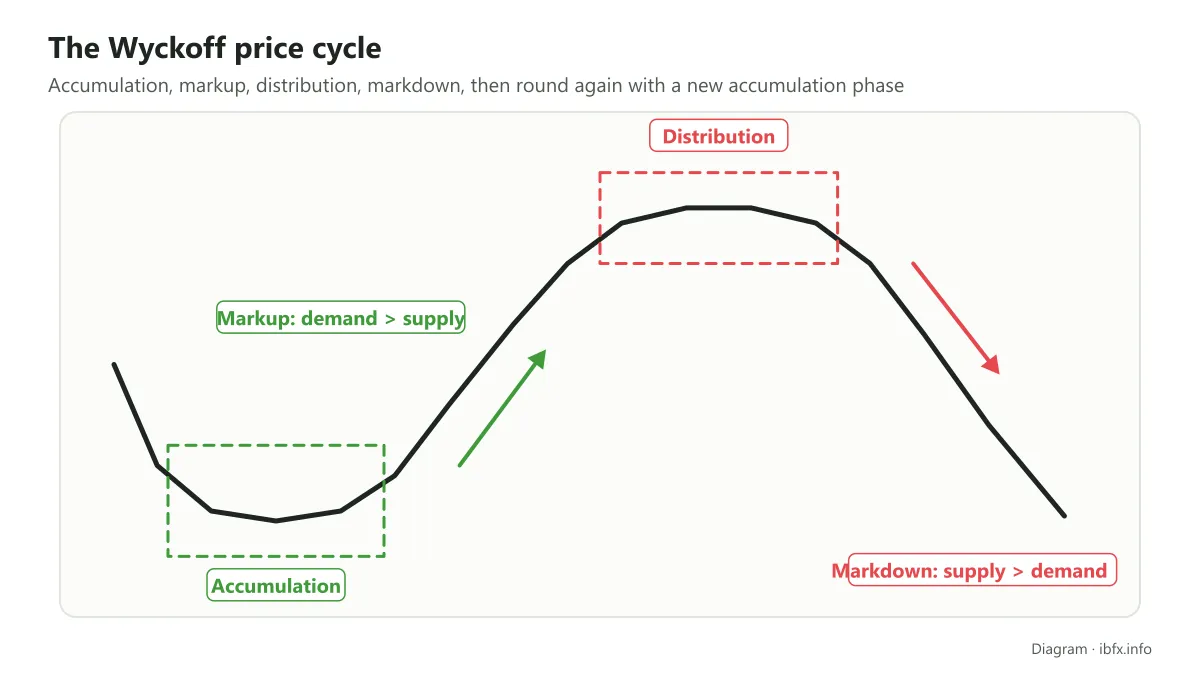
The accumulation phase
This is the phase in which the “big players” in the market start to accumulate assets. A large amount of money from these forces goes into the market skillfully and slowly, so that price does not move too much. During accumulation the market tends to move sideways.
The markup phase
When the market breaks out of accumulation, the markup phase begins. Having taken hold of a large enough amount of stock, and with selling weakened, the buy side quickly pushes price up and a new trend forms.
The markup phase pushes the people sitting outside the market into buying stock, so demand becomes greater than supply and the market drives price higher still.
Even so, price does not go up the whole time in this markup phase; the market will have short accumulation stretches (re-accumulation, a pause) or small setbacks (pullbacks), where price moves sideways or drops for a short while before the markup phase carries on.
The distribution phase
Once the appetite to buy stock has been satisfied, the investors sitting on a large profit start to distribute their holdings to the latecomers by selling stock to take that profit. This phase too is handled skillfully by the “big players” so that price does not fall quickly, and at this point the market again shows as a sideways trend.
The markdown phase
The “big players” start selling more stock, driving the market down, and this pushes other investors to sell stock as well, so supply becomes greater than demand and price falls.
Compared with the accumulation and the markup phase, the markdown phase usually runs faster and harder, because in this phase investors tend to want to sell the asset quickly to get out of their position.
As with the markup phase, the market does not go down the whole time during markdown; there will be short stretches where the market redistributes or rallies (also called a temporary recovery) before the downtrend carries on.
When the markdown phase ends, the market carries on the cycle with a new accumulation phase.
The Wyckoff schematics for the 2 important phases of the price cycle: accumulation and distribution
One of the largest aims of the Wyckoff method is to find a reasonable entry with the best risk:reward ratio. Wyckoff defined the Trading range (TR) as the place where a trend before it (up or down) was stopped and the market holds a relative balance between supply and demand. Inside the trading range the “large forces” in the market prepare their strategy for a rise or a fall in price, in the accumulation and distribution phases. In the TR of either an accumulation or a distribution phase, buying and selling are both very active; in accumulation, though, more stock is bought than sold, and in distribution more stock is sold than bought. How far accumulation or distribution has gone sets how hard price breaks out of the TR zone.
A trader using the Wyckoff method succeeds when they read the direction and the force of price leaving the TR zone correctly. The Wyckoff method gives guidance so that a trader can read the events and the price behavior in each accumulation and distribution phase, and from there set a price target for the trend that follows. To make that possible, the Wyckoff method splits the accumulation and the distribution phase into a number of smaller phases, and describes the events and the behavior of price in each of those smaller phases.
The Wyckoff schematic for the accumulation phase
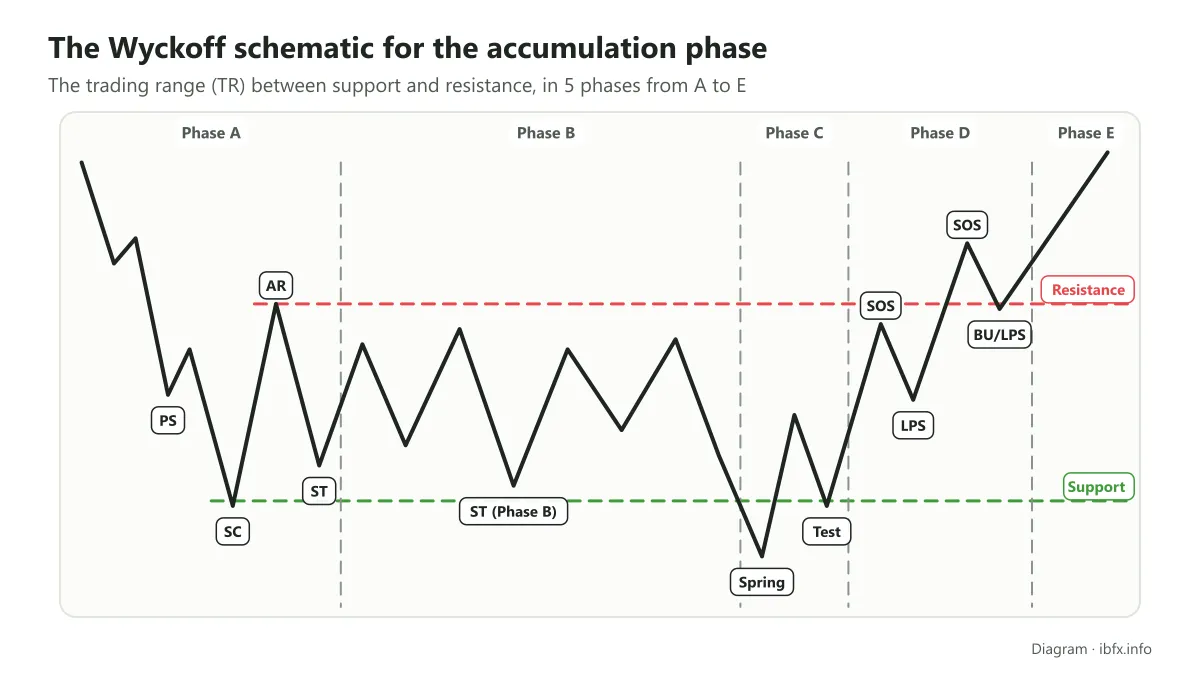
The events that take place in the accumulation phase
- PS (preliminary support): shows a noticeable amount of buying appearing after a long fall in price, a sign that the downtrend may be coming to an end. The buying is not enough, though, to stop price going lower.
- SC (Selling Climax): this is the moment when selling pressure is pushed to its peak, with very large volume and a very wide price range as small investors panic and sell out. The closing price is usually well above the low of the session, which reflects the heavy buying of the large forces absorbing that panic selling.
- AR (Automatic Rally): selling pressure has dropped a great deal and fresh buying has pushed price up. The high of this rally is the upper edge of the trading range TR in the accumulation phase. The lower edge is the SC.
- ST (Secondary Test): this is where the market tests whether the downtrend has really finished. When a low forms, that is, when price comes back to the support area of the SC and then moves up, trading volume and the price spread drop noticeably. There can be one, two or more STs after an SC.
- Spring (the shakeout): price breaks below the low of the TR (the SC support area) and then comes back quickly inside the TR. This is usually a trap set by the large forces to mislead investors into believing the market will fall and into selling their stock, which lets those big players buy in at a very low price before the market rises again. In the accumulation phase a Spring is not compulsory; it may not happen, if the SC support area holds strongly.
- Test: the large forces usually test supply right through the TR or at the important places in the markup phase. If supply rises noticeably on the test, it shows the market is not ready for an uptrend. On a successful test, price makes a higher low and trading volume drops.
- LPS (Last Point of Support): the low of a pullback, usually on low volume, appearing after price has already shown strength. Price does not come back down to the old support area, which shows supply has dried up and the market is ready to go up. In the accumulation schematic there can be more than one LPS.
- SOS (Sign of Strength): a rise in price with a noticeably wider range and higher volume, taking price up near or past the upper edge of the TR. An SOS usually appears after a successful Spring or Test, confirming the behavior of price before it.
- BU (Back-up): a term coined by Robert Evans, a leading teacher of the Wyckoff method from the 1930s to the 1960s. A BU is the move where price comes back to test the old resistance area (now support) after price has broken above the TR, usually on low volume; it can be a short pullback or a small TR at a higher level.
The 5 smaller phases in the accumulation schematic
Phase A: marks the slowing of the downtrend before it. Here supply still has the upper hand over demand. Supply is weakening, though, and the appearance of the PS and the SC shows it.
Phase B: this is the phase that builds the “cause” in the law of cause and effect of the Wyckoff method. In this phase the large forces in the market start accumulating stock at a low price in order to get ahead of a new uptrend. The accumulation can go on for quite a long time.
Phase C: this phase runs a test of a deciding kind (a Spring or a Test), which helps an investor judge whether the stock is ready to rise. In the Wyckoff method a successful spring (price comes back quickly into the TR and the test after it is on low volume) is taken as a trading opportunity with a good risk:reward ratio, with the stop loss just below the low of the spring. Even so, a spring can still fail and price can carry on down.
Phase D: demand has the upper hand, price rises gradually to the upper edge of the TR zone with SOS signs, and usually breaks resistance at the end of this phase. After the SOS moves there are usually LPS or BU pullbacks on low volume, and those are the points many traders following Wyckoff use to add another Buy.
Phase E: this is the phase where price has left the TR in the clearest way and demand is higher than supply. New TRs at higher levels can happen at any point in this phase, though usually for a shorter time (this is the re-accumulation mentioned earlier), and those new TRs are taken as a step up for price to rise higher.
The Wyckoff schematic for the distribution phase
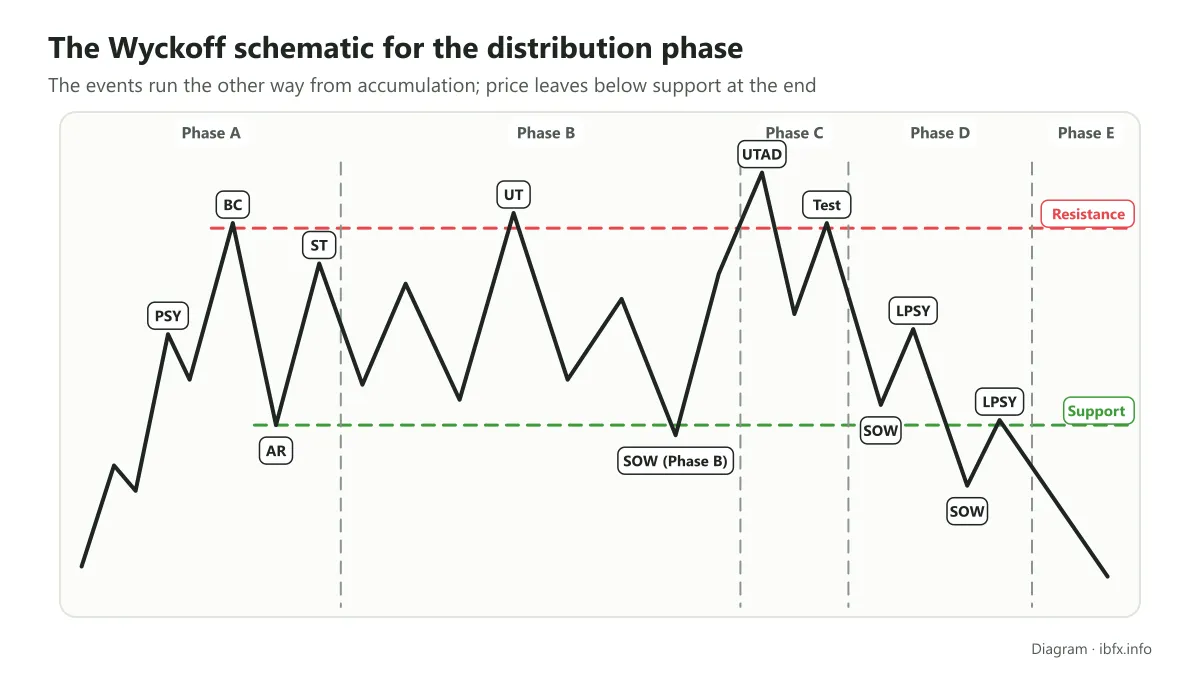
The TR in the distribution phase is also split into 5 phases, and the events in those 5 phases tend to run the other way from the accumulation phase. You can work through it in reverse against the Wyckoff accumulation schematic above.
The idea of the “Composite man”
In the parts above we have said “big players” or “large forces” a great many times, and those are other ways of naming the composite man in the market. This is also the founding idea of the Wyckoff method.
In practice, the composite man is the set of entities with a large influence on the market, such as banks, investment companies, credit institutions and other financial institutions. For Wyckoff, every move in the market and every move in an individual stock is the result of the composite man at work. They try to manipulate the market and do everything they can to buy stock cheaply and sell it dear. Wyckoff’s idea is that a small investor should try to understand the “composite man” and move along with him rather than against him; even so, recognizing what they are doing on the chart is very hard and does not assure a profit.
Through study and regular practice, an investor can come to understand the motive of the composite man through the behavior of price shown on the chart. Do that, and an investor can spot a chance to buy or sell earlier, though nothing assures that their reading of the chart is right.
The 5-step approach to the market
The Wyckoff method sets out a 5-step process for approaching the market, picking a promising stock and entering a trade.
Step 1: Work out the trend
Working out the trend takes in reading the current trend and projecting where price is going next, through an analysis of market structure and of the supply and demand relationship. A view on the trend ahead will help you decide whether to take part in the market at all, and on which side, buy or sell.
Step 2: Pick a stock that goes with the trend
In an uptrend, pick the stocks that rise relative to the market, or in other words relative to the market index. Those are the stocks with a higher percentage gain when the market recovers and a lower percentage fall, or even a gain, when the market corrects.
Step 3: Pick a stock whose “Cause” is at least equal to your price target
Wyckoff’s method sets a price target from the length of the accumulation or distribution phase (the stretch where the market moves sideways). In the law of cause and effect, the number of P&F points (on the Point & Figure chart) moving sideways inside the trading range stands for the “cause”, and the size of the price move that follows is the “effect”, for a short-term trade as much as for a long-term one. So, if you are a long-term investor, you should pick the stocks in an accumulation or re-accumulation phase that has gone on long enough to meet your price target.
Step 4: Judge whether price is ready to move
This step concentrates on judging whether price is ready to break the trading range TR, to rise after an accumulation stretch or to fall after a distribution stretch. To read how likely price is to move, Wyckoff put forward 9 buying and selling tests (the signals). These tests are specific rules that help work out when a TR is about to end and a new trend (up or down) is about to begin. The 9 tests have to do with price completing the events in the accumulation or distribution schematic set out above, namely:
The 9 buying tests in the accumulation phase: (the conditions and the charts used)
- The downside price target has been met, P&F Chart.
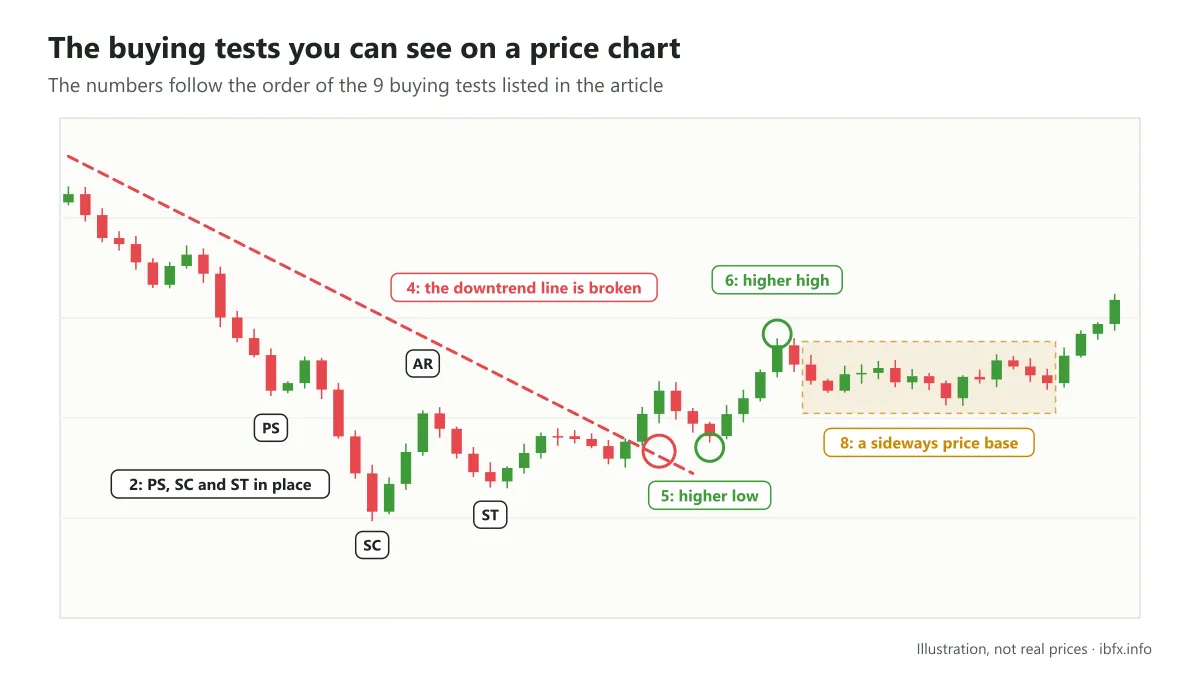
- PS, SC and ST have formed, Bar and P&F Chart.
- Bullish activity appears: trading volume rises on the recovery and falls on the correction, Bar Chart.
- The downtrend line is broken, Bar or P&F Chart.
- Price makes a higher low, Bar and/or P&F Chart.
- Price makes a higher high, Bar and/or P&F Chart.
- The stock is stronger than the market (a larger gain on the recovery and a better reaction than the market index), Bar Chart.
- A base has formed (the price line runs flat), meaning accumulation has lasted long enough to produce a breakout later, Bar and/or P&F Chart.
- Estimated potential profit is 3 times the stop loss, Bar and P&F Chart.
The figure below shows the tests you can read straight off the price chart (numbers 2, 4, 5, 6 and 8 in the list above); the rest need the P&F Chart, trading volume or a comparison with the market index:
The 9 selling tests in the distribution phase are run the other way round.
Step 5: Work out when to enter the market
Wyckoff held that most stocks move in the same direction as the market as a whole, so a good moment to enter is when the signal on the stock lines up with a turn in the market index. That way your trade has the added support of the general trend. Beyond that, the specific rules in the Wyckoff tests, together with the way price behaves inside the trading range TR, will help an investor work out a reasonable entry, stop loss and take profit.
Conclusion
Simple as the laws and principles of the Wyckoff method are, approaching them effectively in the market is extremely hard. Within this article we have only set out the basic parts that make up the Wyckoff method, in the hope that you come away understanding its nature and its ground, and from there apply them in your own process of analyzing the market and picking promising stocks. One method developed out of Wyckoff that you can go on to read about is VSA (Volume Spread Analysis). When you apply it to forex, remember the limit on volume data noted above, and always place a stop loss.