On this page
Before you study technical analysis in depth, you need to be clear about the difference between technical analysis and fundamental analysis, the 2 basic schools in financial trading generally, and in stock or forex trading in particular.
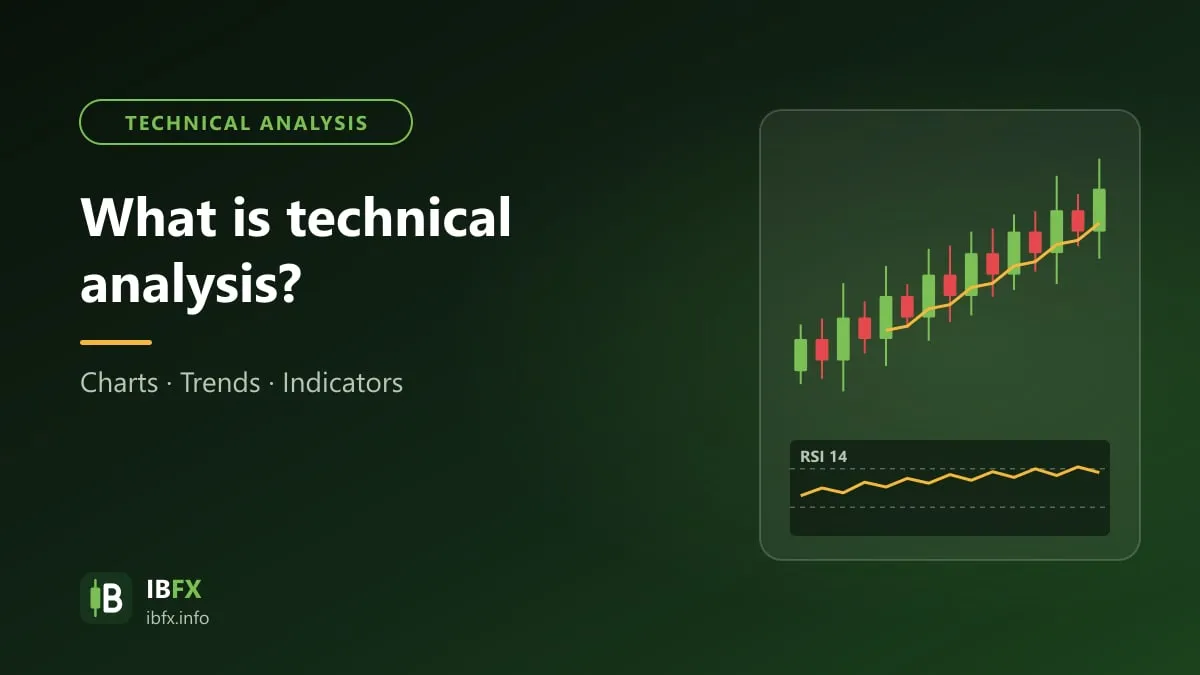
Just as the name says, technical analysis is a method of judging the trend and finding the points at which to enter and exit an order, based on past price and volume data shown on the chart, together with tools such as trendlines, candlestick patterns, price patterns and technical indicators.
Fundamental analysis, on the other hand, uses economic information, news, reports and policy to assess the value of an asset and the direction it is heading in.
That is the basic difference between the 2 schools of analysis in the financial market. Let’s look more closely at what technical analysis is and why we should use it.
The concept
Technical analysis is very widespread among traders. The method rests on charts and graphs of the price movement and the trading volume of a given product in order to analyze shifts in supply and demand and arrive at trading decisions, which helps an investor find a sensible moment to buy or to sell.
Unlike fundamental analysis, which calls for fairly broad economic knowledge, technical analysis concentrates on the chart, which is why so many short-term and medium-term traders use it; even so, it is used for long-term decisions as well.
The 3 founding assumptions of technical analysis
- Price discounts everything: all known information is expressed in the price.
- Price moves in trends: a trend that has formed usually continues until there is a sign of a reversal.
- History tends to repeat itself: crowd psychology repeats, so price patterns repeat as well.
These assumptions come from Dow theory. They are not absolutely true, and that is exactly why technical analysis gives you probability rather than certainty.
Technical analysis is a very popular method in trading.
The steps to prepare when you start trading with technical analysis
If you are a trader meeting technical analysis for the first time, it is worth getting hold of the following steps to make the approach easier:
+ Settle clearly on your style and your strategy when you go into the market.
+ Settle on the product you will trade, which may be gold, oil, forex currency pairs,…
+ Choose a broker you can trust (see how to check a broker) and practice on a demo account first.
+ Work out the trend of the market, the entry point, the stop loss point and the take profit point from your analysis.
+ Work out your position size from the risk you allow yourself, and get your mind ready so that you are not shaken or distracted.
Common technical indicators
One of the things technical analysis cannot do without is the indicator, although there are a great many tools and it is up to us to choose the ones that suit our own analysis so that we trade effectively.
To get there we should settle on what we want the tool for, because each kind of tool has particular functions of its own. The main purpose is to judge the trend and the momentum of the market so as to choose a more sensible moment to buy or to sell.
Common indicators worth mentioning include: Moving Average, Bollinger Bands, RSI, MACD,…
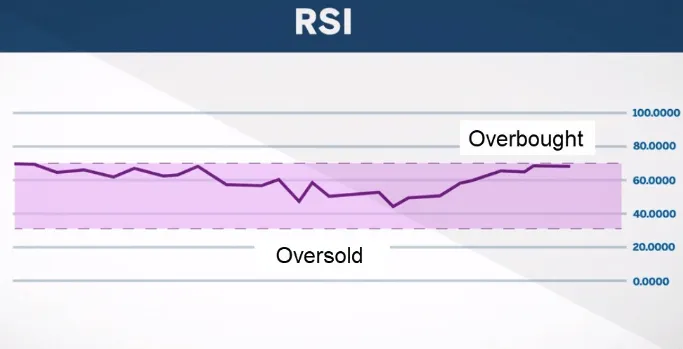
RSI is a very widely used indicator.
How important is technical analysis in trading?
Technical analysis is used very widely in trading. To understand the role of this method, we can look at its 3 main functions.
+ Technical analysis can provide price alert tools that warn you when these safe thresholds are pierced and that set other safe thresholds, most often seen as setting a new high in place of the old one, or a new low in place of the old one.
This can help investors recognize changes in price early, which in turn helps them buy or sell the product they are analyzing in good time.
+ Besides warning early, technical analysis also has a confirming function, and each tool in the technical analysis method is used in combination with other methods of analysis to confirm the direction the product is heading in. This helps investors form a more objective judgment and view, and from there reach a more accurate conclusion in their own trading plan.
+ Technical analysis also helps you build price scenarios for the future (a price target from a pattern, or the next support and resistance zones, for example), and from there plan your trades. However, because the nature of technical analysis is statistics on past prices — put another way, because technical indicators usually come with a certain lag — investors need to allow for probability, since it can be wrong.
Trading is also an occupation of probabilities.
In the forex market, nothing is 100% certain. Whoever you are, however able you are, there will be times when you get it wrong, and technical indicators can be wrong plenty of the time, so taking technical indicators to be always accurate is a thoroughly mistaken idea.
The limitations of technical analysis
- It is subjective: on the same chart, different people may draw and read things differently.
- Many indicators lag and give false signals, especially when the market moves sideways.
- Unexpected news can undo every piece of analysis on the chart in a matter of minutes.
- Past results (a backtest) usually look better than real trading turns out to be.
So technical analysis has to come with risk management: always place a stop loss and cap the amount of money you can lose on each trade.