On this page
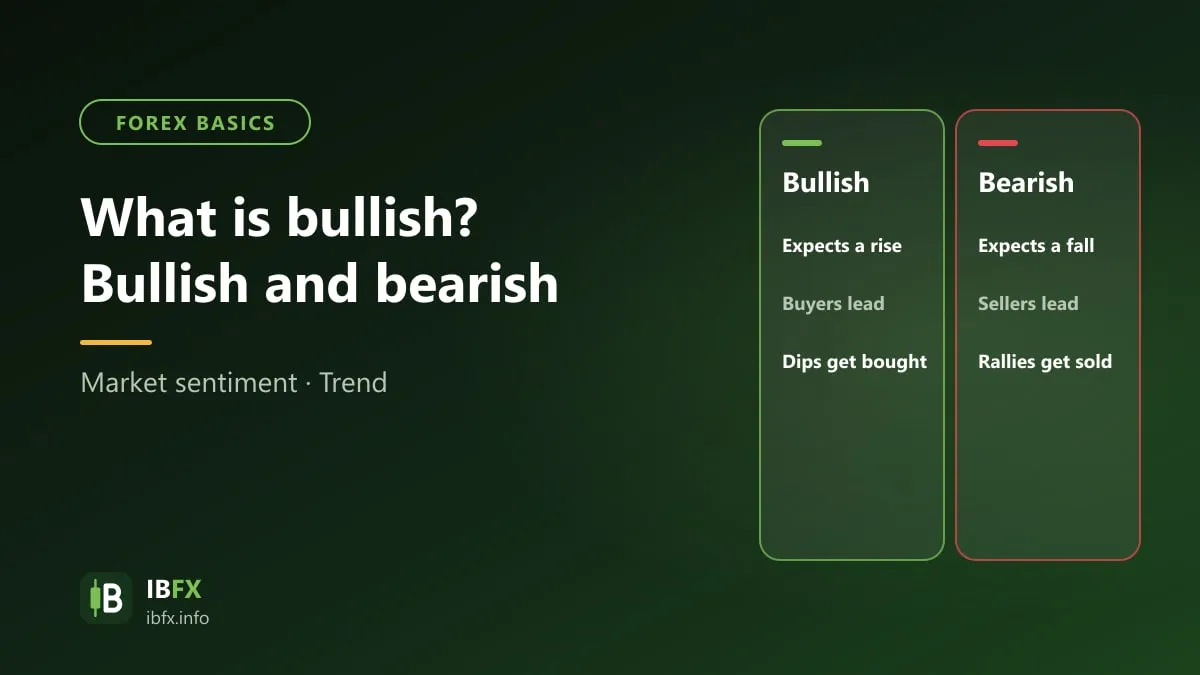
Bullish and bearish are two very basic but very important concepts on financial markets such as stocks, foreign exchange and cryptocurrencies. Both terms describe the trend of a market. Bullish means the market is rising; bearish, the other way round, means the market is falling. Once you have a firm grip on the two concepts of bullish and bearish, you can read the trend far more easily. On top of that, each kind of market has its own features, its own character and its own way of moving, and from those a trader works out which trading strategies fit the market best.
In this article we will look at the concept of bullish first, at the features of a rising market and at the trading strategies used in that market.
What is bullish? What is a bullish market?
Besides describing the overall trend of a whole market, the term bullish is sometimes used for one particular asset (a share, a currency, a commodity and so on) or for one particular industry. What those markets, assets or industries have in common is that they are heading up in price, in value or in growth.
A bullish market is a rising market, one in which the prices of assets are rising faster than their historical average, over a long stretch of time and with heavy trading volume.
The term “bullish” is used for a rising market because this market behaves rather like the way a bull attacks: it uses its horns to drive into its opponent from below. The other way round, the term “bearish” describes a falling market because that resembles the way a bear attacks, landing very heavy blows from above.
In a bullish market people expect price to rise, so buyers are willing to pay more and sellers only agree to sell at a higher price, and the result is that the price of the asset is pushed up.
Although the nature of bullish is always a rise in price, the concept shows itself in many different ways for different assets and on different time frames.
Bullish in the short term
A rising market in the short term means that right now price is rising and investors expect it to rise further over short stretches of time, from a few minutes or a few hours to a few days. A rising market in the short term cannot be taken in a hurry to be a rising leg inside a general long-term uptrend; it may just as well be a rally inside a long-term downtrend, or inside a long-term bearish market.
What investors base their expectation of a short-term bullish move on is usually the technical side, through chart analysis and price action. Sometimes the expectation also comes from some short-term event that moves the price of the asset in a positive direction.
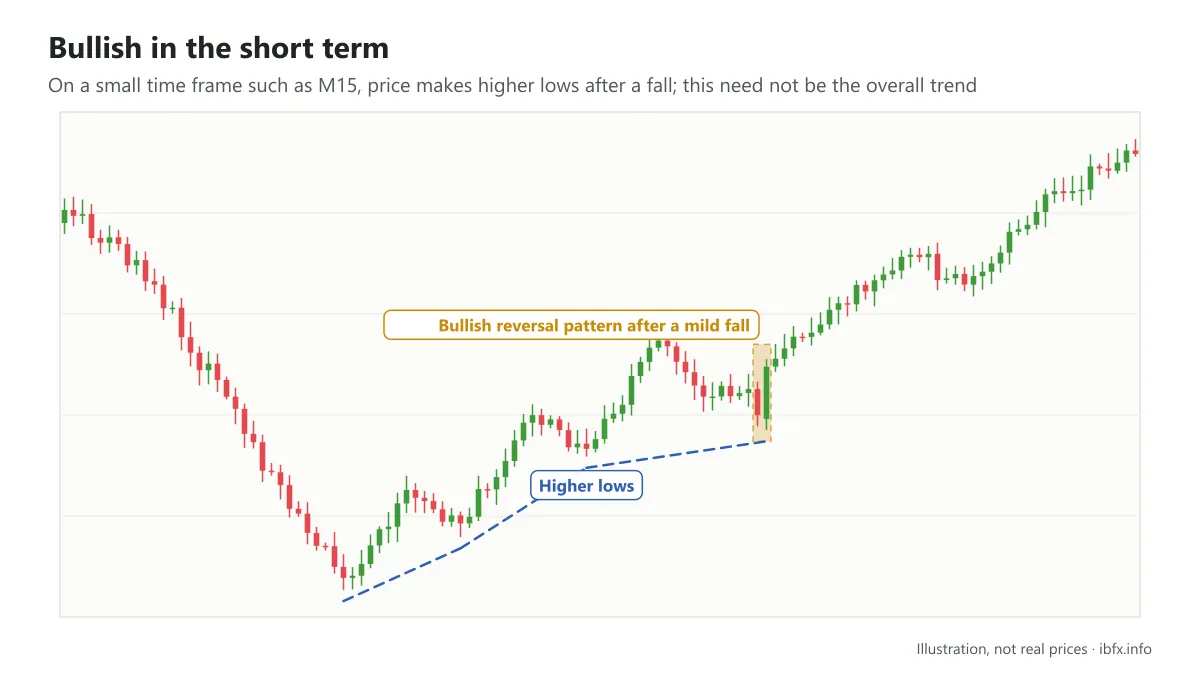
Example: on the short M15 time frame, price is rising right now because it is making higher highs and higher lows, but this need not be the general trend of the market. Even so, a bullish reversal pattern appearing after a mild fall can lead a trader to expect price to rise further.
Bullish in the long term
This is when price rises over a long stretch of time, a few weeks, a few months, a few years, and it is also the general trend of the market. In a long-term bullish market, even though price swings up and down unpredictably, on the whole it still heads up over time. A trader buying with the trend has the advantage, but can still lose money by buying at the top of a rising leg or right before the trend ends.
In a long-term bullish market, investors are highly excited. In the stock market, either investors are extremely optimistic about how the company will perform in the future, or they take the view that the company’s shares are priced well below their intrinsic value. In the forex market, traders have a firm belief in the strengthening of a currency. That belief makes them buy all the more eagerly, and the more they buy the more price rises.
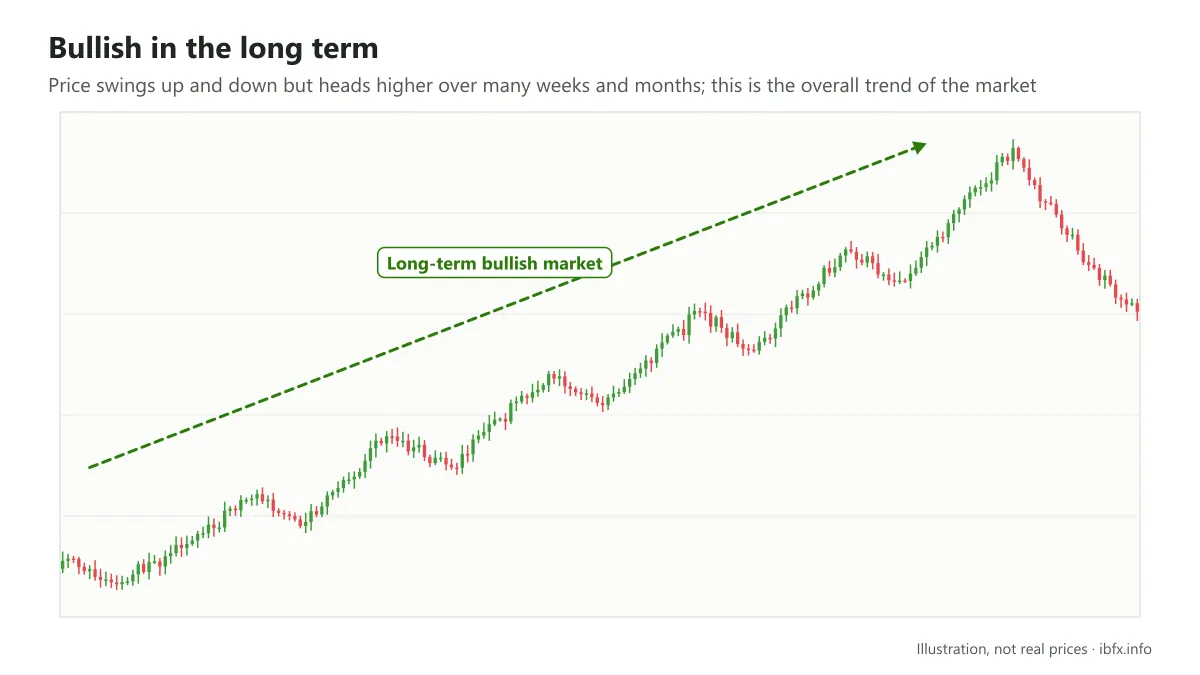
Example: price rises over a very long stretch of time, running for many months before it reverses.
Bullish across a whole industry or a whole market
If in the two parts above we were looking at the concept of bullish in the market for one particular asset, here we will talk about bullish across a whole financial market. And the stock market is the clearest and easiest example to follow.
The stock market holds many different kinds of asset such as shares and bonds, but shares make up almost all of it. Over a year there will be shares that rise and shares that fall, shares that rise a lot, rise a little, fall a lot or fall a little; but if you take the stock market as a whole and over that year the market heads up, then we say that in that year the market is bullish. And the stock index is what stands for the whole stock market.
In the same way, over a year, looking at the food industry, there will be shares that rise as well as shares that fall; but taking the industry as a whole, if it rises then we say that in that year the market for the food industry is bullish. And the movement of the industry stock index stands for the whole industry.
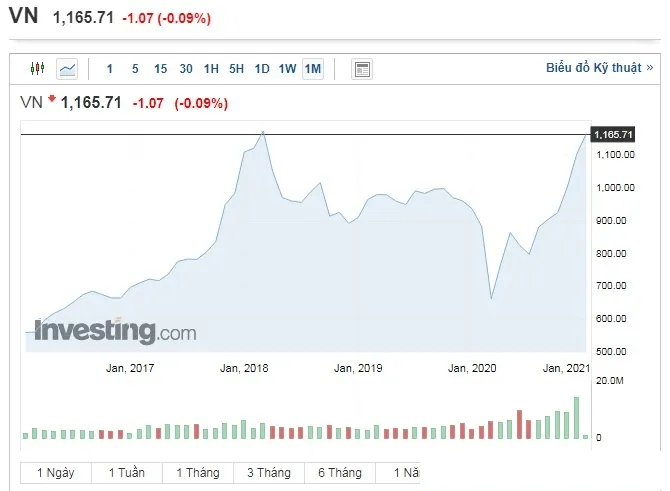
The screenshot shows the Vietnamese interface; the buttons and labels sit in the same places in the English version.
Example: the VN-Index stock index headed up from the start of 2016 to April 2018, so we say the stock market over that stretch was a bullish market, even though the individual shares inside it moved in many different directions.
The features and the signs of a bullish market
A bullish or a bearish market is also the expression of one particular direction of price: up or down. And a trend splits into 3 stages: the start, the climax and the fading.
For a bullish market, the starting stage usually runs over the shortest stretch of time, after a long stretch of accumulation or carrying on from a bearish market. At this stage price does not rise much; it rises and accumulates at the same time. Once it has accumulated enough and buying is strong enough to push price higher, the size of the rise grows and the stage runs longer, and this is the boom, or climax, stage. If this stage has a powerful rise then it usually runs for a short time; the other way round, if it still booms but the rise is moderate, the stage runs longer. Finally, at the fading stage, price starts rising more slowly, the pace of the rise falls away, and at some point stronger selling drags price down and the market reverses.
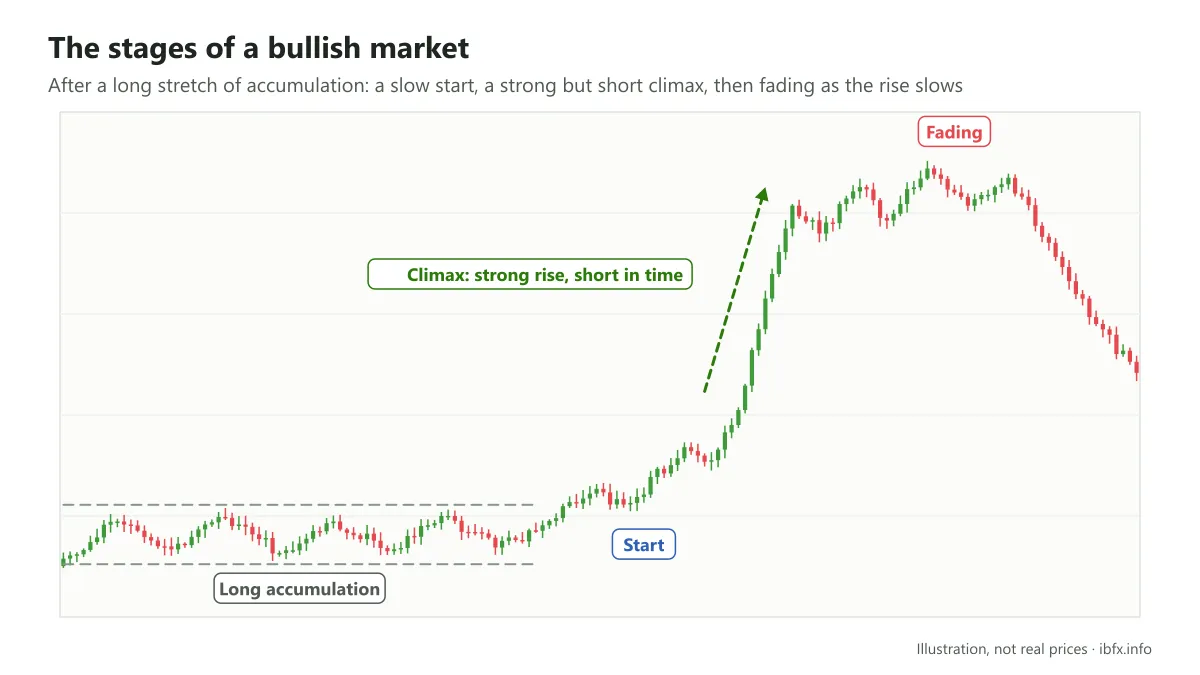
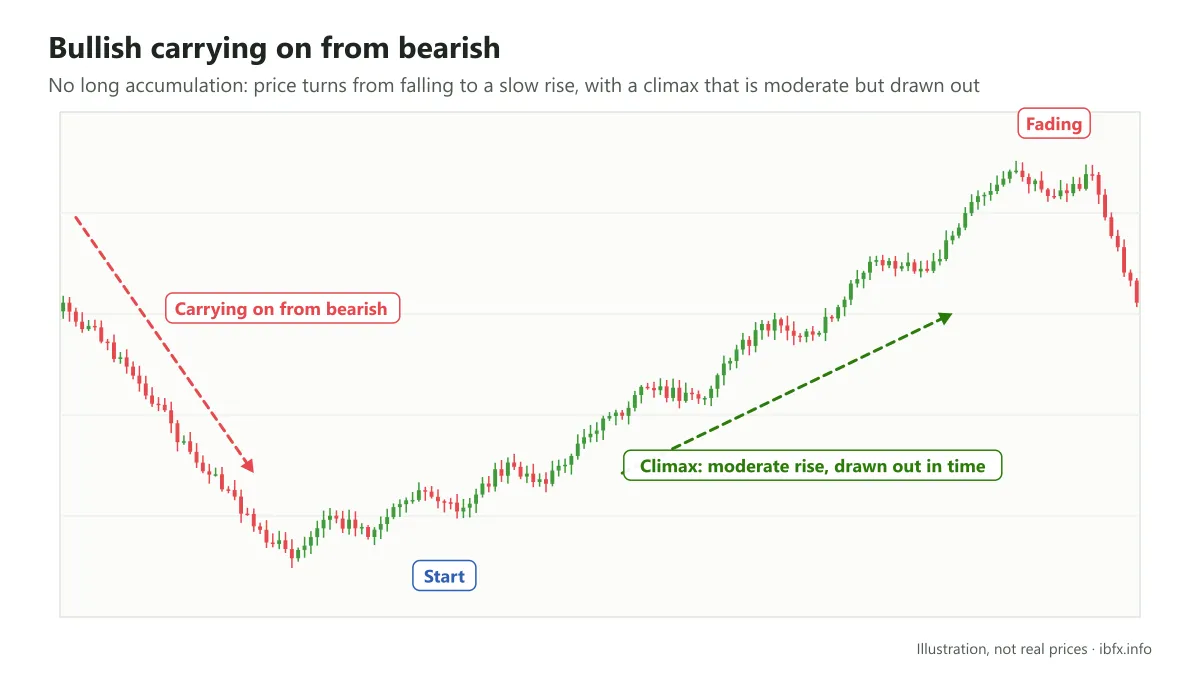
The features of a bullish market
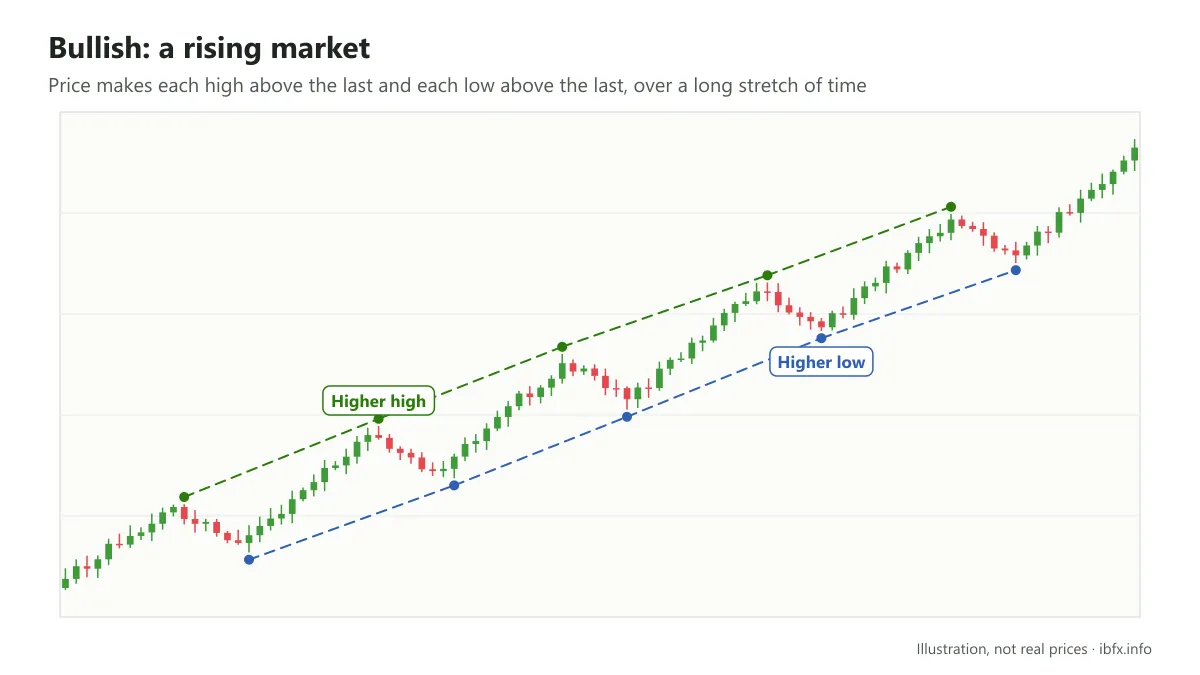
- First, price keeps making higher highs and higher lows
- Second, in between the strong rising legs come pullbacks that are mild and do not break the structure of an uptrend
- Third, the rising legs must have strong momentum and must rise more than the pullbacks just before them fell.
Those three features of a bullish market lean towards the technical side and are marked by the direction price moves in the market. Besides them, a bullish market also shows itself through many other fundamental, internal factors such as supply and demand, investor mood and changes in economic activity.
The signs of a bullish market
- In a bullish market, demand to buy is greater than demand to sell
- In the stock market, investors are readier to join the market in search of a profit, which reflects their optimistic attitude and mood; in the forex market, the other way round, a trader can open trades in both directions, so joining the market does not depend on bullish or bearish. That is the difference, but it also means a trader can lose in both directions.
- With stocks, a bullish market as a whole usually comes with changes in a few economic variables: gross domestic product rising strongly, a falling unemployment rate, more IPO activity in the market. A bullish market for one particular share comes with rising profits at the business.
- The attention of the media also becomes more favorable in a bullish market.
Trading strategies for a bullish market
Trading well in a bullish market means a trader has to take the chances to enter during the strong rising legs. That is the trading-with-the-trend strategy.
First, to build a trading strategy, you need to work out the general trend of the market, that is, whether the market is bullish or bearish.
There are 2 ways to identify a bullish market: using a technical indicator to identify the trend, and reading price action.
The technical indicator that signals a bullish market
There are a great many indicators used to identify the current trend of the market, but the simplest and most common of them has to be the moving average, the MA.
The MA shows the average price of the last N candles. When price stays above the MA for a long stretch and the MA slopes up, it means the current price keeps coming in above the average of the period before it, which is a sign of a rising, bullish market. The MA is a lagging indicator: it only confirms a trend after price has already run some way.
Depending on the style you trade in, you will use short-term or long-term strategies, which means short or long timeframes, and the period of the moving average you pick will differ as well.
Even so, with a trading-with-the-trend strategy in a bullish market, what matters is that you work out the overall trend of the market, so the MA you use has to have a long period, usually 50 or 100 on the D1 time frame. After that, once you have the trend, you can use shorter periods such as 20 or 50 on short time frames such as M30, H1 and H4 to look for an entry signal.
In this article we use the simple moving average, the SMA.
Example: using the SMA (50) on D1 to identify a bullish market
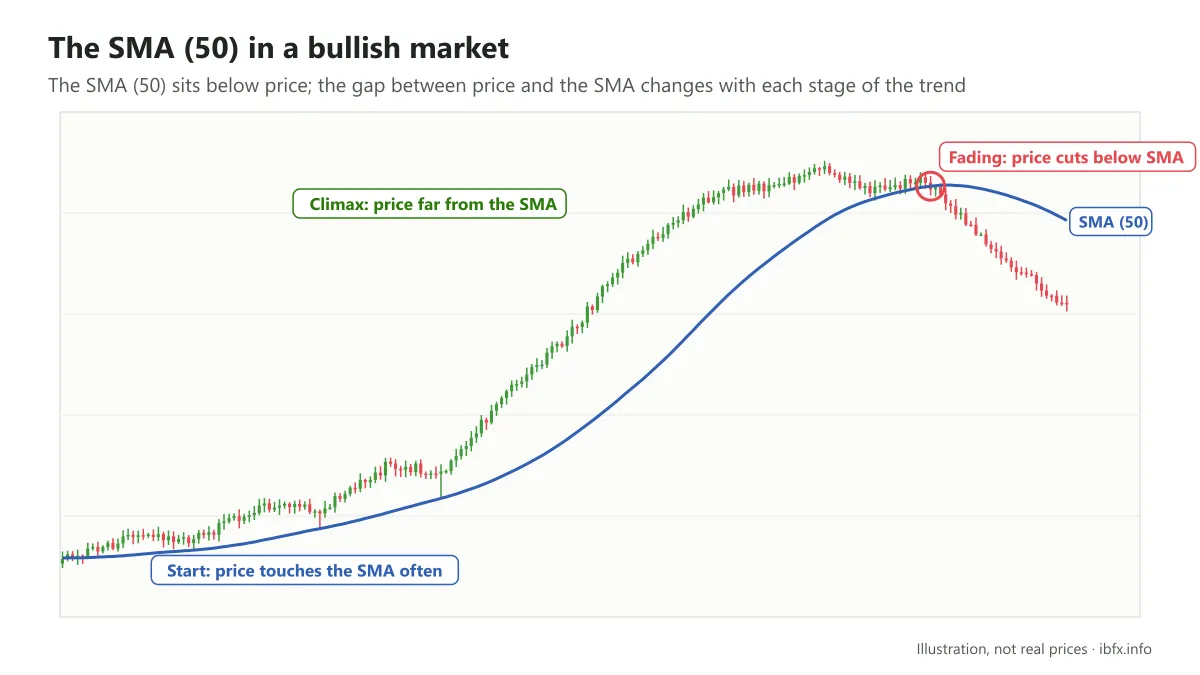
In a bullish market, the SMA (50) usually sits below the price line. At the starting stage, because the rise is not yet large, price touches the SMA (50) many times; moving into the climax stage, the rise is stronger and larger, so price no longer touches the SMA (50) and the gap between the price line and the SMA (50) grows wider as well. Finally, once it has moved into the fading stage, price is still above the SMA (50) but is heading back towards that line until it touches it, cuts it and ends up below it.
Reading price action to identify a bullish market
The price action school uses nothing but the bare price chart as its main tool, which suits a new trader learning to read charts because it is so simple.
By watching how price behaves on the chart, we can identify a bullish or a bearish market through the technical features set out in the part above.
A bullish market has the following technical features, which you can watch by eye without needing any other tool at all:
- Price makes each high above the one before and each low above the one before
- The rising legs come one after another with pullbacks in between them
The trading strategy in a bullish market
As said above, the strategy we suggest you use in a bullish market is trading with the trend, which means waiting for a chance to enter a Buy. A Sell at this point means you are trading a reversal or looking for a profit from the pullbacks. Trading reversals, though, is far from simple and carries high risk, while making use of the pullbacks does not bring in much, and sometimes it will not even cover the costs if the pullbacks turn out to be very mild.
- The steps for trading with the trend in a bullish market
Entering
Enter after a downward correction, or pullback. Wait for the pullback to end, then enter a Buy.
There are several ways to spot the signal that a pullback has ended:
- Use the simple moving average, the SMA: if price pulls back and touches the SMA, enter after price turns back up.
- Use the trendline (if there is one): when price falls and touches the trendline of the uptrend and then turns back up, enter a Buy.
- Use the signals from the bullish reversal candlestick patterns such as the Bullish Engulfing, the Bullish Reversal Pin Bar, the Morning Star, the Tweezer Bottom and so on.
Compared with chasing price after it has already run far, entering this way usually gives a better Risk:Reward ratio because the stop loss sits closer. Even so, not every pullback ends there; sometimes that is the moment the trend reverses.
Setting the stop loss
Depending on the tool you use to enter, there are different ways to set the stop loss.
- Entering with the SMA: put the stop loss below the SMA at the point where you entered
- Entering with the trendline: put the stop loss below the trendline at the point where you entered
- Entering with a reversal candlestick pattern: the way you set the stop loss differs with each kind of pattern. With a Reversal Pin Bar or a Morning Star, for example, you can put the stop loss below the low of the pin bar candle.
Taking profit
With this strategy you can take profit when price really does reverse, or at any point at which you have reached the profit you were aiming for.
The reversal signals you can use include price cutting down through the simple moving average, price cutting down through the trendline, and the appearance of a bearish reversal candlestick pattern such as the Reversal Bearish Pin Bar, the Evening Star, the Bearish Engulfing, the Tweezer Top and so on.
A note on adding trades (pyramiding): some traders place further Buy trades on new pullbacks inside the same trend. Only do that once the earlier trade is already in profit and you have moved its stop loss at least to break even, and only while the total risk across all the trades stays inside the level you allow (1 to 2% of the account, for example). The longer the trend has run, the riskier adding trades becomes, because it is hard to know how much longer the climax stage will last. A beginner should master managing one trade first. The way you enter, set the stop loss and take profit on the new trades is the same as in the strategy above.
When you are trading several positions, move the stop loss of the older trades up to the same level as the stop loss of the newest one, to lock in part of the profit. Keep in mind that price can still slip through the stop loss level when the market moves hard or at the open on Monday.
Example: trading in a bullish market on the D1 time frame
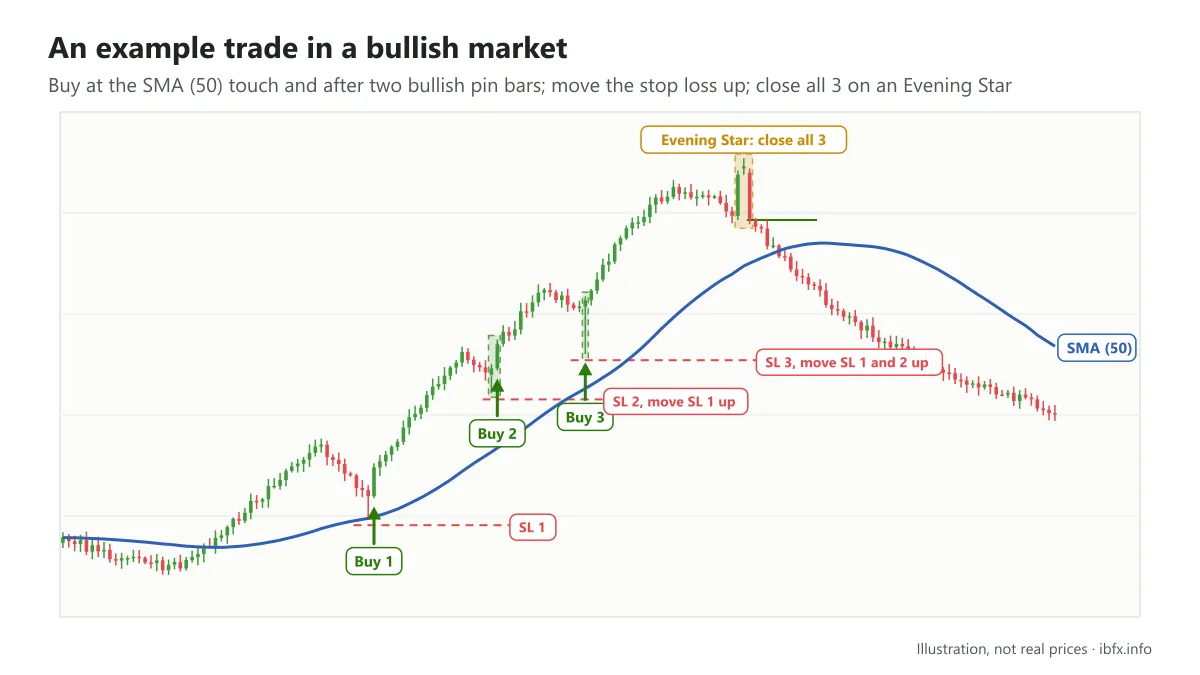
When price cuts up through the SMA and then keeps moving above that line while making new higher highs and new higher lows, we can say the market is in a rising, bullish state.
- When price touches the SMA, get ready to enter the first Buy; wait for the confirming bullish candle right after it to close, then enter. Put the stop loss just below the SMA at the point where you entered.
- After that, price starts moving further away from the SMA, which shows the market is in the climax stage, and it is very hard to enter again on the signal of price touching the SMA once more; instead we will use signals from other tools.
- Price carries on rising and a Bullish Reversal Pin Bar appears, but this Pin Bar has a rather short tail, so you should wait for the confirming bullish candle to appear and close before you enter. Put the stop loss below the low of the Pin Bar, and at the same time move the stop loss of Buy 1 to this level.
- Next, price forms another Bullish Reversal Pin Bar, but this time the tail of the candle is quite long, well beyond the surrounding price area, and the bullish signal is very clear, so you only need to wait for this Pin Bar to close before entering Buy 3. Put the stop loss below the low of the Pin Bar, and at the same time move the stop loss of the 2 earlier trades to this level.
- When no more promising entry signals appear, you should watch the market closely. At this point price starts stalling and moving back towards the SMA. After that the Evening Star pattern appears, giving a bearish reversal signal. You then close all 3 trades once this pattern has finished. Or you can wait until price cuts down through the SMA and close the trades then.
In closing
With stocks, a bullish market brings optimism to investors; they like bullish better and only expect the market to rise. With forex, though, whether it is bullish or bearish a trader can open trades either way, and can lose money either way as well.
The trading-with-the-trend strategy is a favorite with many traders, especially new ones, because it is easier to understand and easier to manage than trading reversals. Even so, no strategy is completely safe: the strategy above will lose money during the stretches in which the market moves sideways or reverses unexpectedly. Try it on a demo account and always cap the risk on each trade before you use real money.