On this page
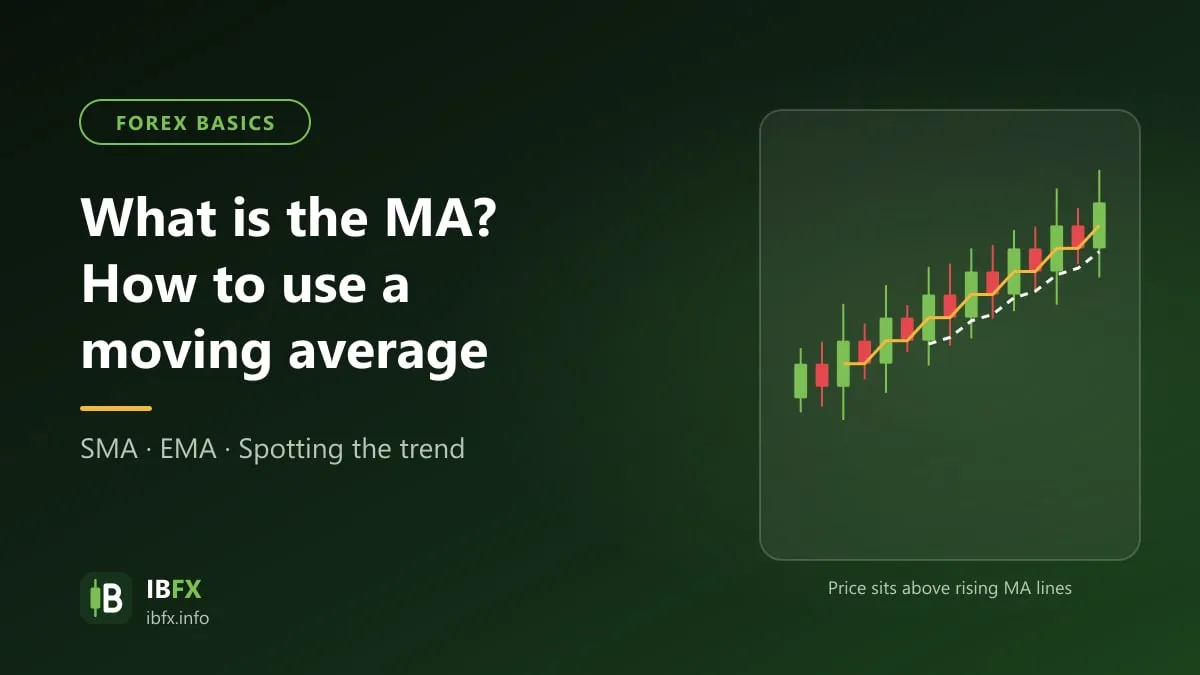
Next to reading market psychology through candlestick patterns, getting to the bottom of what a technical indicator is and how it works looks a great deal harder, above all for a trader who is no mathematician. There is one technical indicator, though, that is very simple, and anyone can understand the principle behind it: the moving average, the MA.
The MA is the simplest indicator in the whole set of indicators on the market, and also one of the most used, because it reflects every step price takes.
If you are a new trader who has never looked into the MA, do not skip this article.
What is the MA? What does the period of an MA tell you?
What is the MA?
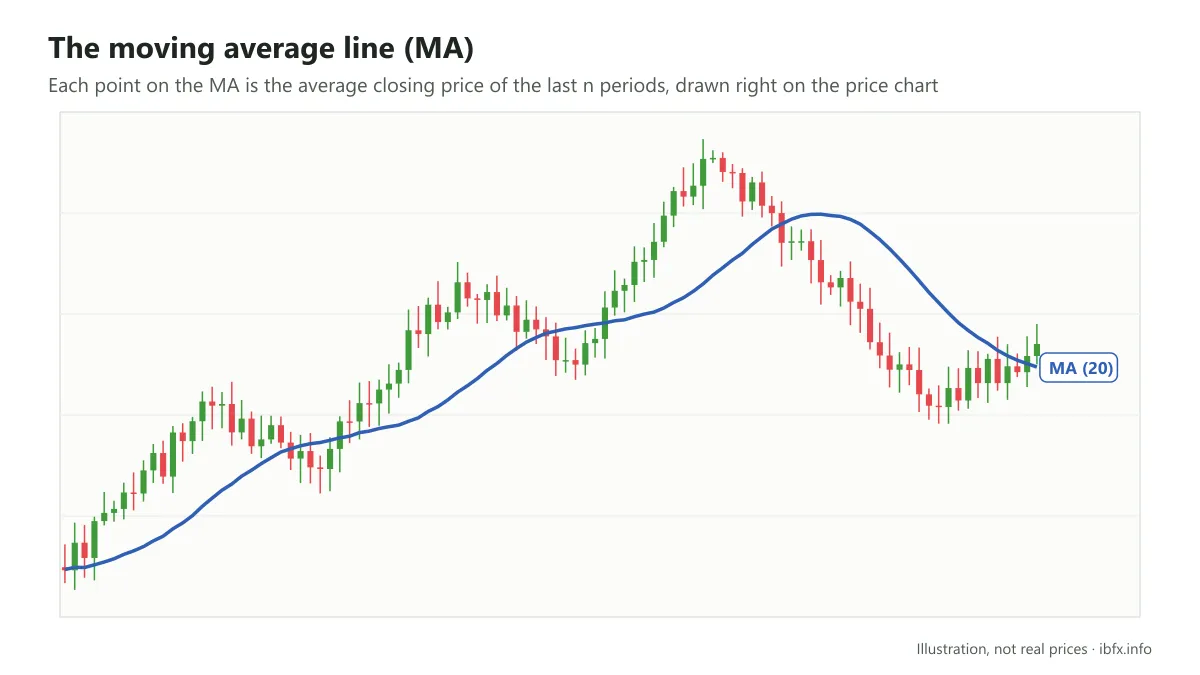
MA, or Moving Average, means a moving or rolling average, and it is a technical analysis indicator on financial markets such as stocks, forex and crypto. The MA line is the set of all the average prices on the market over a given stretch of time. The MA is a lagging indicator and its main use is to smooth price data.
The data traders usually put into the MA is the closing price of the asset, although in theory an analyst could use the open, the high, the low, the average of the high and the low, or even the average of the high, the low and the close. In practice the closing price is the one that goes into the formula, because it is the most important value of a trading session: it shows how that session finally ended.
In trading software the MA is drawn right on the chart together with the price line.
What does the period of an MA tell you?
The MA is written in full as MA (n), where n is the period of the MA.
The period is the stretch of time taken into the average. With a period of 10, for example, you have the 10 closing prices of 10 trading sessions, and the MA is the average of those 10 closing prices. Slide one session forward and you get a new set of 10 closing prices, those 10 values give a new MA value, and on it goes; those MA values are what make up the moving average line.
On different timeframes the period means different things.
For example:
- On D1, the MA(10) values are the average of the closing prices of the last 10 trading days (10 D1 candles).
- On H1, the MA (10) values are the average of the closing prices of the last 10 one-hour sessions (10 H1 candles).
- On M15, the MA (10) values are the average of the closing prices of the last 10 15-minute sessions (10 M15 candles).
As said above, the MA is by nature a lagging indicator and its typical use is to smooth data, so an MA carries a certain amount of lag and a certain amount of smoothing, and the period is what settles those 2 features of an MA.
The smoothing of an MA shows up in how sensitive it is to the price line. The further the MA sits from the price line, the less sensitive it is when price moves, and the higher the smoothing; the other way round, the closer the MA hugs the price line, the more every move in price shows up on the MA, and the lower the smoothing.
The lag shows up in how quickly the indicator reacts against the price line. An MA has low lag when it reacts to a move in price in good time, for instance when price puts in a top and the MA puts in a top as well. The other way round, an MA has high lag when it reacts much later than price does: the price line has already put in a bottom, and only after another stretch of time does the MA put in its bottom. The longer the MA takes to react against price, the higher the lag.
- What the lag and the smoothing of an MA mean for reading the price trend.
The lower the smoothing of an MA (the closer it hugs the price line or the more it moves like it), the harder the trend is to see, because it rises and falls almost like price. The other way round, if the MA is too smooth (the further it moves away from the price line), it only reflects a very long-term trend and reacts very slowly. Note: the MA cannot forecast future prices, it only sums up past prices to help you see the trend more clearly.
An MA with a short lag helps a trader spot a change of trend earlier and enter or exit earlier, but it also gives more noisy signals. The other way round, an MA with a high lag leaves traders unable to keep up with the trend, so the potential profit is lower, though in exchange there are fewer noisy signals.
So how does the period settle the smoothing and the lag of an MA?
The period of an MA is a positive whole number, and in financial trading people sort MA periods into 3 kinds: short-term, medium-term and long-term.
Some of the periods commonly used in analysis are:
- Short-term periods: MA (10), MA(14), MA (20)
- Medium-term period: MA (50)
- Long-term periods: MA (100), MA (200)
The shorter the period, the lower the smoothing and the shorter the lag. The other way round, the longer the period, the higher the smoothing and the higher the lag.
Depending on what they are using it for and on their own strategy, traders use MAs with different periods.
Example: the smoothing and the lag of an MA by period.
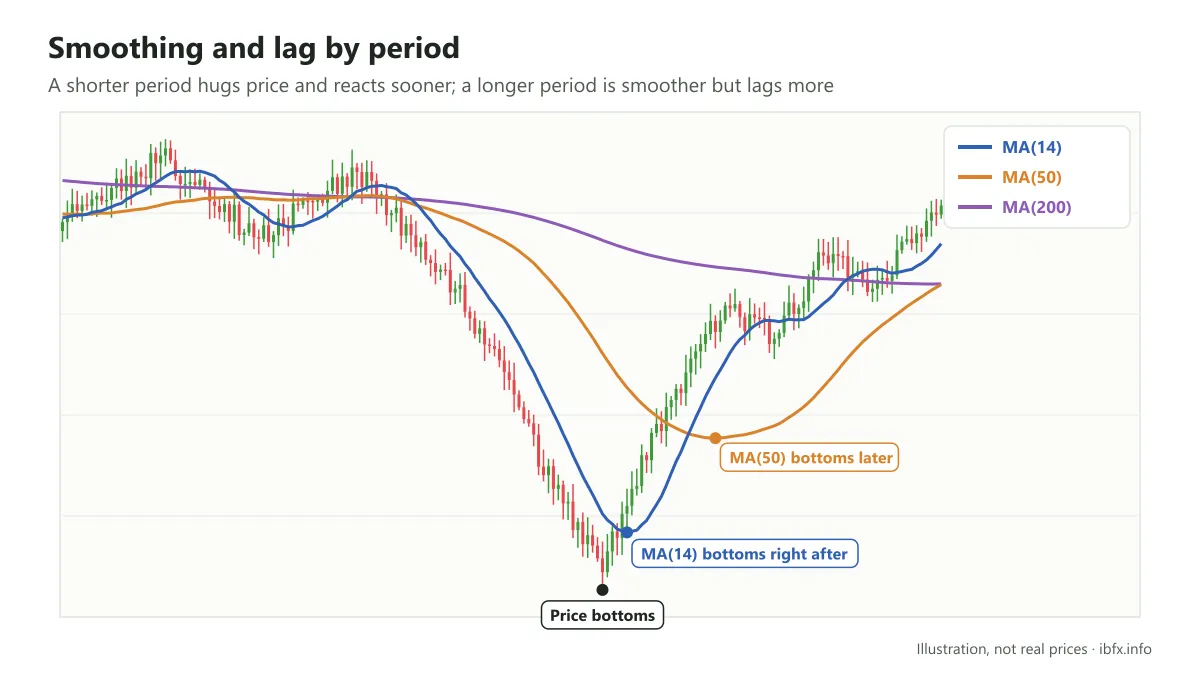
- Smoothing: the MA(14) hugs the price line closest, and every move up and down in price is copied onto the MA(14), so it is hard to use for reading a medium-term trend. The MA(50) is smoother and shows the trend more clearly. The MA(200) is the smoothest and hardly reacts to short-term moves at all; it is widely used to work out the long-term trend rather than to follow every swing in price.
- Lag: the MA(14) has the lowest lag, and once price has put in a bottom the MA puts in its bottom only a few sessions later; the MA(50) puts in its bottom right after that, while the MA(200), which has the highest lag, seems not to react to that move in price at all.
The kinds of moving average. What each one is good and bad at.
The kinds of MA
By the formula they use, MAs are split into 3 different kinds: the SMA, the EMA and the WMA.
- SMA – Simple Moving Average
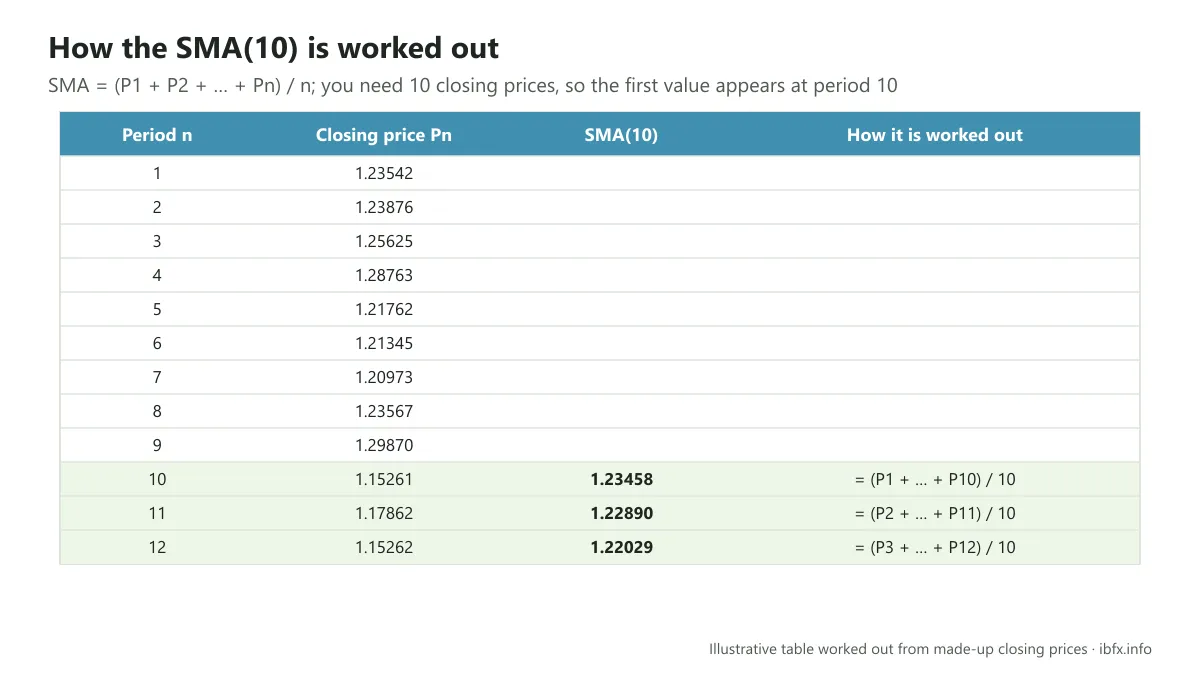
True to its name, the SMA has the simplest formula. Each SMA value is worked out by taking the plain average of the closing prices over n periods.
SMA = (P1+P2+P3+…+Pn)/n
Where Pn is the closing price of the nth trading session and n is the period of the SMA.
An example of how the SMA(10) is worked out
- EMA – Exponential Moving Average
Where the SMA spreads the effect of every past value evenly onto the current value, the idea behind the EMA is the exact opposite. The EMA puts its weight on the most recent moves in price, and the further a value is from now, the less it counts.
Traders who use the EMA hold that prices close to now have more effect on where price goes in future.
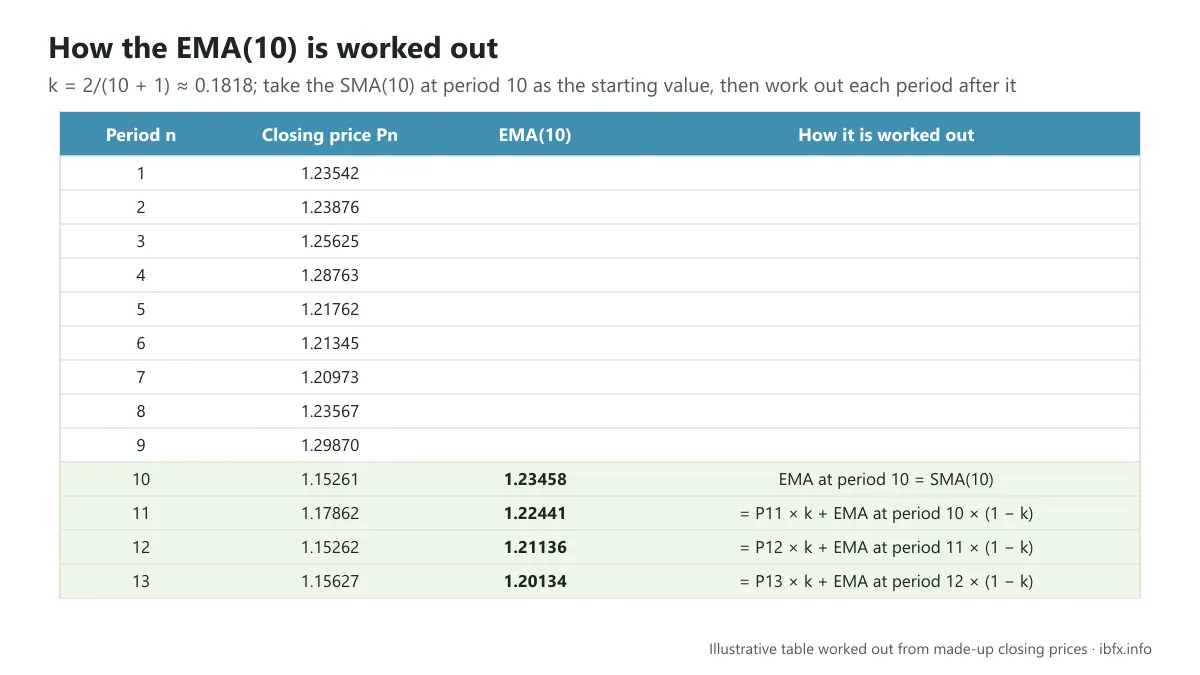
Today’s EMA = today’s closing price * k + yesterday’s EMA * (1 - k)
Where k is the smoothing factor, k = 2/(N+1), and N is the period of the EMA.
An example of how the EMA(10) is worked out
First, work out k = 2/(10+1) = 0.1818. By the formula we can only work out an EMA(10) value from the 11th trading session onwards, and one value has to be assumed: the EMA(10) of the 10th session. Usually people use the SMA(10) of the 10th session to stand in for the EMA(10). The reason the EMA(10) of the 10th session cannot be worked out is that it would need the EMA(10) of the 9th session, and the SMA(10) value of the 9th session cannot be worked out because there is not enough closing price data.
- WMA – Weighted Moving Average
This is a moving average with a rather involved formula, and the idea behind the WMA is much the same as the EMA: it puts the weight on the values closest to now. The weighted moving average method uses the period of the WMA itself as the biggest weight for the most recent closing price, and the remaining weights step down from there.
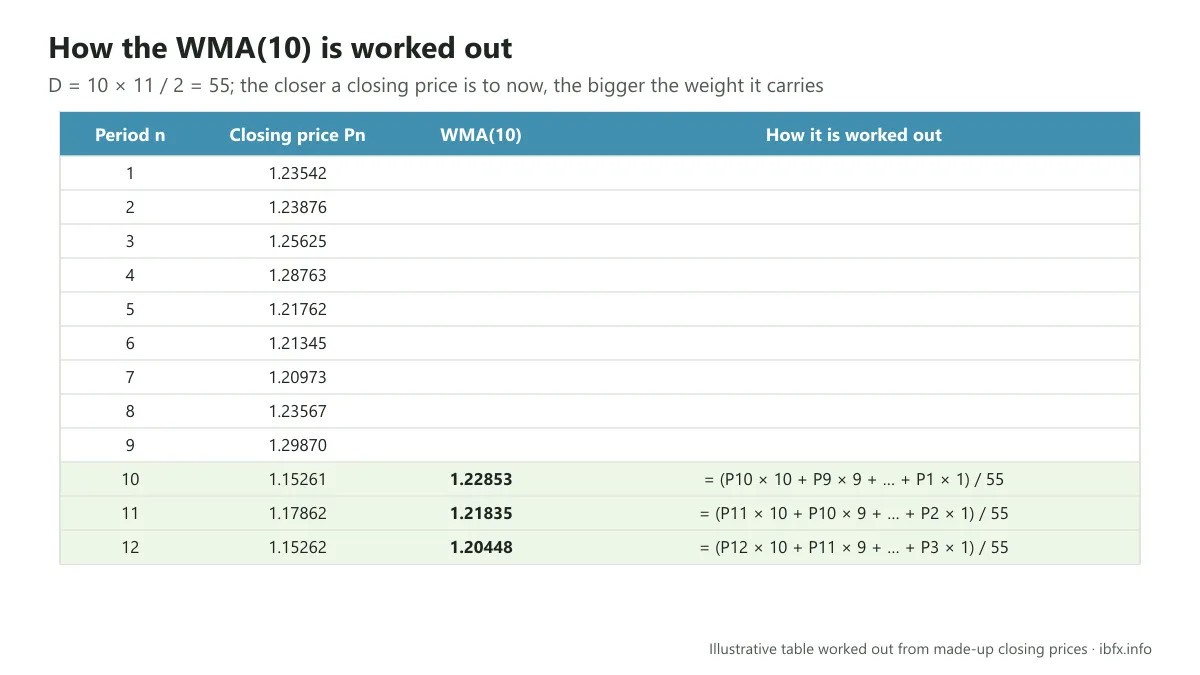
Take the WMA(10): in the averaging formula the closing price of the 10th session (P10) carries the biggest weight, 10, P9 carries the weight 9… and P1 carries the weight 1.
WMA = [Pn*n + Pn-1*(n-1) + Pn-2*(n-2) + … + P1*1]/D
Where D = 1+2+3+…+ (n-1) + n = [n*(n+1)]/2
An example of how the WMA(10) is worked out
First work out D = [10*(10+1)]/2 = 55. Unlike the EMA, we can work out a WMA(10) value from the 10th trading session onwards.
What each kind of MA is good and bad at
To compare what the different MAs are good and bad at, the first rule is that they have to use the same period and sit on the same timeframe.
Look at the picture below:
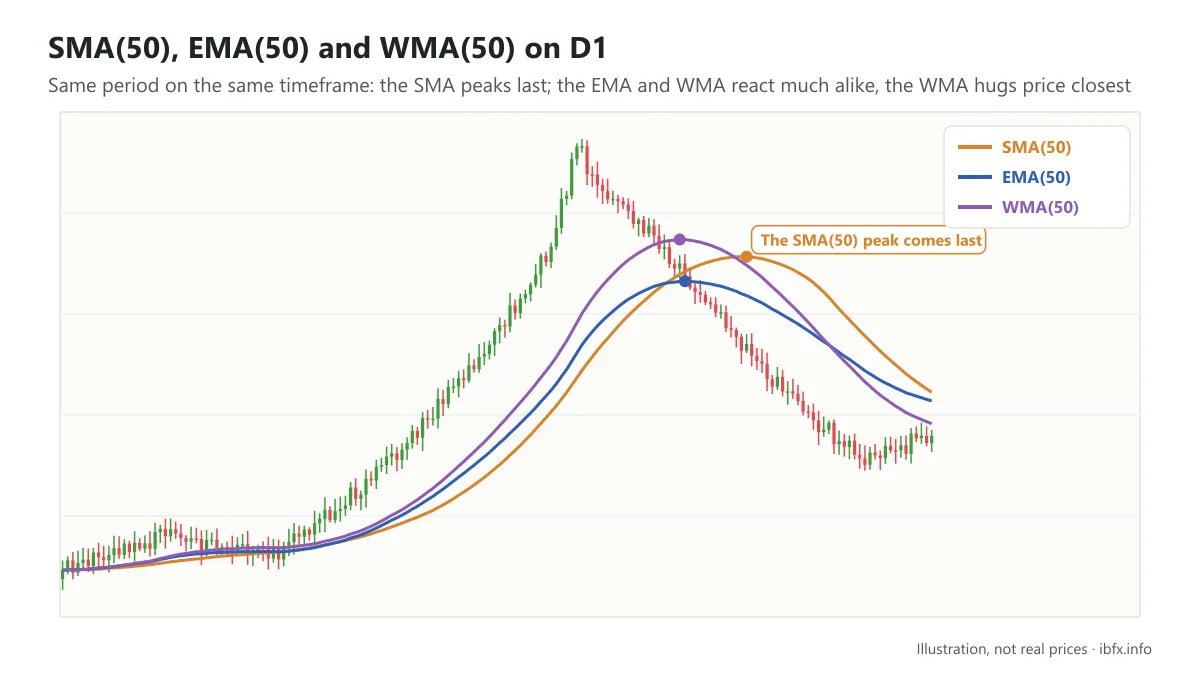
Above are the 3 lines SMA(50), EMA(50) and WMA(50) on the D1 timeframe.
Using the medium-term period 50 makes the MAs smooth without being too flat, and the lag is not too high either, so you can read the trend and find a decent place to enter.
The period 50 used on D1 stands for about 1 quarter of trading, so on the chart it is perfectly normal for the MAs to react slowly against price.
Of the 3 MAs, the SMA(50) has the highest lag, because the moment it puts in its top comes latest compared with the 2 lines EMA(50) and WMA(50). If you are looking for a signal that gets ahead of the trend so you can enter, the SMA(50) gives the latest signal and the lowest potential profit. The EMA(50) and the WMA(50) have much the same lag and react to price in much the same way.
As for smoothing, the WMA(50) seems to hug the price line closest, then the EMA(50) and last the SMA(50). Although all 3 read the trend about as well as each other, the WMA(50) sits closer to the price line and so produces noisy signals more easily.
Let us look at one more example.
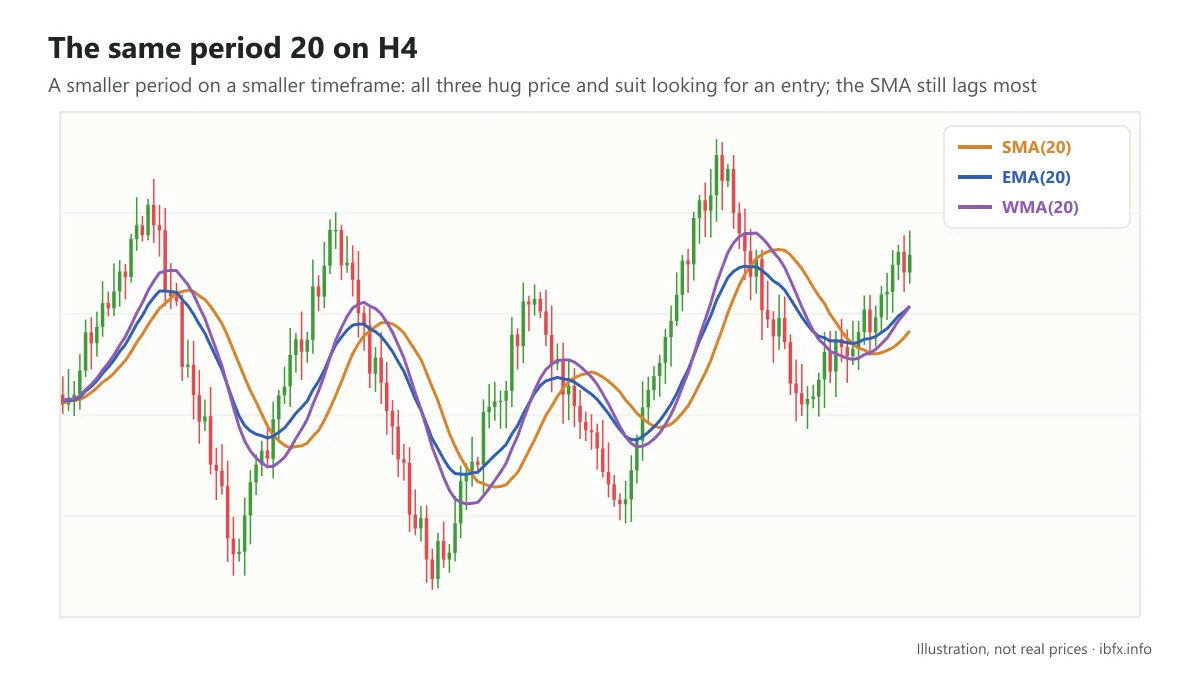
The picture above shows the 3 moving averages with the same period 20 on the H4 timeframe.
In this example you can easily compare the smoothing and the lag of the 3 MAs. The point worth stressing here is that we can use smaller periods on smaller timeframes to find a better place to enter, because all 3 MAs now hug the price line fairly closely and react faster and better. Of course, the job of reading the broad trend goes to a larger period on a larger timeframe, as in the example above.
To sum up, when you compare MAs with the same period on one timeframe:
- The SMA is the smoothest, shows the trend clearly and strips out a lot of noisy signals. The SMA has the highest lag, though, so it is the worst at pinning down a place to enter or exit.
- The EMA and the WMA have much the same lag and smoothing. Lower lag than the SMA helps you enter better, but because they hug price more closely they give more noisy signals.
There is really no single right answer to which MA you should use. Every MA has its own strong and weak points, and depending on the purpose and the particular strategy, each trader uses the MA in their own way. From the 2 examples above, though, we can draw a few points:
- If you want to work out the broad long-term trend, use the SMA with a large period on a large timeframe.
- If you are looking for a place to enter or exit, use the EMA or the WMA with a smaller period, on a smaller timeframe.
Using the moving average in your trading
Among hundreds of technical indicators, why use one this basic, with a formula this simple? No indicator forecasts price accurately, but the MA helps answer a simple and important question: is price now above or below its recent average.
What the moving average means in analysis
To understand why so many traders, whether they follow technical analysis or price action, still put an MA on their price chart, you have to understand what the MA really is and what it means in analysis.
The moving average is a familiar statistical tool for smoothing a series of figures over time (sales, temperature, case counts…), so that you can see the broad trend instead of being confused by small swings.
So what does a moving average value mean to a trader on the financial markets?
Traders usually try to work out where the market is going by comparing one stretch of time against another. In Q1 the AAA share had a strong run up, in Q2 it started to fall back gently — what will the AAA share price do in Q3? When they look at the change from Q1 to Q2, analysts usually cannot examine every single value of the AAA share price across the 2 quarters: that is far too much data and it cannot all be compared. The answer is to find the average share price of Q1 and compare it with the average share price of Q2, and from that work out where Q3 might go. That is the first thing a moving average means in financial analysis.
Second, you can read a moving average value as the average “agreed” price of the market over that stretch. If price now is above the average of the stretch before, buyers are willing to pay above the recent average, which is a sign of an uptrend; but that is no guarantee price will keep rising.
Trading strategies with the moving average
In this part, in the worked examples, we will use the simple moving average, the SMA, to illustrate the trading strategies with an MA. As said above, which kind of MA you use still depends on the purpose and the particular strategy of each person.
- The cross between the MA and the price line.
The idea behind this strategy comes from the 2nd meaning of the MA: comparing price now against the recent average price.
- If most of price sits above the MA, the market is in an uptrend.
- If most of price sits below the MA, the market is in a downtrend.
This is treated as the simplest of the MA strategies, but it is also the one with the most noisy signals and the most risk.
How you enter:
- Enter a Buy when price crosses the MA from below 🡪 the market turns from falling to rising.
- Enter a Sell when price crosses the MA from above 🡪 the market turns from rising to falling.
Where to put the stop loss and the take profit
- Put the stop loss below the nearest low before it for a Buy, or above the nearest high before it for a Sell.
- Take profit when you reach your profit target, when a reversal signal appears, or when price crosses the MA from above for a Buy, and from below for a Sell.
Example: the SMA(50) on the D1 timeframe
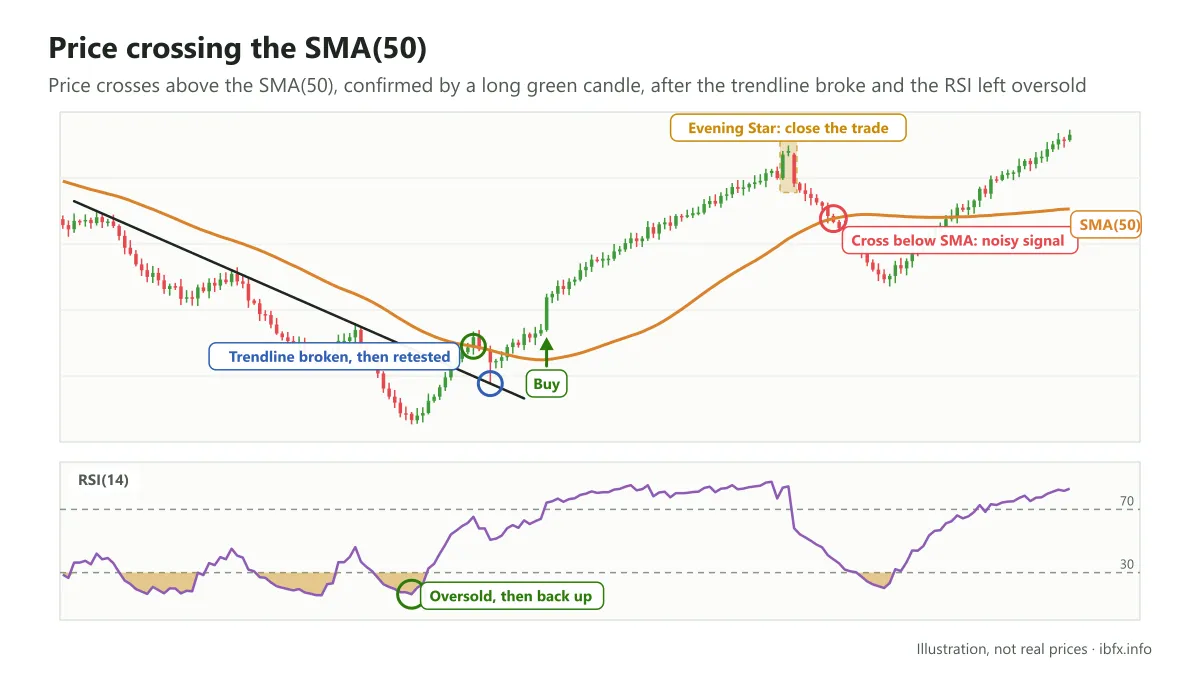
In the stretch before, most of the prices sat below the SMA, and the market held a downtrend for quite a while.
When price crossed the SMA from below, it gave the signal to enter a Buy, and that signal was then confirmed by a green candle with a long body; enter the Buy as soon as that green candle closes. After price had risen for a while, just as hoped, a bearish reversal pattern appeared, the Evening Star, giving the signal that the run up was over, and you can close the trade when the pattern completes. You can also close the trade when price starts to cross the SMA from above, although in this case closing on the cross between the SMA and price cuts the profit down.
At the same moment price crossed the SMA from above, if you had gone on to enter a Sell the trade would have lost money, because that was not a signal of a change of trend but a noisy signal: price went straight back up afterwards. In practice this kind of cross happens very often.
So the question is, how do you know which cross signal is trustworthy?
As said above, trading the cross between the MA and the price line is simple but risky, because there are far too many noisy signals. To filter out the trustworthy signals, you should combine it with other tools and methods that confirm a reversal signal.
In the case above, before the cross happened, the RSI had already gone into oversold and come back out of it, suggesting selling pressure was draining away. At the same time, before that, price had broken out of the resistance level, the trendline of the downtrend, then retested that level and turned back up, which made the signal that price would rise firmer still.
- The cross between a fast MA and a slow MA
The words fast and slow come from how the MA reacts to moves in price: an MA that reacts quickly to price is called a fast MA, and the other way round. So it is easy to see that what makes an MA fast or slow is its lag, or its period.
An MA with a short period plays the part of the fast MA, and an MA with a longer period is the slow MA.
The trading idea runs like this:
- The fast MA is above the slow MA 🡪 the market is in an uptrend
- The fast MA is below the slow MA 🡪 the market is in a downtrend.
The idea behind this strategy comes from the cross between the MA and the price line. The price line is itself an MA with a period of 1, so the price line is always the fast MA.
How you enter, in detail:
- Enter a Buy when the fast MA crosses the slow MA from below 🡪 the market turns from falling to rising
- Enter a Sell when the fast MA crosses the slow MA from above 🡪 the market turns from rising to falling.
Where to put the stop loss and the take profit is the same as in the strategy above.
One famous pair of crosses is the MA(50) and the MA(200) on D1: the MA(50) crossing above the MA(200) is called the Golden Cross, and crossing below it is called the Death Cross. Because they use long periods, this signal arrives very late and is usually treated as confirmation of the long-term trend rather than as a place to enter.
Example: the SMA(20) and the SMA (50) on the D1 timeframe
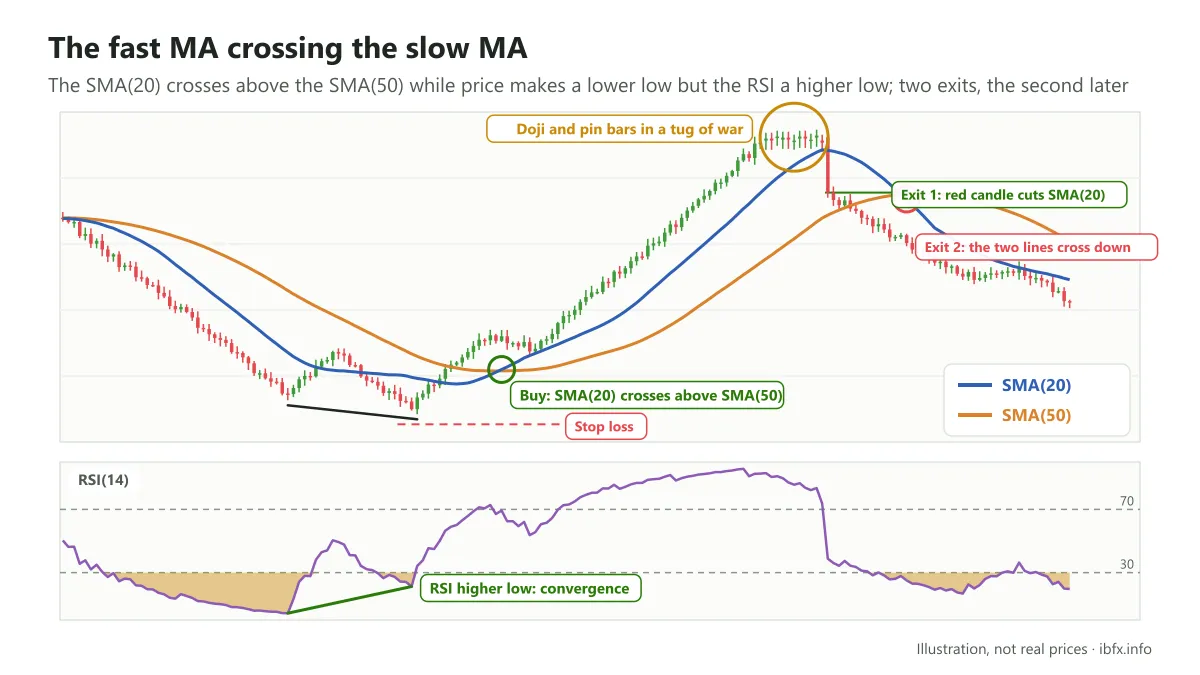
In the stretch of time before, the fast MA sat below the slow MA for most of it, and the market was in a downtrend. Then the fast MA crossed the slow MA from below, giving the signal to enter a Buy. That signal was made firmer when, at the same place, a convergence signal appeared between the RSI and the price line, pointing to the market turning from falling to rising.
Enter the Buy as soon as the fast MA gets above the slow MA, and put the stop loss below the nearest low before it.
As for the signal to take profit in this case, you have 2 ways to do it. The first: after price had risen for a while, the market started to slow down with a run of Doji and Pin bar candles (circled at the top of the uptrend), an area that shows the 2 sides pulling against each other through session after session with neither getting the upper hand. Right after that, a red candle with a fairly long body appeared and cut the SMA(20) from above, showing strong selling pressure and the chance of a change of trend. You can close the trade right there. The second: you can close the trade on the signal of the fast MA crossing the slow MA from above, although this way cuts the profit down by quite a lot.
- Trading at the support/resistance zone made by the MAs
As we know, if most of price sits above the MA the market is in an uptrend, and the MA then plays the part of an important support level of that uptrend. In the same way, an MA sitting above the price line plays the part of an important resistance level of a downtrend.
Example: the SMA(20) and the SMA(50) on the D1 timeframe
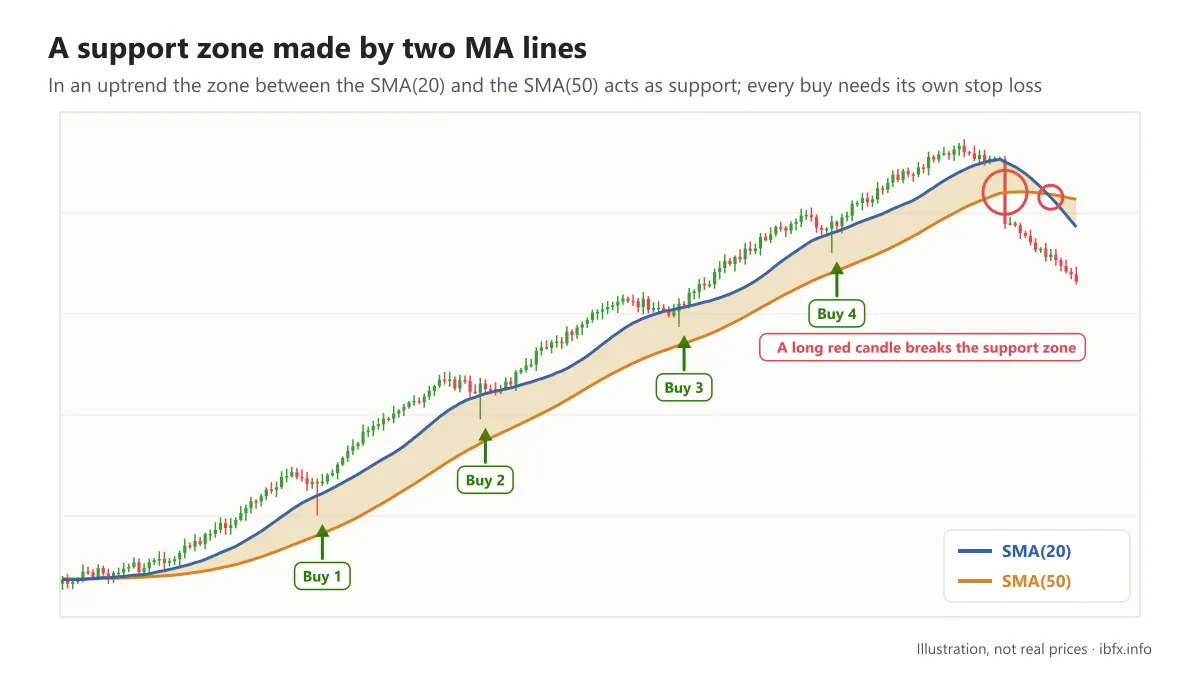
In the picture above, the 2 MAs make up an important support zone of the uptrend: first, most of price sits above this barrier zone, and second, when price touches the barrier zone it turns back up.
The strategy in this case is to enter a Buy when price touches the support zone and then turns back up. You can enter several trades one after another, but mind your trailing stop so as to lock in profit, and keep the total risk of all the trades within what you allow yourself (1–2% of the account, for instance).
The important problem when you trade this strategy, though, is working out when price is turning back and when price is really breaking the support zone. At the 4 Buys, price did get a little way out of the support zone, but at those points the fast MA was still above the slow MA, so the chance of price reversing was low. In the case near the top of the uptrend, a red candle with a very long body drove through the support zone and after that the fast MA crossed the slow MA from above; at that point the breakout signal was fairly clear.
To trade this strategy better, you need to look more closely into the situations where price breaks out on the market.
See also: What is a breakout? How to spot a breakout and a false breakout.
Conclusion
Understanding the moving average is not hard at all, and neither is putting it to work in a trading strategy. But in every one of the examples above, every strategy carries noisy signals, and if you do not have the experience to spot them you will fall into the traps of the market very easily. Above all, traders use the MA as a reference indicator: it needs signals from other tools and methods alongside it, and only then does using the MA in analysis really pay off. Test the strategies above on a demo account before you use them with real money.