On this page
Price almost never runs in a straight line with the trend: every so often it turns back for a leg before carrying on. That leg back is a pullback, and for a trader working with the trend it is usually the best place to enter. This article covers what a pullback is, how to tell one from a genuine reversal, and six rules for trading pullbacks.
What is a pullback?
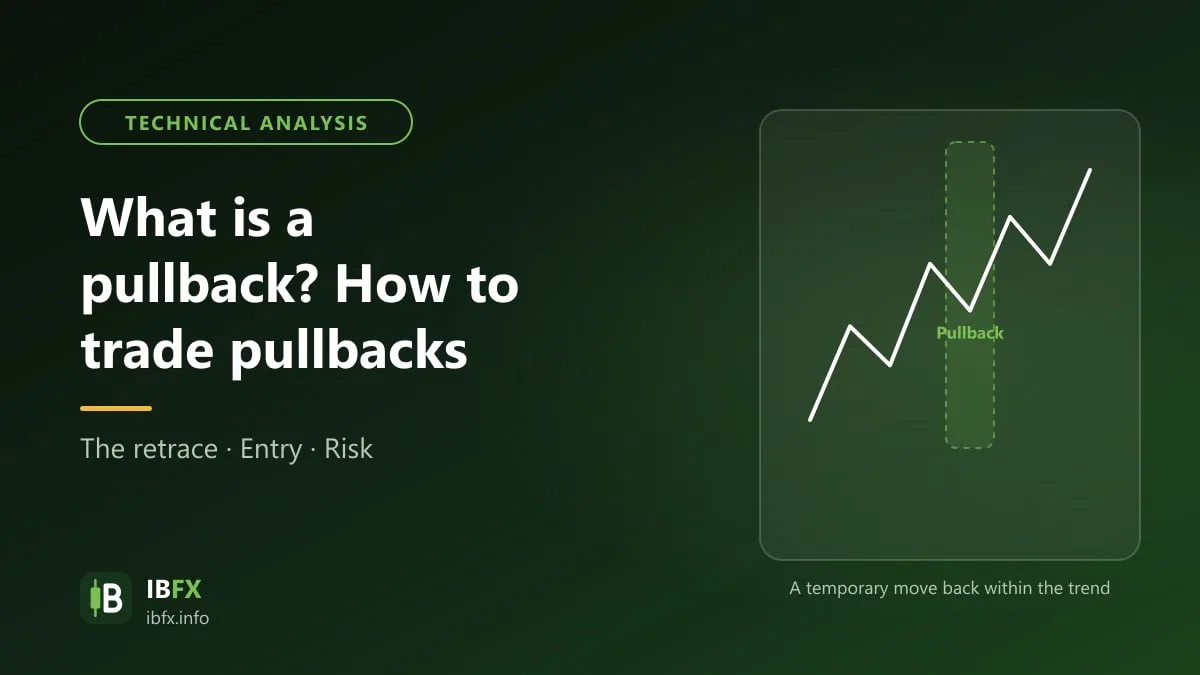
A pullback, put simply, is the stretch where price temporarily moves against the main trend (which may be up or down) that was set before it, to correct the price, before price goes back to following the old trend.
That is why a pullback is also called a price correction or a retracement. How long a pullback runs can be short or long depending on the length of the trend, and there are 2 main kinds of pullback: a pullback inside an uptrend, and a pullback inside a downtrend, as illustrated below:
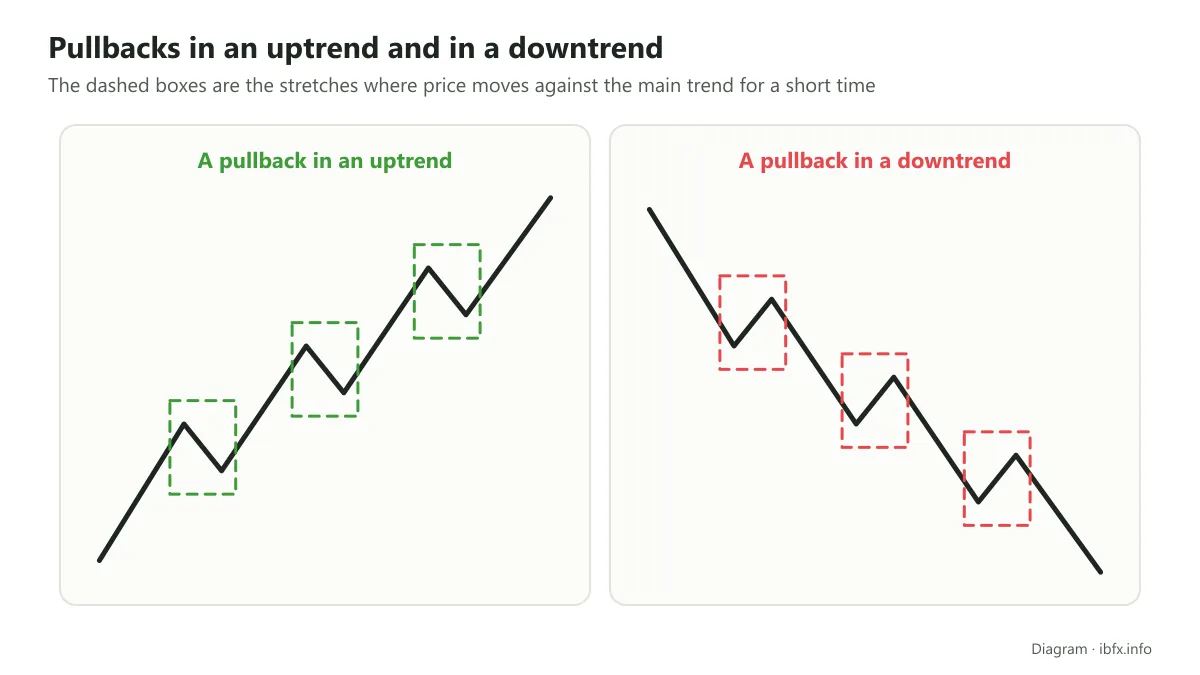
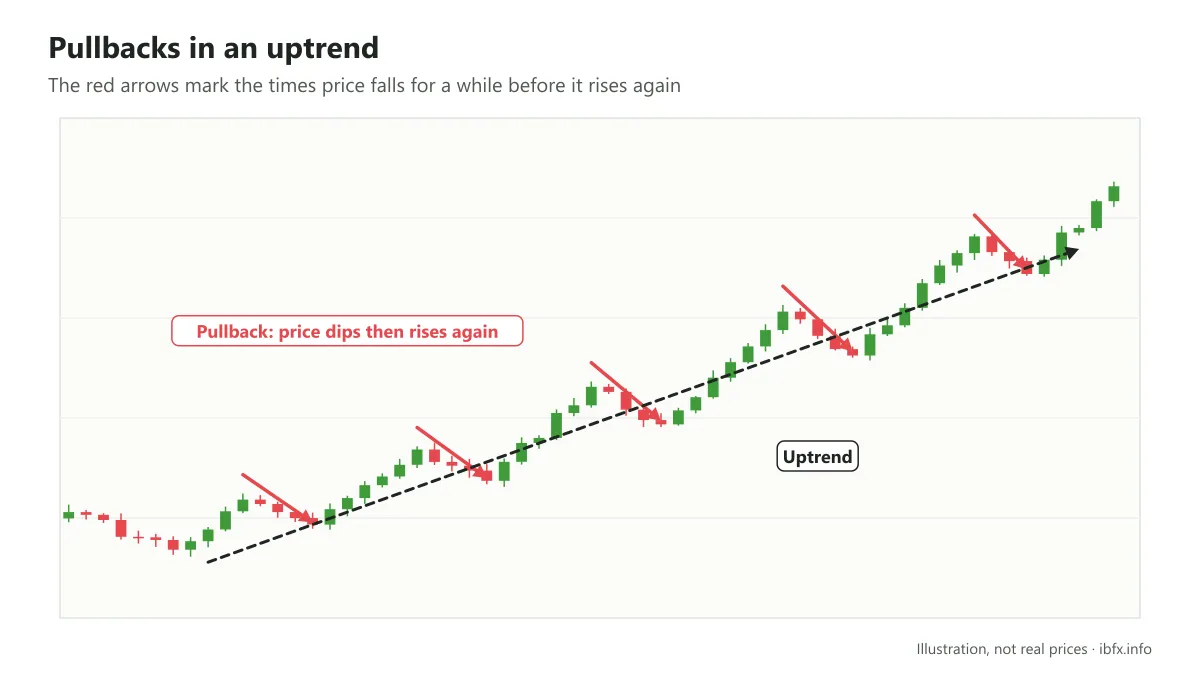
In a market with an uptrend, price rises step by step, but even while it is rising there are moments when price falls for a stretch, and only then rises again and goes past the previous high.
In the same way, in a market with a downtrend, price falls step by step but there are moments when it rises again, and after that it keeps going down, making lows below the low before them. The red stretches in the picture below are the pullbacks in both the downtrend and the uptrend.
When does a pullback show up?
A pullback is a correction, and it usually shows up after a strong move with the trend, when some traders take profit and price is overbought or oversold (which you can watch on oscillators such as RSI or Stochastic). If it really is a pullback, once this stretch ends price will go back to following the main direction. So a pullback can be seen as a rest for the trend, a moment to gather momentum before it carries on.
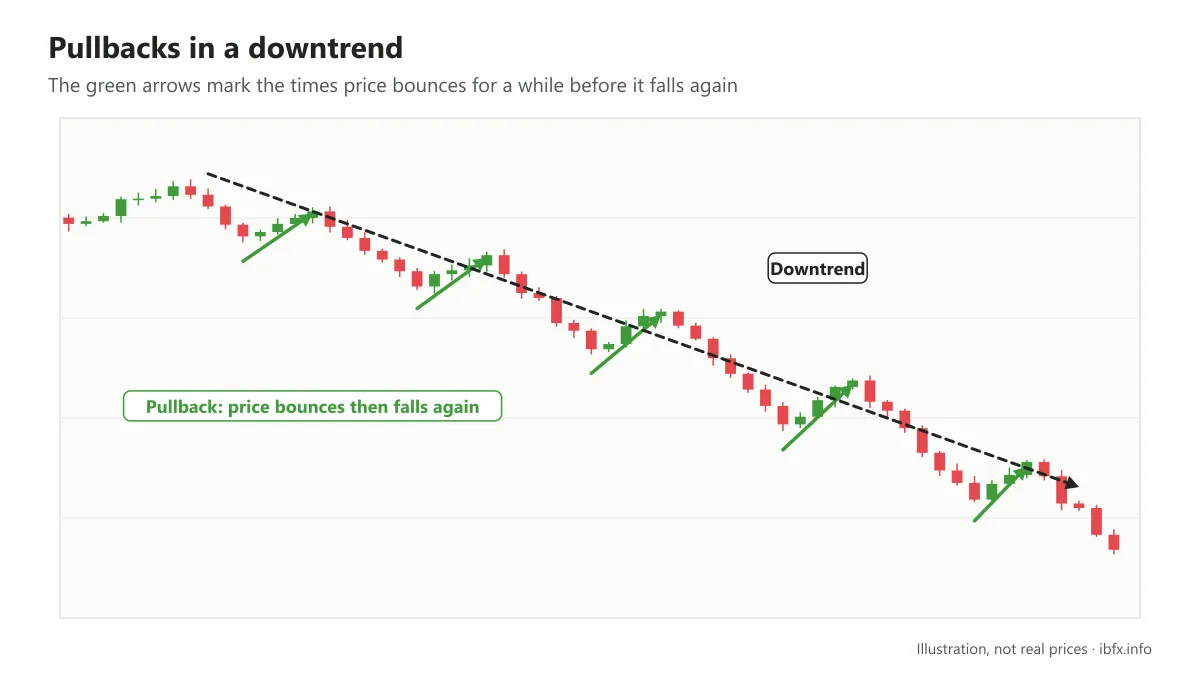
Please note: a pullback is a stretch where price moves against the main trend but only for a while, whereas a reversal is when the main trend really changes, for example from a downtrend into an uptrend and the other way round. A reversal usually lasts longer and changes the structure of the highs and lows of price.
The difference between a pullback and a trend reversal
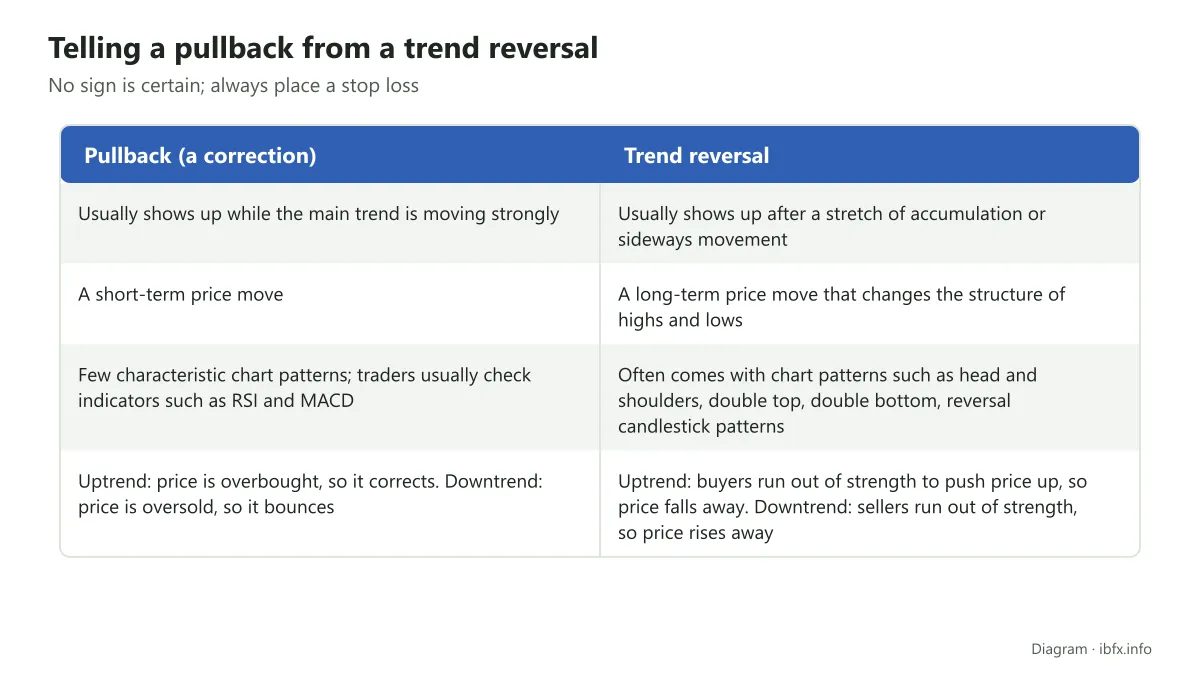
When you see price moving against the trend, you need to work out clearly whether it is a pullback or a reversal. Traders who cannot tell the two apart, beginners above all, very easily take the wrong trade: they think it is a pullback and enter with the old trend while price has already reversed, or they think price has reversed and trade against the trend while price is only correcting.
Some signs that help you tell them apart (with an uptrend as the example):
- A pullback usually does not break below the most recent low of the trend; if price closes below that low, the chance of a reversal goes up.
- A pullback usually corrects a moderate amount (it often stops around the Fibonacci 38.2% to 61.8% zone), while a reversal usually runs deeper.
- A pullback usually moves more slowly, with smaller candles than the rise before it.
No sign is certain, so you always need to place a stop loss.
The advantage of trading pullbacks
Trading pullbacks gets you into a trade at a better price than chasing a buy or chasing a sell: in an uptrend you wait for a pullback to buy lower; in a downtrend you wait for a pullback to sell higher. Because of that your stop loss is usually closer and your reward-to-risk ratio is better. A pullback can turn into a reversal, though, so this is not a way of trading that takes the risk away.
The indicators used to trade pullbacks
Before you look at how to trade pullbacks, you should know a few tools that make the trading work better:
Fibonacci retracement: Fibonacci is a very common tool in forex trading, and it helps you find the potential support and resistance levels at which price may turn. When you trade pullbacks, the Fibonacci 38.2%, 50% and 61.8% levels are the ones to keep in mind. The stronger the trend, the smaller the correction usually is, sometimes only as far as the 38.2% level instead of 50% or 61.8%.
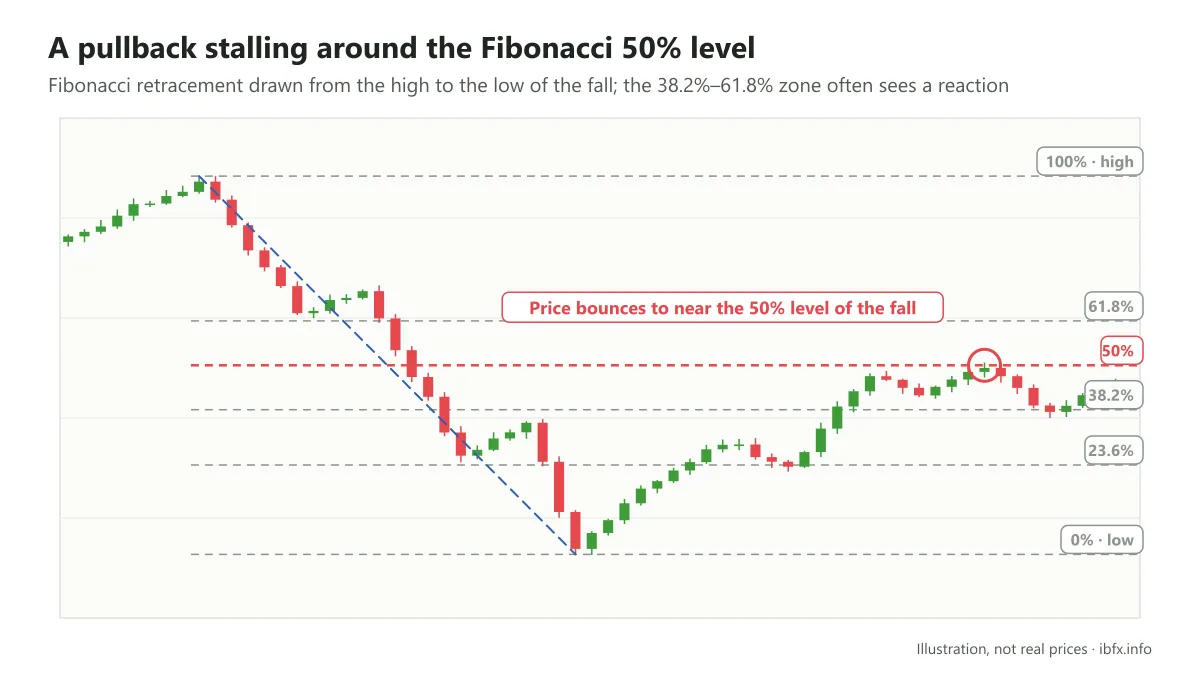
In the example above, price fell sharply then bounced to near the Fibonacci 50% retracement of the whole fall and weakened there. This is a zone where a trader following the downtrend can consider a Sell, with a stop loss above the zone.
Trendline
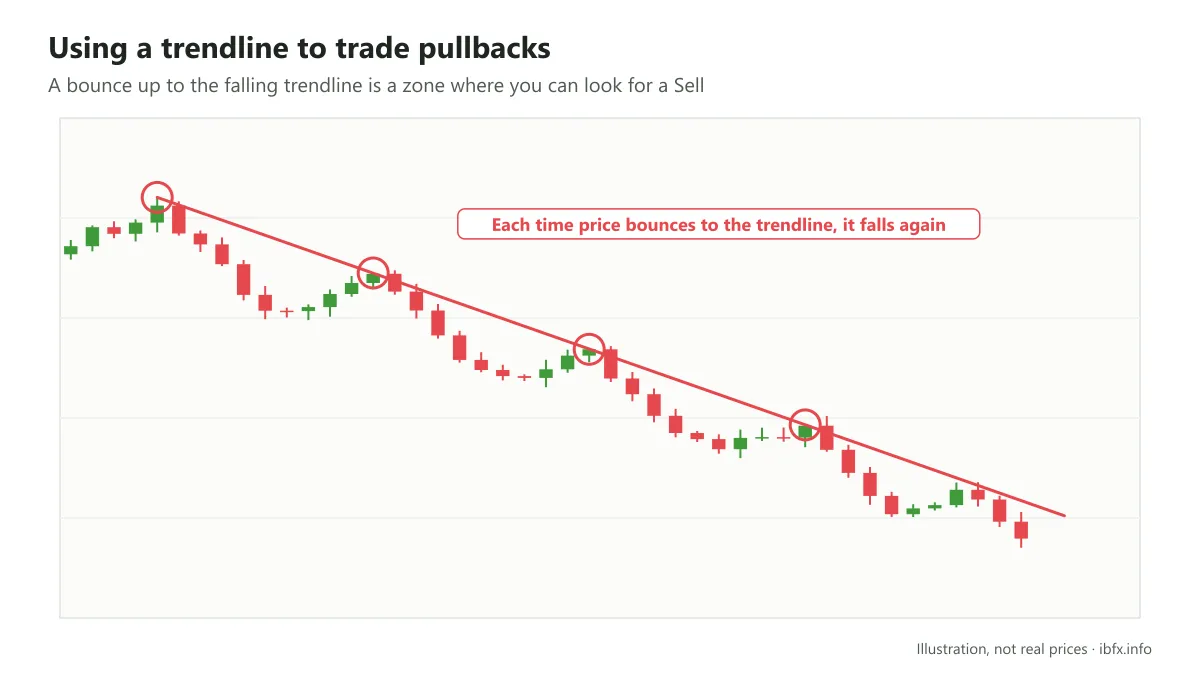
Using a simple trendline is also a good way to trade pullbacks. On the chart below, you can see that each time price bounces up to the red trendline it falls again, which creates many chances to Sell with the trend over several months.
Moving averages
A moving average is very useful when you trade pullbacks too. There are many kinds and many periods for you to choose from, and among them the MA/EMA 200 is used by many traders because it shows the long-term trend. Read more: what the EMA is.
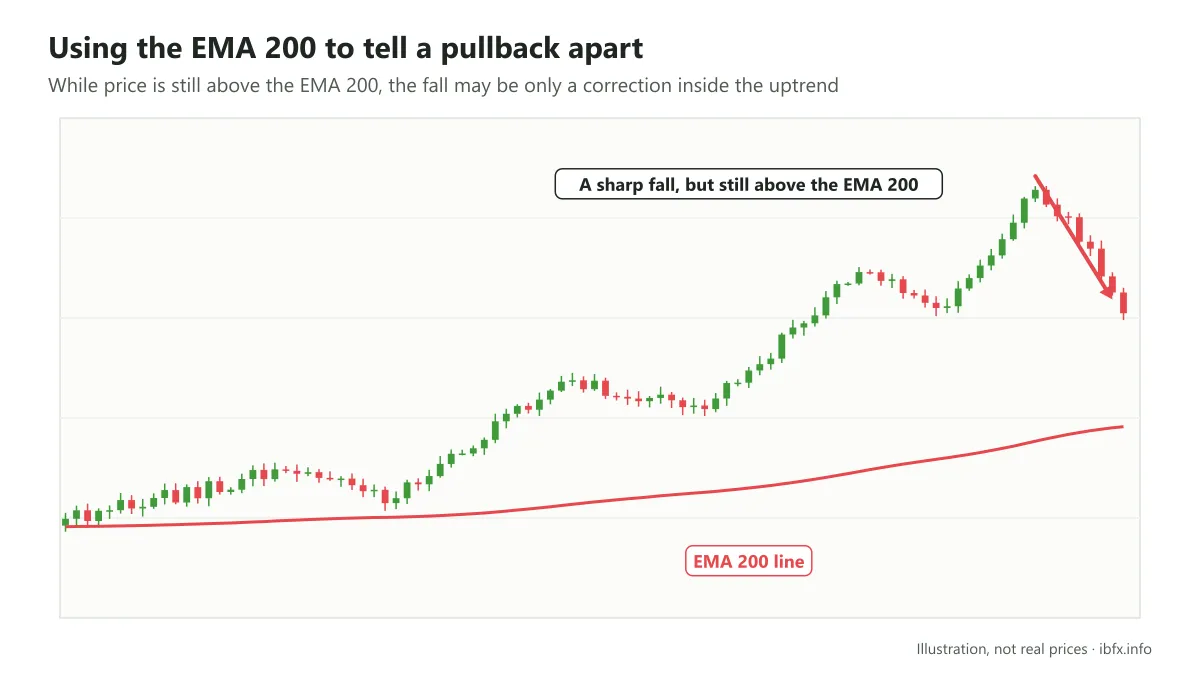
In the example above, price had risen a good deal over several months and then fell sharply. Price still held above the EMA 200, though, a hint that this may be only a pullback rather than a trend reversal, so a trader following the trend can wait for a signal that the pullback is over and then look for a Buy.
How do you trade a pullback?
To trade a pullback, the most important thing is to identify the trend correctly, and then follow the steps below (with an uptrend as the example):
Rule #1: a bullish (rising) trend usually shows itself as a series of higher highs and higher lows.
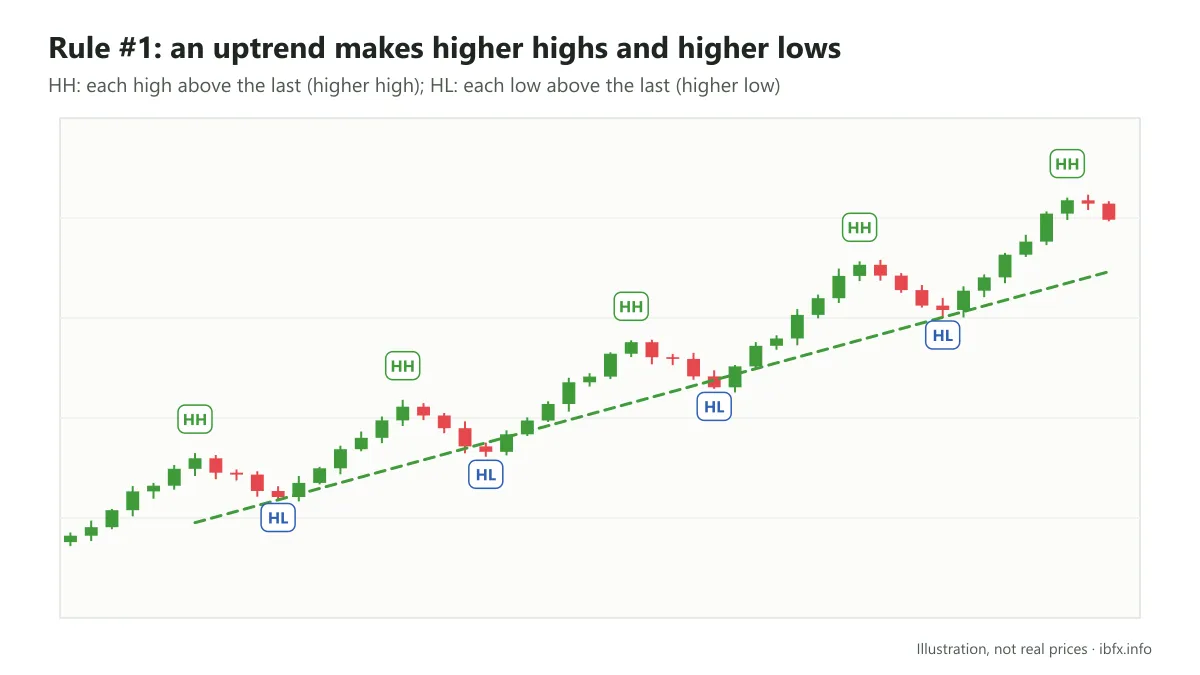
This is the simplest way to identify an uptrend. To avoid noise, you should identify the trend on larger time frames such as H4 or D1.
Rule #2: once you have identified the trend, drop to a smaller time frame (H1, for example) and wait for the pullback to happen.
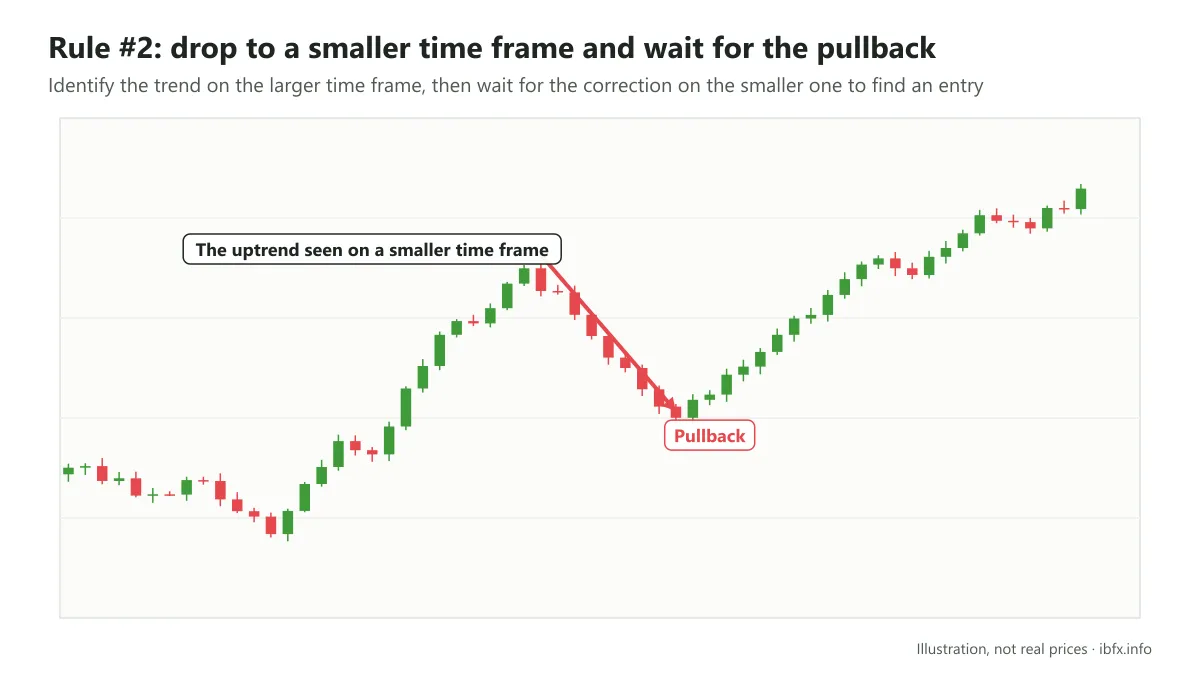
Once you have identified the trend, you can move to smaller time frames such as H1, M30 or M15 to find an entry; H1 is the one many traders use because it is less noisy than M15 and M30.
Rule #3: use Fibonacci to find the zone where price corrects (the pullback)
How to draw the Fibonacci retracement is covered in the article: how to use Fibonacci retracement to find an entry.
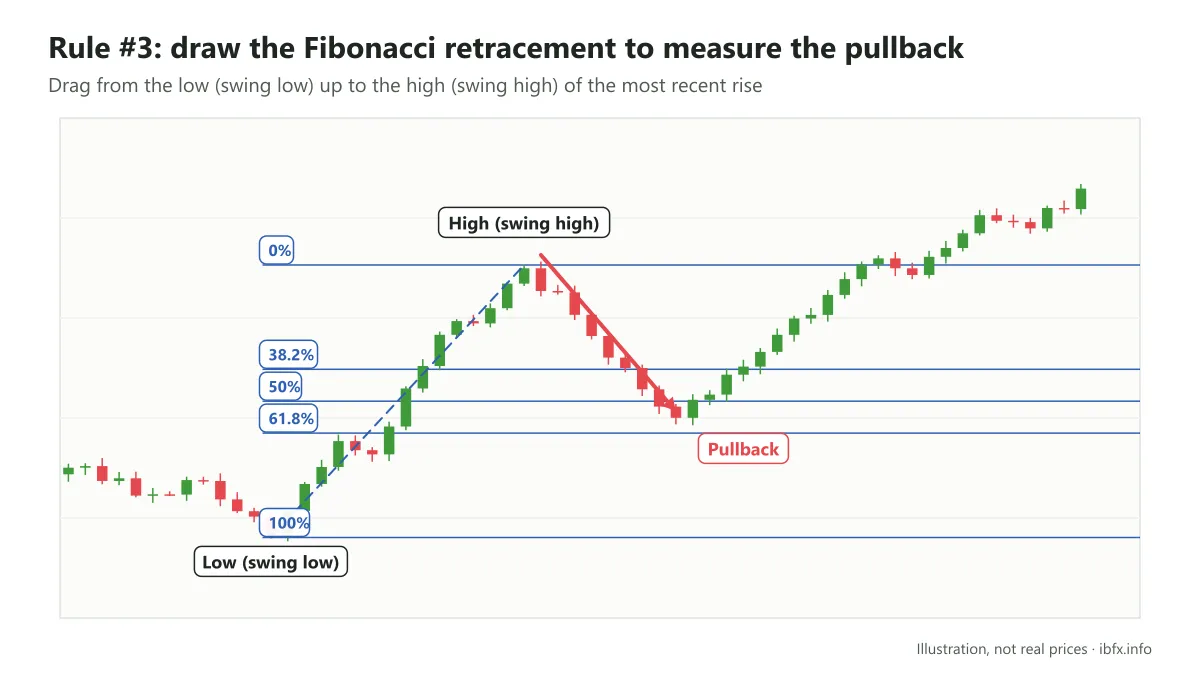
Rule #4: look for a chance to buy in the 50% to 61.8% zone of the Fibonacci retracement.
Once you have drawn the Fibonacci retracement, the 50% to 61.8% zone is the price zone worth watching for a buy, because that is where a pullback most often stops. Note that the stronger the trend, the shallower the retracement: sometimes it reaches only 38.2% before carrying on, and waiting for 50% would mean missing the trade, so take the 38.2% zone into account as well when the trend is very strong. To be safer, wait for a signal that price is bouncing in this zone (such as a pin bar or a bullish engulfing candle) before you enter.
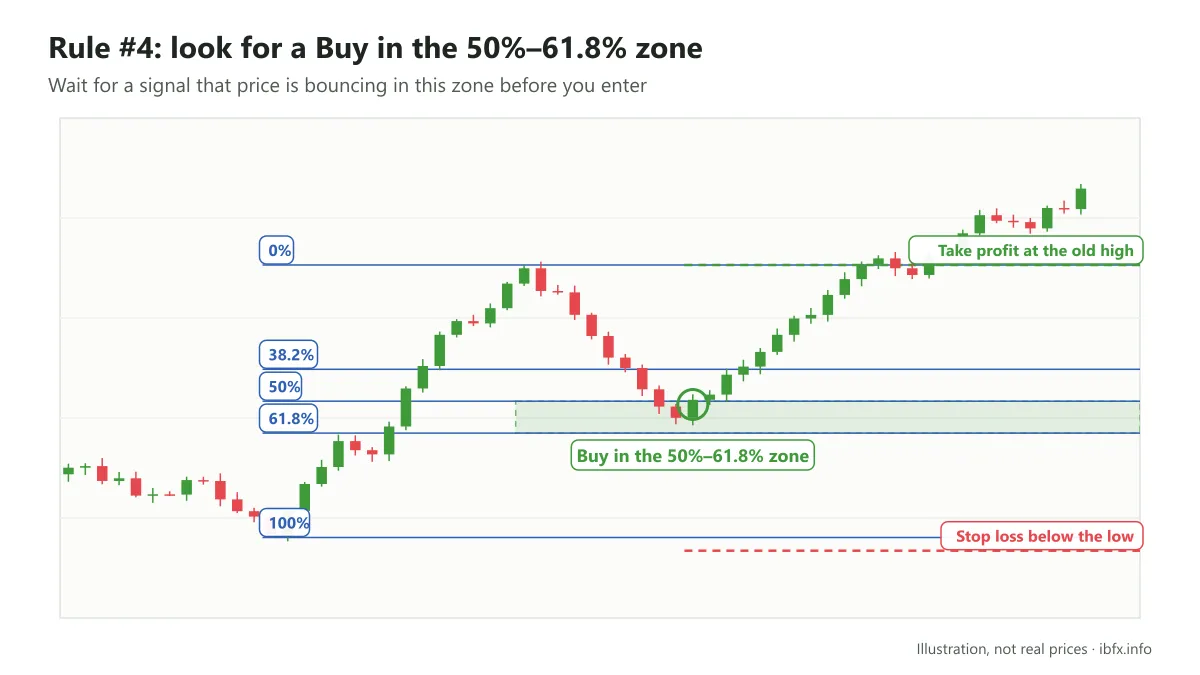
Rule #5: place the stop loss below the low (the swing low)
A sensible stop loss sits below the lowest point used to draw the Fibonacci retracement, because if price breaks that low the uptrend no longer holds. Work out your position size from the stop loss distance.
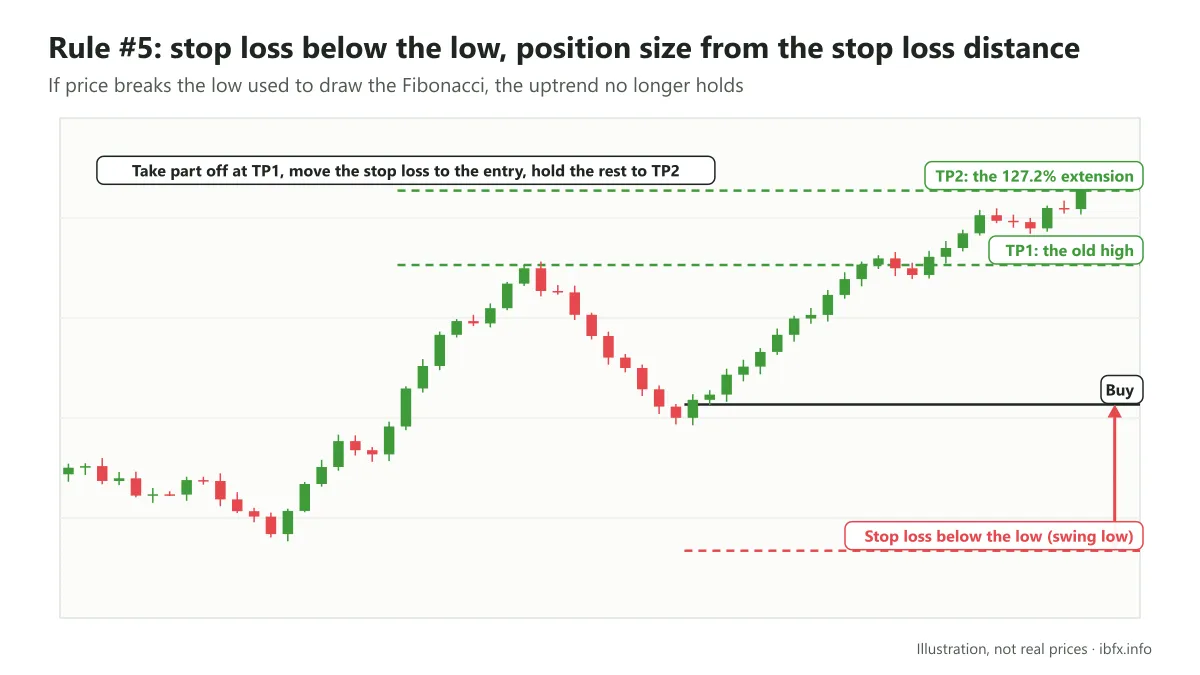
Rule #6: take profit around the old high (the swing high)
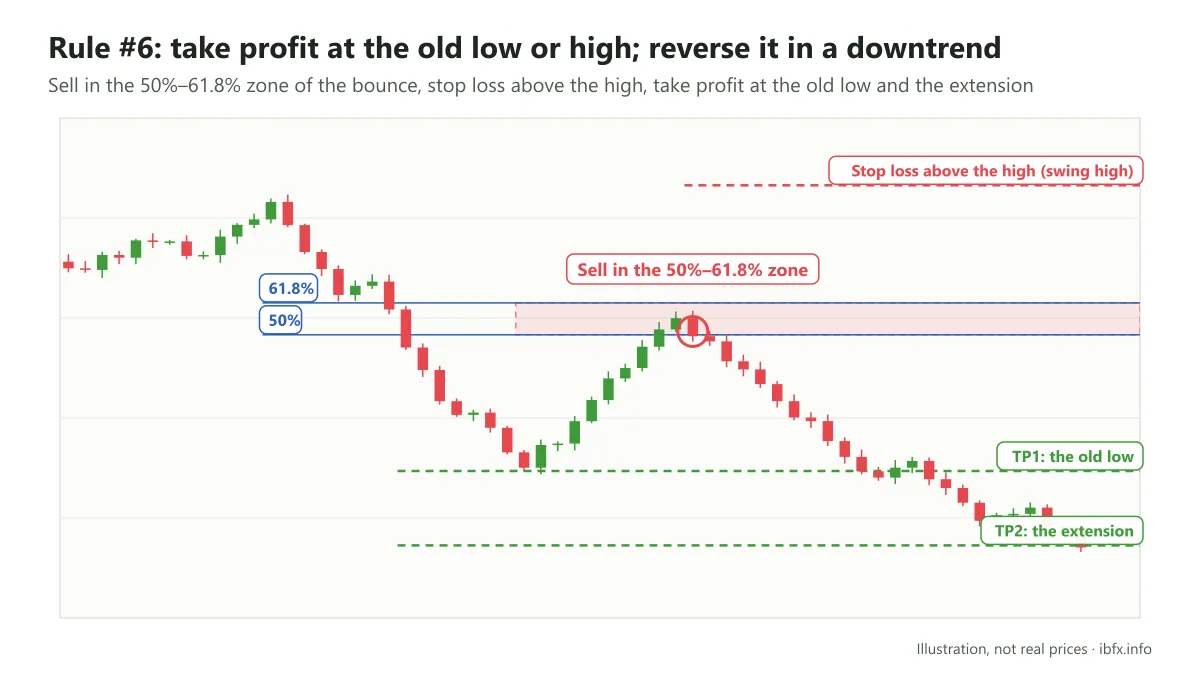
The old high (the swing high) is where price often meets resistance and may test it several times before getting through. So you can take profit here, or take profit on half the position, move the stop loss back to your entry and hold the rest if price breaks the high and goes on to make a higher high.
* Note: this is a guide to trading a pullback in an uptrend; in a downtrend you do the opposite. Practice on a demo account before you apply it with real money.