On this page
In the Ichimoku system, the Chikou Span (the lagging span) is usually used as a tool for confirming the trend. Some traders also use the crossing signal between the Chikou Span and the price line as a strategy of its own.
What is the Chikou Span?
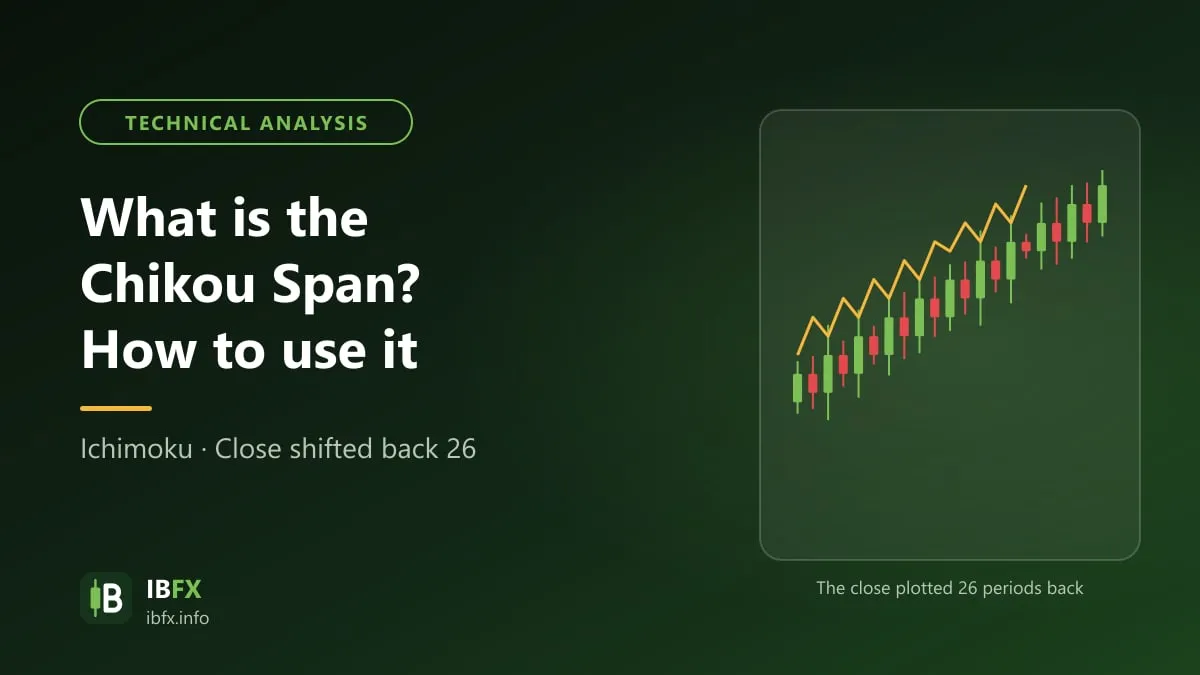
The Chikou Span is the closing price of the current candle drawn 26 sessions back. Thanks to that, just by looking at where the Chikou Span sits relative to the candles at that point in time, you know straight away whether the current price is above or below the price 26 sessions ago.
The Ichimoku indicator is well known for giving you almost a complete trading system, covering the trend, momentum, support and resistance. Even so, plenty of different strategies can be built out of only a few parts of Ichimoku, and the Chikou Span is one of them.
One difficulty in using the whole of Ichimoku is that you have to wait for several conditions to be met at once, which makes it easy to miss a strong trend that has already formed, and from there a trader easily ends up breaking his own rules. Using the Chikou Span simplifies the job of confirming the trend.
The Chikou Span has a number of properties: if the Chikou Span crosses the price line from below, price may rise, and if the Chikou Span crosses the price line from above, price may fall. Like the other parts of the Ichimoku system, the crossing signal between the Chikou Span and the price line is split into 3 grades, depending on where the current price sits relative to the Kumo cloud:
+ A strong signal: a bullish cross while the current price is above the cloud (Buy), or a bearish cross while the current price is below the cloud (Sell).
+ A medium signal: a bullish or a bearish cross while the current price is inside the cloud.
+ A weak signal: a bullish cross while the current price is below the cloud, or a bearish cross while the current price is above the cloud. This one goes against the trend, and a beginner should pass on it.
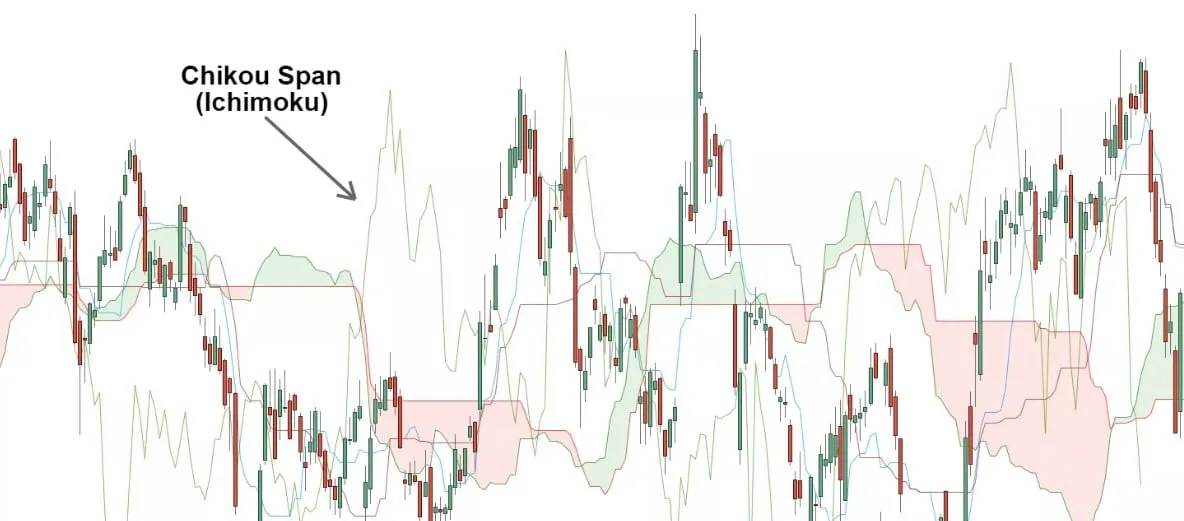
What the Ichimoku cloud is made up of
To understand the Chikou Span, understanding the Ichimoku cloud is the first step. Ichimoku has 5 lines, which can act as support and resistance, and the points where they cross can be treated as extra signals (the colors follow the settings used in the example, and you can change them as you like):
- The Tenkan-sen (the conversion line), in red: (highest price + lowest price) / 2 over 9 sessions, which matches the balance point over 9 sessions.
- The Kijun-sen (the base line), in blue: the same formula as the Tenkan-sen but worked out over 26 sessions, which matches the balance point over 26 sessions.
- Senkou Span A (leading span A): (Tenkan-sen + Kijun-sen) / 2, shifted 26 candles forward, forming one edge of the Kumo cloud.
- Senkou Span B (leading span B): (highest price + lowest price) / 2 over 52 sessions, also shifted 26 candles forward, forming the other edge of the Kumo cloud.
- The Chikou Span (the lagging span), in green: the current closing price shifted 26 sessions back, which lets you compare the current price with the price 26 sessions ago.
Trading with the Chikou Span
Trading with the Chikou Span is fairly simple, and goes in these steps:
- Read the context: look at where price sits relative to the Kumo cloud to tell whether the signal is a strong, a medium or a weak one, and look at a higher timeframe at the same time to find confirmation of the trend.
- Enter: open the trade when the Chikou Span crosses the price line in the same direction as the trend (favoring the strong signal), once the candle that produced the signal has closed.
- Place the stop loss: this strategy has no fixed stop loss rule, so place the stop loss beyond the most recent high or low, or on the far side of the Kijun-sen, and work out your position size from that distance.
- Exit: close the trade when the Chikou Span crosses the price line once more in the opposite direction, or when price reaches the target you set.
When the market moves sideways, the Chikou Span crosses back and forth over the price line constantly and produces a lot of noise, so you need to bring in where price sits relative to the cloud as well.
Besides that, the Ichimoku indicator is used to work out the trend: price moving above the cloud shows an uptrend, below the cloud shows a downtrend, and inside the cloud shows the market is going sideways or has no clear trend yet. The edges of the cloud are potential support and resistance zones too.
How to set the Ichimoku indicator up
To set Ichimoku up, open the MT4 software -> choose Insert -> choose Indicators -> choose Trend -> choose Ichimoku Kinko Hyo, as in the picture below.
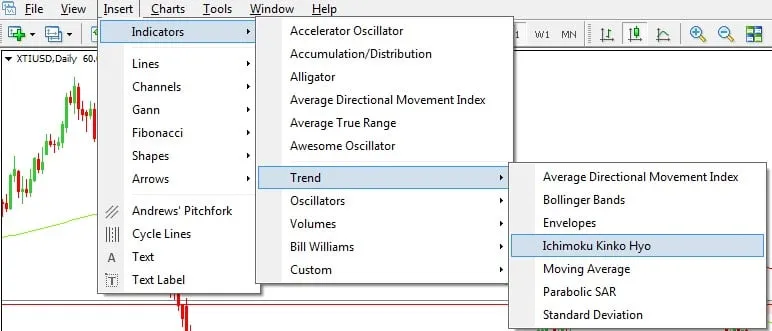
Setting the Ichimoku indicator up so that you can see the Chikou Span.
Now we set its parts up in detail:
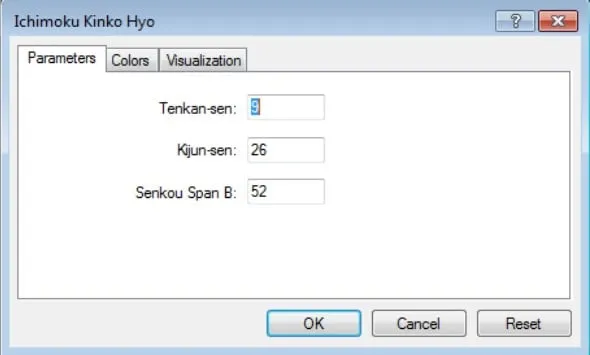
+ Parameters: there are 3 of them. First, the Tenkan-sen is 9 by default, meaning it is worked out from the last 9 candles (on the D1 time frame that is 9 days). Second, the Kijun-sen is 26 by default, worked out from the last 26 candles. Last, Senkou Span B is 52 by default, the midpoint between the highest and the lowest price of the last 52 candles.
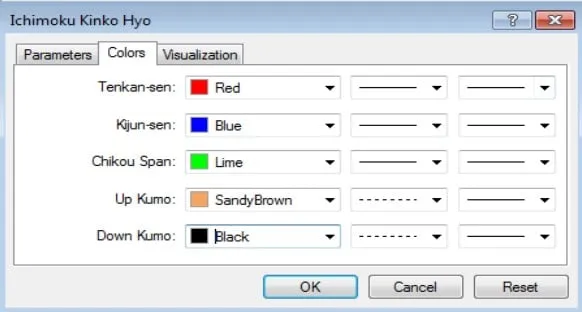
+ The Colors section: set the colors of the lines so that they are easy to read. In the example: the Tenkan-sen in Red; the Kijun-sen in Blue; the Chikou Span in Lime; the Up Kumo in SandyBrown; the Down Kumo in Black. All the lines are solid and thin, and the inside of the cloud is dashed.
+ The Visualization section: choose the time frames the indicator shows on, depending on which time frame you trade. Here we choose to show it on every time frame.
Finally, we get a complete Ichimoku indicator showing on MT4.
Conclusion
In forex trading, using only a few parts of the Ichimoku system lets a trader keep his own trading system simple. The Chikou Span, or the lagging span, is at bottom nothing more than the closing price shifted 26 periods back.
The logic of the Chikou Span is to compare the current price with the price 26 periods ago: when the Chikou line sits above the price of 26 periods ago, the market is taken to lean upward; when the Chikou line sits below it, the market is taken to lean downward. Bring in where price sits relative to the cloud, always place a stop loss, and practice on a demo account before you trade for real.