The Ichimoku cloud is a very popular method with many parts to it. Among them the Kijun-sen (the Kijun Line, the base line) is an important one, used by many traders to work out the trend, the moving support and resistance zones and the entry point. Even so, the Kijun-sen should be combined with the other parts in order to filter out noisy signals.
What is the Kijun-sen?
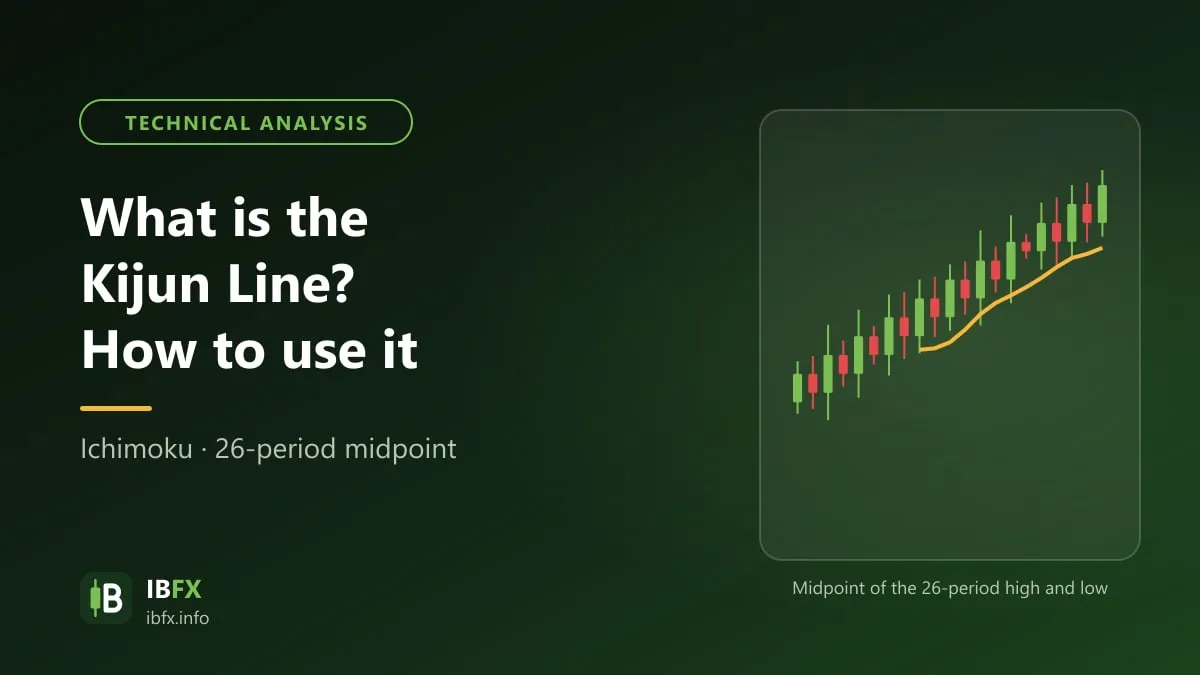
The Kijun-sen is one of the parts of the Ichimoku cloud, and its formula is: Kijun-sen (the base line) = (highest price + lowest price) / 2, worked out over 26 sessions.
Like the Tenkan-sen, the Kijun-sen is worked out from the midpoint between the highest and the lowest price, but over 26 sessions, so the Kijun-sen has properties similar to those of the Tenkan-sen.
Because it is worked out over a longer stretch of time, the signal the Kijun-sen gives is less noisy than the Tenkan-sen’s but slower. The Kijun-sen only changes when price makes a high above, or a low below, the range of the last 26 sessions (or when the old high or low drops out of those 26 sessions); otherwise the Kijun line runs flat.
The direction of the Kijun-sen reflects the medium-term trend, and the slope of the Kijun-sen tells you the strength of that trend. A flat Kijun-sen usually shows the market is accumulating. The moving support and resistance levels the Kijun-sen produces usually draw more attention from traders than those of the Tenkan-sen.
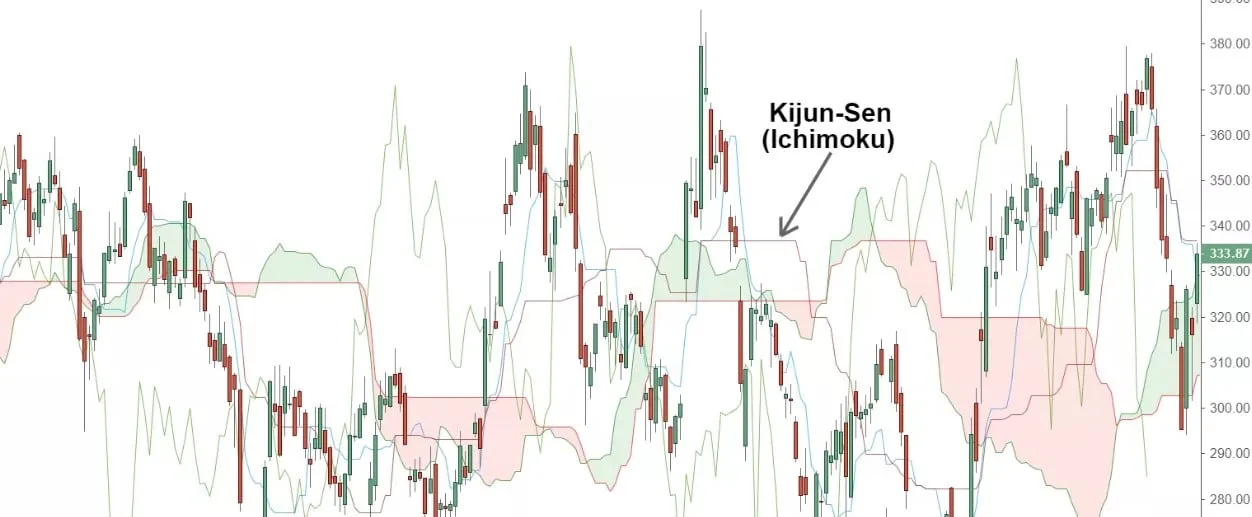
The Kijun-sen – an important part of the Ichimoku method.
To understand the Kijun Line thoroughly you need to understand the principle behind Ichimoku. Ichimoku has 5 lines, which can act as support and resistance, and the points where they cross can be treated as extra signals (the colors follow the settings used in the example, and you can change them as you like):
- The Tenkan-sen (the conversion line), in red: (highest price + lowest price) / 2 over 9 sessions, which matches the balance point over 9 sessions.
- The Kijun-sen (the base line), in blue: the same formula as the Tenkan-sen but worked out over 26 sessions, which matches the balance point over 26 sessions.
- Senkou Span A (leading span A): (Tenkan-sen + Kijun-sen) / 2, shifted 26 candles forward, forming one edge of the Kumo cloud.
- Senkou Span B (leading span B): (highest price + lowest price) / 2 over 52 sessions, also shifted 26 candles forward, forming the other edge of the Kumo cloud.
- The Chikou Span (the lagging span), in green: the current closing price shifted 26 sessions back, which lets you compare the current price with the price 26 sessions ago.
Trading with the Kijun-sen
When price moves too far and too fast over a short stretch of time, meaning the market is out of balance, price usually tends to come back toward the Kijun-sen. That is why the Kijun-sen is treated as the balance point that pulls price back.
Some common ways of using the Kijun-sen:
- Working out the bias: a close above the Kijun-sen leans upward, and a close below the Kijun-sen leans downward.
- The Tenkan/Kijun cross: the Tenkan-sen crossing above the Kijun-sen is a buy signal, and crossing below it is a sell signal; the signal is more reliable when it points the same way as the position of price relative to the cloud.
- A pullback to the Kijun: in a clear uptrend, wait for price to pull back toward the Kijun-sen and for a candle to confirm the bounce, and only then Buy; in a downtrend you do the opposite.
- The stop loss: place it on the far side of the Kijun-sen, or beyond the most recent high or low, and work out your position size from that distance.
When the Kijun-sen runs flat and price keeps crossing back and forth over it, the market is going sideways, the signals above are usually noisy, and it is better to stay out.
Besides that, the Ichimoku indicator is used to work out the trend: price above the cloud shows an uptrend, price below the cloud shows a downtrend, and price inside the cloud shows the market is going sideways or has no clear trend yet. In a downtrend, when price rallies, the two edges of the cloud are usually resistance zones; in an uptrend, the cloud acts as a support zone.
How to set the Ichimoku indicator up
To use the Kijun, the first thing you need to do is set Ichimoku up: open the MT4 software -> choose Insert -> choose Indicators -> choose Trend -> choose Ichimoku Kinko Hyo, as in the picture below.
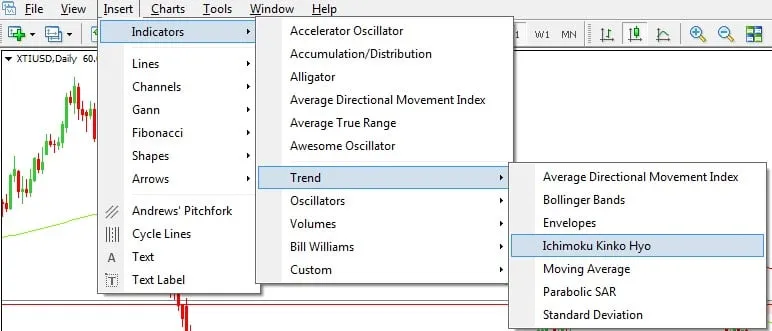
Setting the Ichimoku indicator up so that you can see the Kijun-sen.
Now we set its parts up in detail:
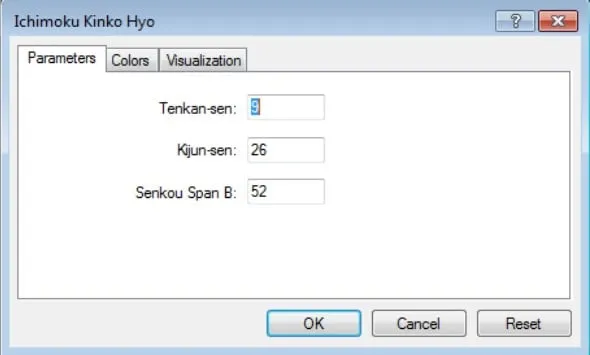
+ Parameters: there are 3 of them. First, the Tenkan-sen is 9 by default, meaning it is worked out from the last 9 candles (on the D1 time frame that is 9 days). Second, the Kijun-sen is 26 by default, worked out from the last 26 candles. Last, Senkou Span B is 52 by default, the midpoint between the highest and the lowest price of the last 52 candles.
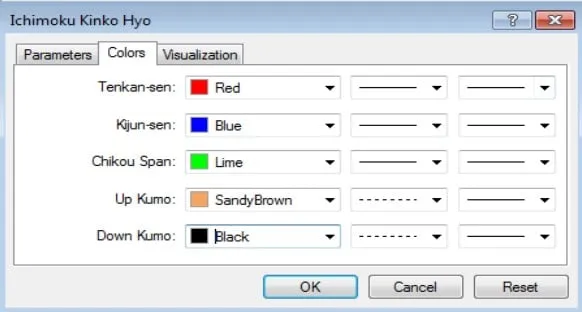
- The Colors section: set the colors of the lines so that they are easy to read. In the example: the Tenkan-sen in Red; the Kijun-sen in Blue; the Chikou Span in Lime; the Up Kumo in SandyBrown; the Down Kumo in Black. All the lines are solid and thin, and the inside of the cloud is dashed.
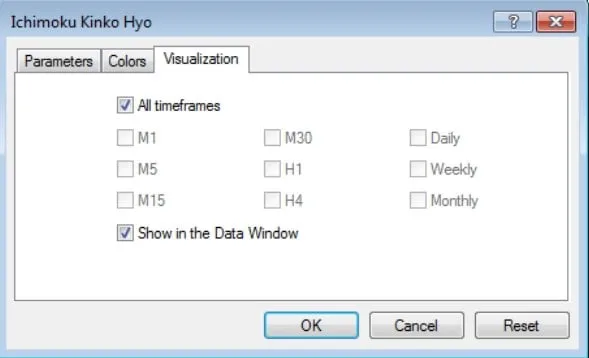
+ The Visualization section: choose the time frames the indicator shows on, depending on which time frame you trade. Here we choose to show it on every time frame, as in the picture below.
Finally, we get a complete Ichimoku indicator showing on MT4.
Understanding what the Kijun Line means is the first step toward studying the Ichimoku trading method; practice on a demo account before you apply it with real money.