On this page
If you already understand Dow theory, the trendline, support and resistance lines and a few reversal candlestick patterns, this is also the moment when you can take one more step and go and look into price patterns. Whether you follow the school that combines many indicators or the price action school, price patterns are a useful tool for spotting a possible reversal. Now we will look together at the head and shoulders pattern, one of the classics that many traders use, along with how to trade it.
Part 1: The head and shoulders pattern
What is the head and shoulders pattern?
John Murphy, the author of “Technical Analysis of the Financial Markets”, holds that (in substance):
Head and shoulders is perhaps the best known and most reliable of the major reversal patterns, and many other reversal patterns are only variations of it.
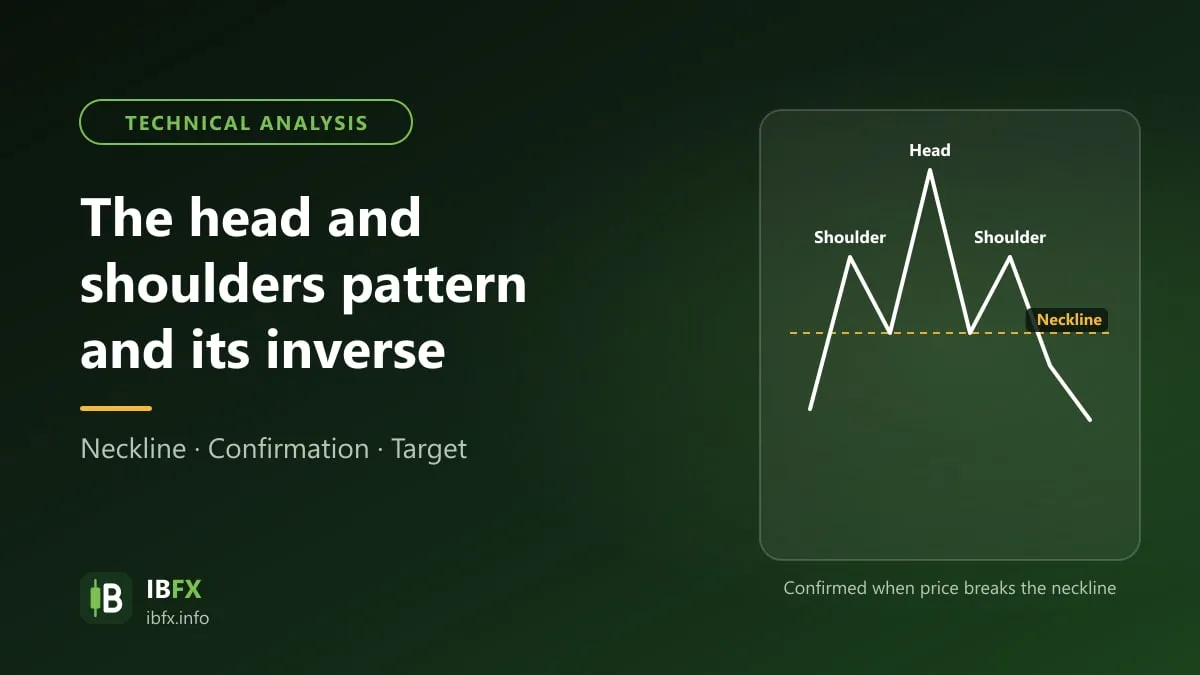
So the head and shoulders pattern is a reversal pattern that shows up at the end of an uptrend, formed by three highs one after another. Seen from a distance, they look just like the upper body of a person: a left shoulder, a head and a right shoulder.
The features of the head and shoulders pattern
From the definition above, the head and shoulders pattern has 3 main parts:
- The left shoulder
- The head
- The right shoulder
And because it looks like a human body, you can see that the 2nd high is the highest one, while the 2 highs on either side are usually of near equal height (they do not have to match exactly). But the left shoulder and the right shoulder must always be lower than the head.
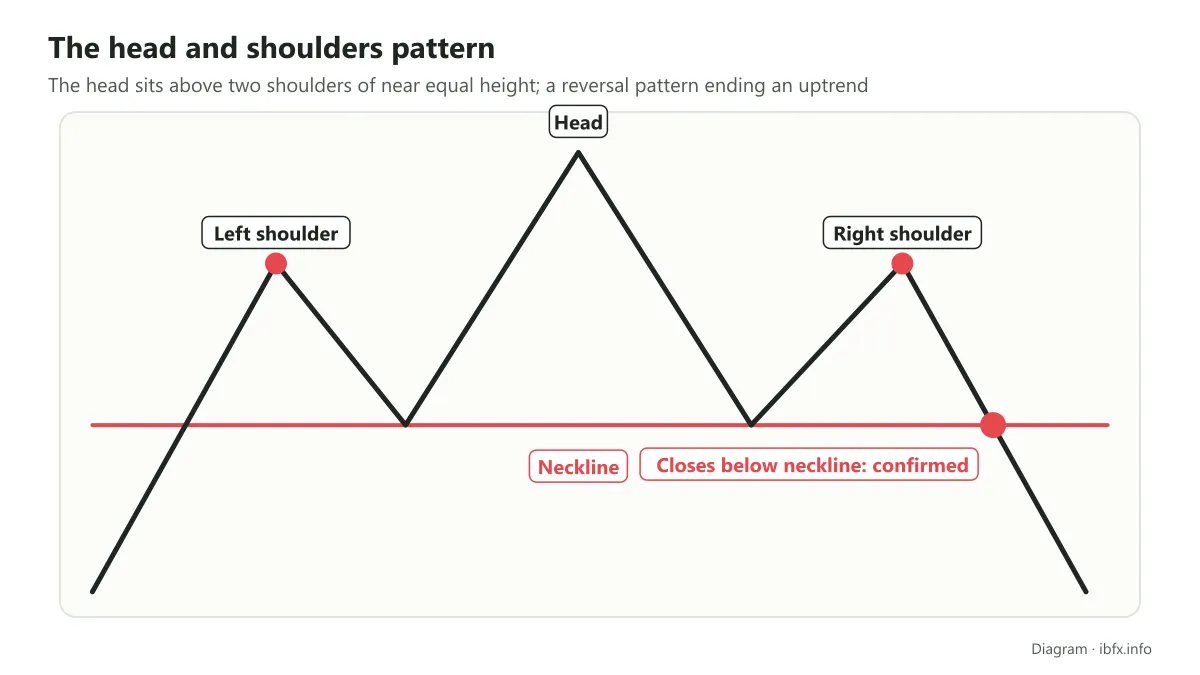
Besides the 3 main parts, for a head and shoulders to be complete it needs 2 further parts: a clear trend before it, and the neckline. The neckline is the line joining the 2 lows that sit between the left shoulder and the head, and between the head and the right shoulder. It is a very important part: the pattern is only treated as complete when price breaks this line.
Part 1: The uptrend (head and shoulders)
The first part of the head and shoulders pattern is an uptrend. This is the stretch before buyers run out of strength and price can no longer go higher. Without an uptrend before it, there is nothing to reverse.
Part 2: The left shoulder (head and shoulders pattern)
Price rises to make the left shoulder high, then falls and forms a higher low (HL). At this point things are starting to come together, but there is still not enough to fix the neckline.
Part 3: The head (head and shoulders pattern)
Now that the left shoulder has formed, price starts to make a higher high (HH) to build the head. But then price falls back near the previous low, and buyers fail to make a higher low.
At this point the left shoulder and the head have formed. The neckline is starting to appear too, but the right shoulder is still needed before a neckline can be drawn on the chart.
Part 4: The right shoulder (head and shoulders pattern)
The right shoulder forming is the moment that shows buyers are tiring and the market may be getting ready to start a reversal.
As soon as the right shoulder appears, we have enough data to start drawing the neckline. But because the pattern is not really complete, it is best to think of it only as a rough draft, not as the finished version for you to trade.
Part 5: The neckline (head and shoulders pattern)
By now a head and two shoulders have been fixed, so the neckline can be drawn. The pattern is only confirmed when price breaks the neckline; before that, price can still bounce up and the pattern can fail.
What makes a head and shoulders form?
From what is set out above, because price cannot be pushed on past the head high and instead goes down and only manages a lower high, you can see that buyers really are tired and worn out. That is the key that shows a reversal may take place.
That is why, right in the first section, I said that to settle on a head and shoulders, besides the neckline, there must be a clear trend in front of it. If the market before this pattern formed was not an uptrend, in the case of a head and shoulders, then understand that the pattern is simply not right, or does not work well. If you still take it for a head and shoulders, you need to bring in many other factors to know whether the market really is reversing down.
And you can see that the whole journey from the uptrend to the left shoulder, to the head, to the right shoulder and into a downtrend is the process we call the handover between buyers and sellers. From that we see that the market is always moving, that nothing is right 100% of the time and that nothing lasts forever. The pattern is in fact a mirror that shows how fickle the market is.
Even so, a trend reversal takes a certain long stretch of time to play out; it does not happen the moment you want it to. So base your decision on many factors, or wait until the head and shoulders has formed before you enter.
How to trade the head and shoulders pattern
As I said a moment ago, when price breaks the neckline, price may start to reverse.
So there are 2 ways to trade the head and shoulders. And this holds not only for the head and shoulders but for every other kind of pattern:
Case 1: Wait for price to break and for a candle to close below the neckline, then go ahead and place a Sell order for the head and shoulders pattern.
Case 2: Wait for price to retest the neckline; if price does not climb back above the neckline and keeps falling, enter a Sell. This way has extra confirmation, but price does not always come back for a retest.
In practice, many traders are impatient and enter as soon as they guess this is a head and shoulders, before price has broken the neckline. Whether you trade way 1 or way 2 is up to you, but either way you have to wait for price to break the neckline.
The second way is safer but can miss the chance if price does not retest. And if you pick way 1, think about taking a sensible profit or taking profit in parts, and do not set your hopes too high.
Now we will walk you through in detail how to trade the head and shoulders pattern along the 2 lines above, with the entry, the target and the stop loss set as sensibly as possible.
Trading the head and shoulders pattern
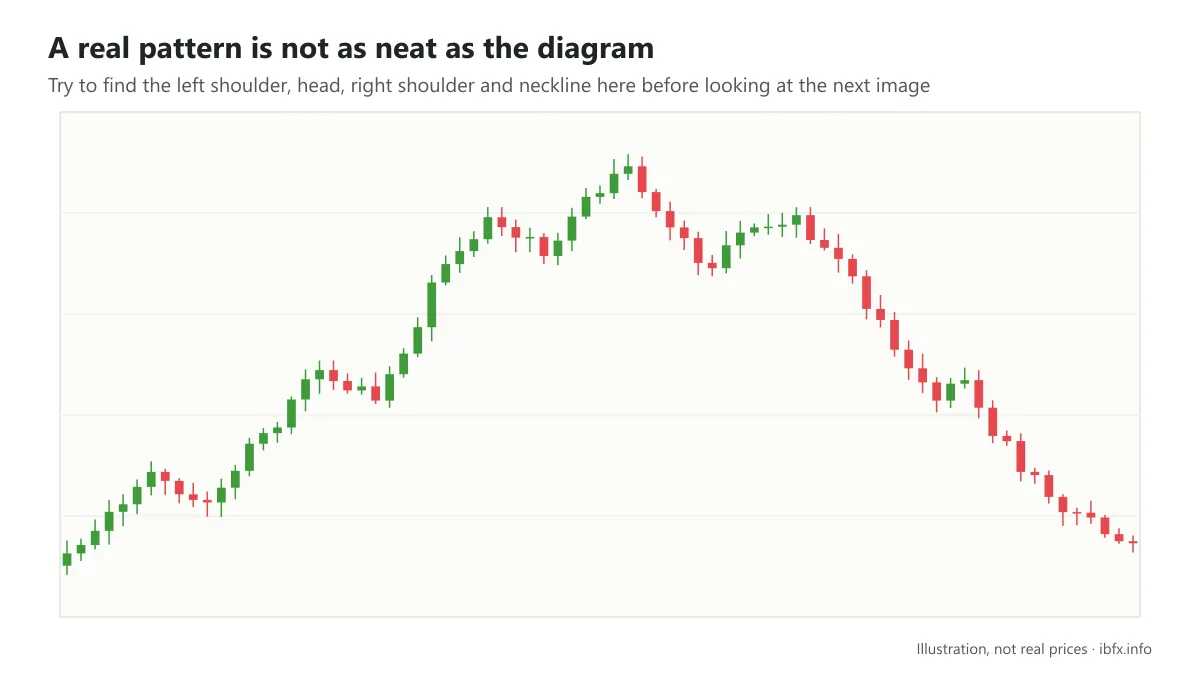
One thing to keep in mind is that not only the head and shoulders but every other pattern can never be as pretty as in a picture, like the drawing I walked you through a moment ago. The pattern you actually trade will be uglier, which means you have to practice and look at patterns often before you get used to them, as in the example I am about to show you, where you will see that life is not as lovely as a dream.
At an ordinary first glance you would not be able to picture this as a head and shoulders pattern, right? Now, though, I will draw it out for you.
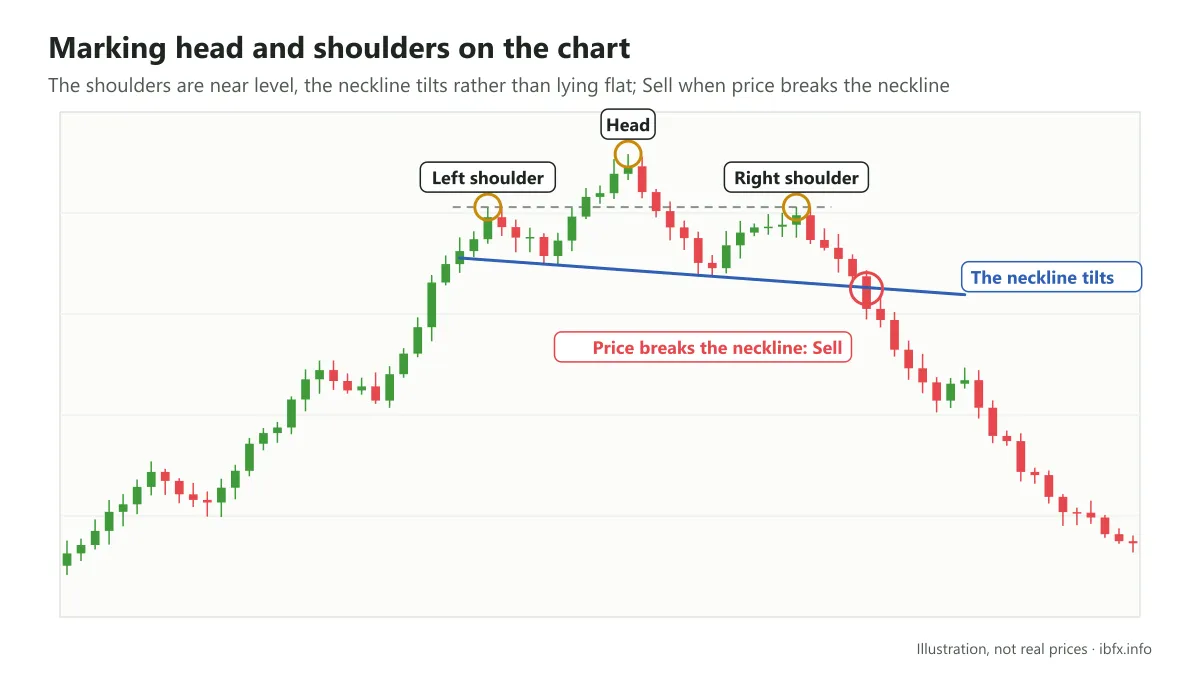
From the drawing you can see that the left shoulder high and the right shoulder high are level with each other, but the neckline is tilted rather than quite flat; when price breaks through the neckline, you enter a Sell.
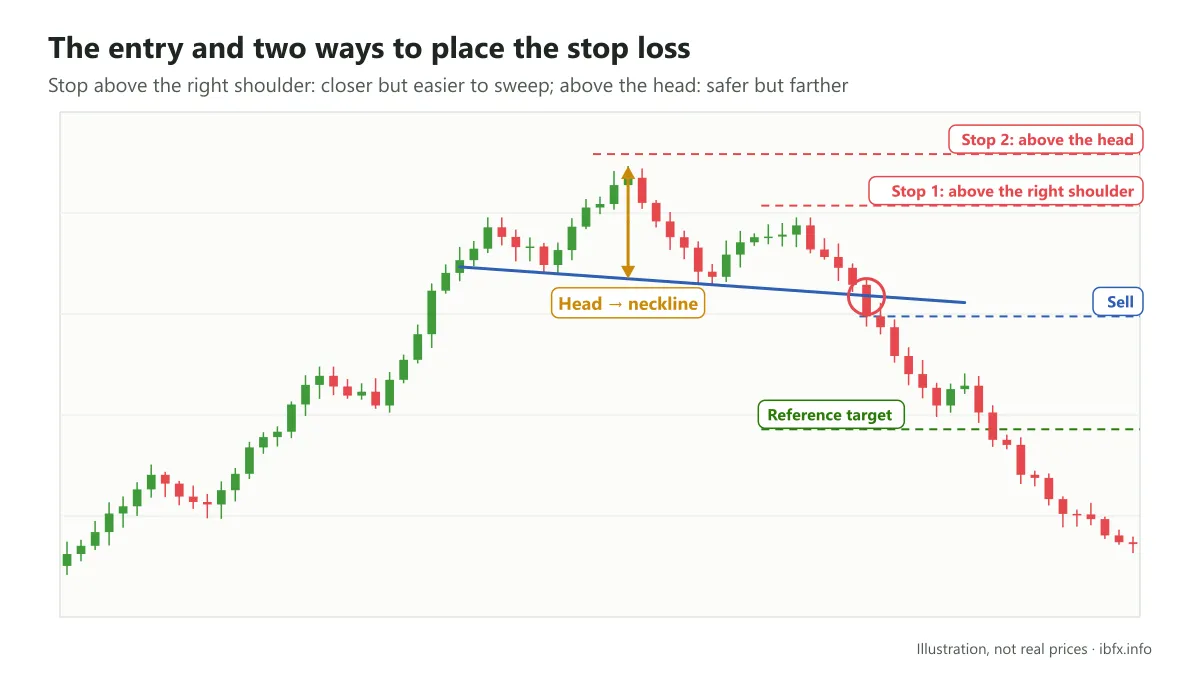
With the Sell placed right at the circle I drew, there are 2 ways to set the stop loss:
- Way 1: put the stop loss just above the right shoulder high: it is closer, so the risk-reward ratio is better, but it is easier to be swept.
- Way 2: put it just above the head high: safer, but the distance is greater.
Whichever way you choose, work out your position size from the distance to the stop loss, so that if you lose you only lose the small share of the account you decided on in advance.
And you can also see that although price did not retest the neckline, it still fell very hard.
So where do you put the target?
The common measured move for many price patterns: measure the distance from the head high down to the neckline, then subtract that same distance from the point where price broke the neckline to get a reference target. Measure on whichever timeframe you are trading. This is an estimated target; price may fall short of it or may travel further.
Trading the head and shoulders pattern when price retests the neckline
This way has one more confirmation step than way 1.
In the example below the head and shoulders formed quite nicely, because the left shoulder and the right shoulder are of equal height and after price broke the neckline it retested.
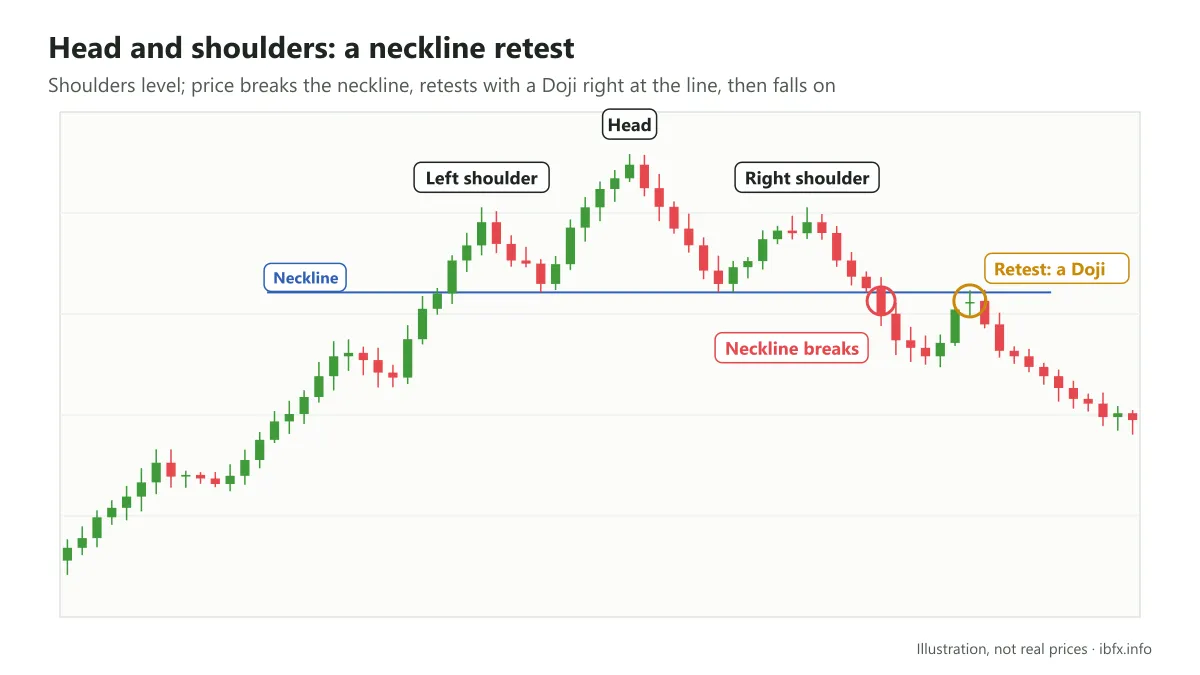
On top of that, right at the point where price struck back up at the neckline a Doji appeared, and after that price kept falling. And because this is the H4 timeframe, the target on H4 can never match the TP on the D or the W timeframe.
So even when price does retest, you cannot expect too much from the TP; once a sensible target is reached, you ought to take it.
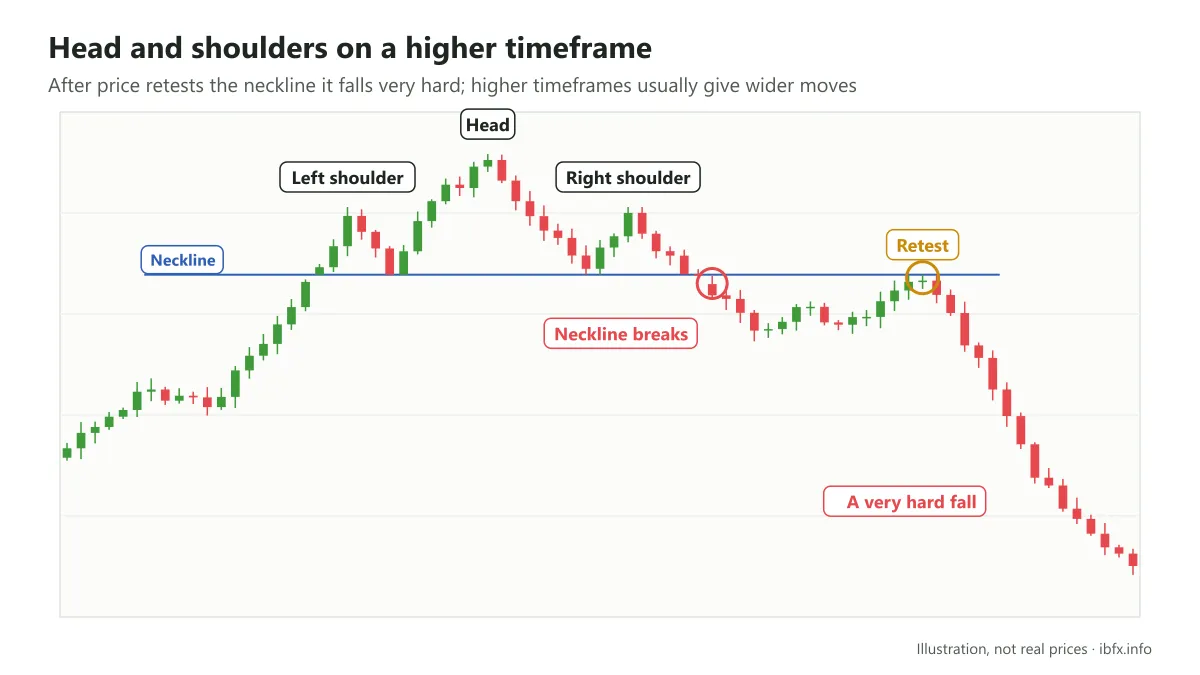
One more example: a head and shoulders pattern on a higher timeframe (the W timeframe).
After price retested the neckline it fell very hard. Because the pattern showed up on the W timeframe, a drop that wide afterwards is something that can happen.
As you can see, on a higher timeframe the wave is large and drawn out too; if you placed the Sell right at the first break of the neckline, it was almost 2 months later before it fell.
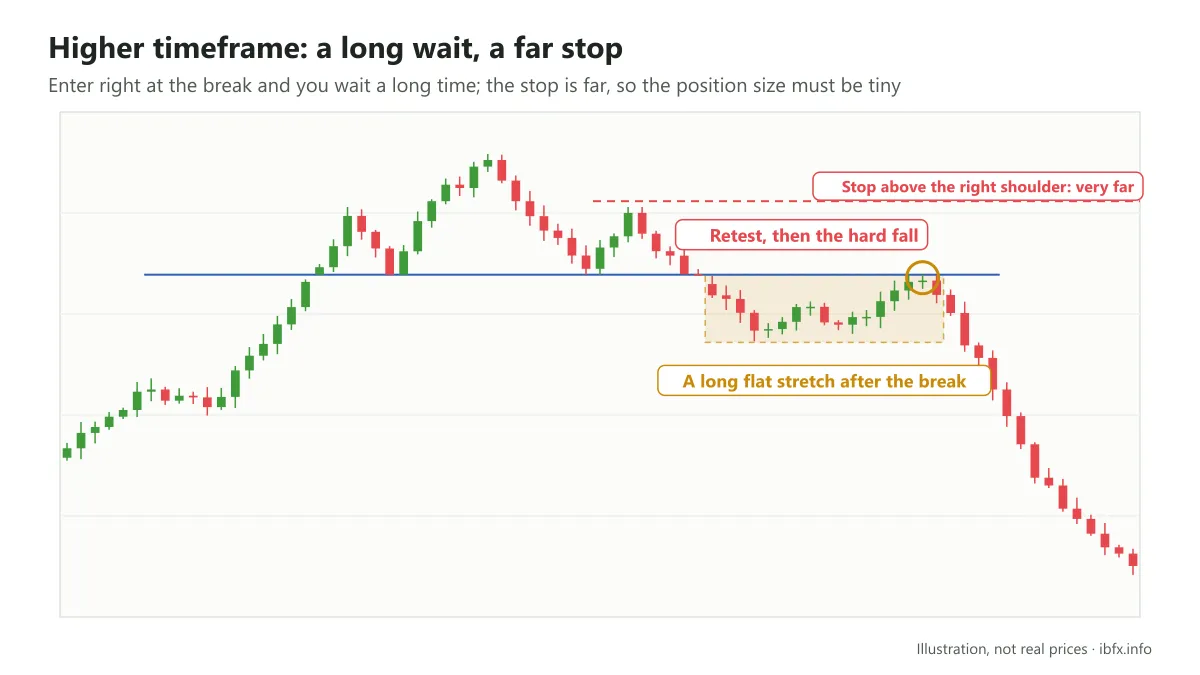
After that, it took another long stretch of time to retest back up to the neckline before it could fall as hard as it did. So when you trade on timeframes like W, the stop loss will be very far away and you have to use a very small position size; if you do not have enough patience and capital, you ought not to trade on a timeframe that large. Take profit according to the plan you set out.
The stop loss usually goes above the right shoulder (or above the head high if you want to be safer), as said above. And the general formula for the TP, as I mentioned, is to measure from the head high to the neckline; but here price fell very hard, so in a great many cases it lands outside what you expected, and how you want to take profit is then up to you.
So the crux of the matter when you trade the head and shoulders pattern is this:
- You have to identify the trend,
- Next, the left shoulder and the right shoulder ought to be equal or only a little out of line rather than far apart, and that way, once the pattern follows the script, the move the pattern points to becomes that much easier to happen.
Part II: The inverse head and shoulders pattern
What is the inverse head and shoulders pattern?
The inverse head and shoulders is a reversal pattern from down to up made of 3 lows, in which the middle low goes deeper than the other 2. If you already know the head and shoulders pattern, you will easily picture the features of the inverse head and shoulders.
In this pattern, as price makes 3 lows it also forms 2 highs above them. Joining those 2 highs gives us the neckline, a line that matters a great deal when you consider trading the pattern. We will go deeper into it in the sections that follow.
The features of the inverse head and shoulders pattern
Remember that the inverse head and shoulders shows up in a downtrend, because it is a reversal pattern from down to up, so it has the following 4 important parts:
- The left shoulder: the first low in the pattern, showing up after the downtrend.
- The head: the next low, going deeper than the left shoulder before it.
- The right shoulder: the third low of the pattern, sitting in a price area near that of the left shoulder. A right shoulder slightly higher than the left makes the pattern stronger, as the section below explains.
- The neckline: the line joining the 2 price highs above the pattern. You need to watch this line closely: depending on the case the neckline can be flat, point upward or point downward, and that will affect how we trade each situation.
Next, you need to understand that not every head and shoulders pattern, the inverse one included, is equally reliable. Some patterns can give a very strong reversal signal while others carry a lower chance of working out. So you need a grasp of the features that add to the strength of the pattern, which are:
- There is a clear downtrend before the pattern forms.
- A neckline pointing upward is usually treated as a stronger signal than the other 2 cases (flat or pointing downward).
- The right shoulder (the third low) sitting higher than the left shoulder (the first low) shows that sellers have weakened, which adds to the strength of the pattern.
The psychology behind the inverse head and shoulders pattern
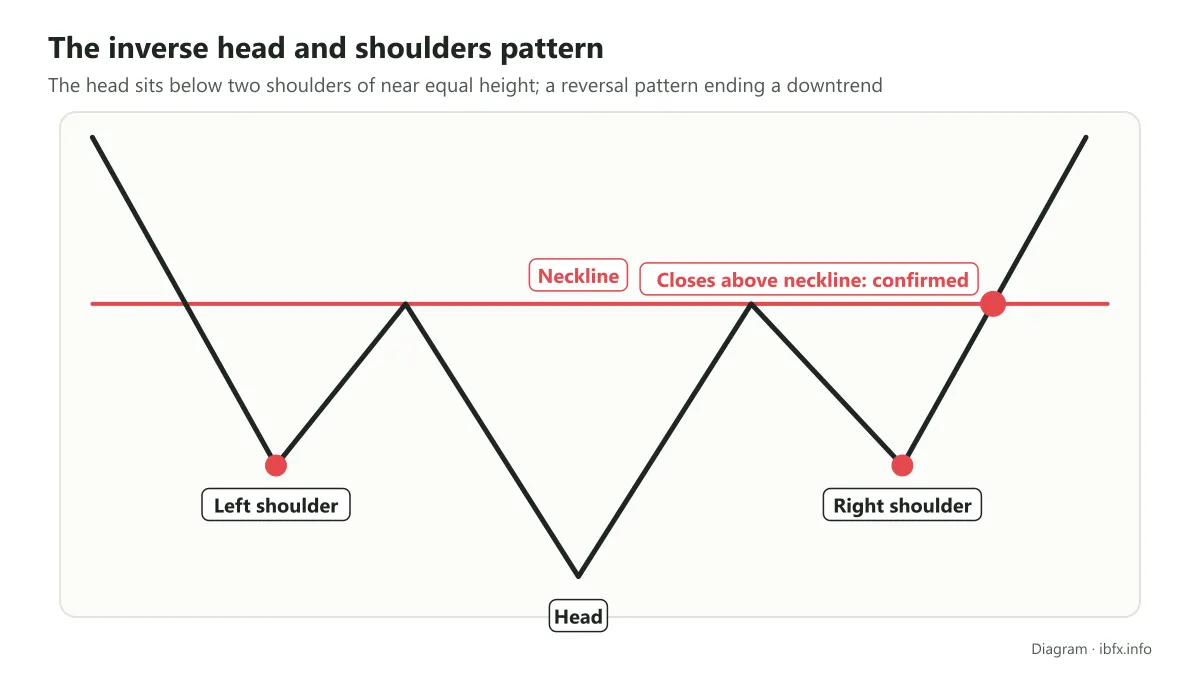
The left shoulder low and the head of the pattern show the strength of the downtrend, with the market making 2 lower lows one after the other. Price bouncing up after the left shoulder forms is only ordinary price behavior in a downtrend. So at this point sellers are still in charge and a bearish mood covers the market.
What stands out, though, comes when price rises to make a second high and then falls to make one more low (the right shoulder), but this time the market cannot make a low under the one before it, which shows the downtrend has started to weaken and buyers have gradually regained their strength. As you know, a downtrend is defined as price action made of lower highs and lower lows. So if the neckline points upward, meaning the second high is above the high before it while the right shoulder is above the left shoulder, the strength of the pattern goes up, because these moves confirm that the earlier downtrend has ended and the market is ready to reverse. If buyers are strong enough to push price up past the 2 earlier highs, an optimistic mood will return to the market and will push price higher still.
How to trade the inverse head and shoulders pattern
There are 2 things to keep in mind: the left shoulder and the right shoulder are usually near level with each other, and the neckline is not always flat but can slope up or slope down.
With the inverse head and shoulders, a down-sloping neckline usually gives a less reliable signal than a flat or an up-sloping one. In those cases, if you still enter, you ought to set a cautious target and always have a stop loss (usually below the right shoulder low).
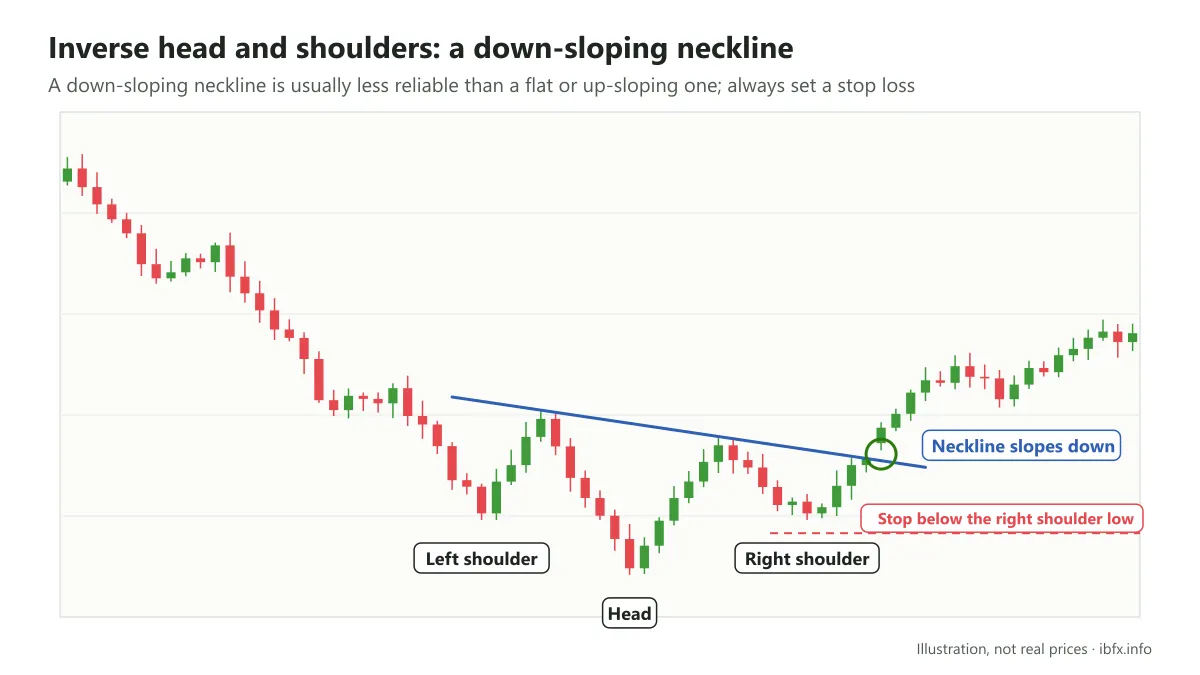
In the next example you can see that the trend before it was an extremely strong one, the inverse head and shoulders formed as in the image, and the neckline is a sloping line.
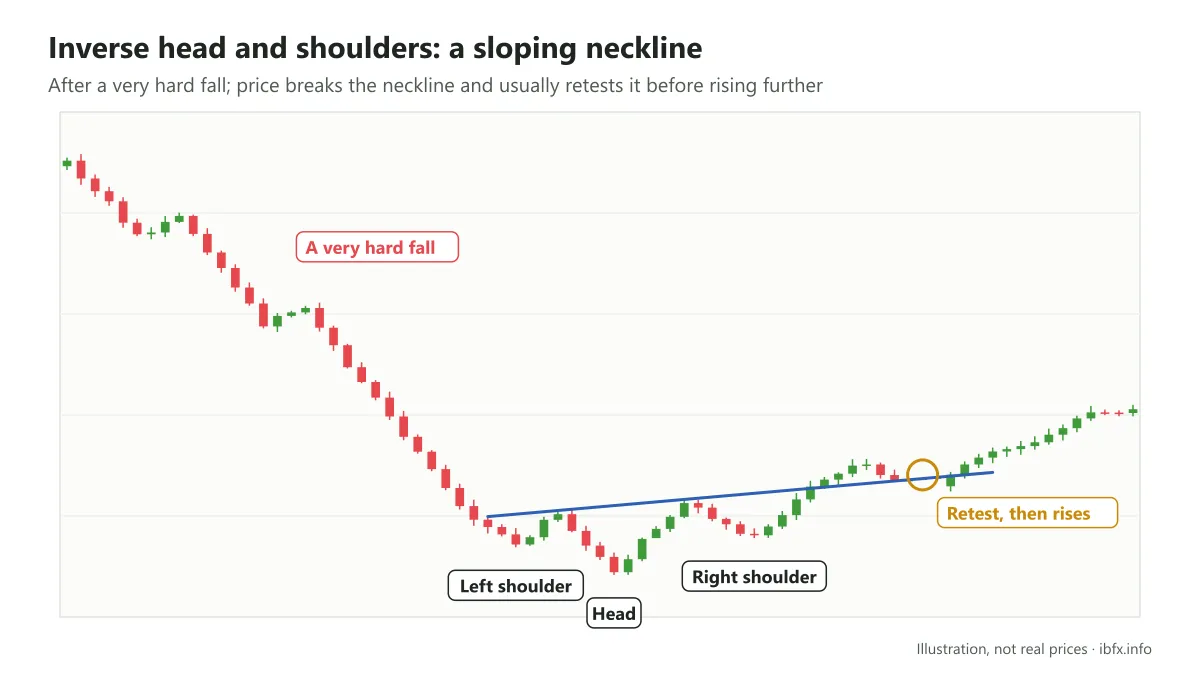
In a great many cases, after price breaks the neckline it will retest it before carrying on with a strong rise. So it is up to you. Many traders rely on the head and shoulders pattern, but there are still times when the pattern fails, so in every case you must place a stop loss.
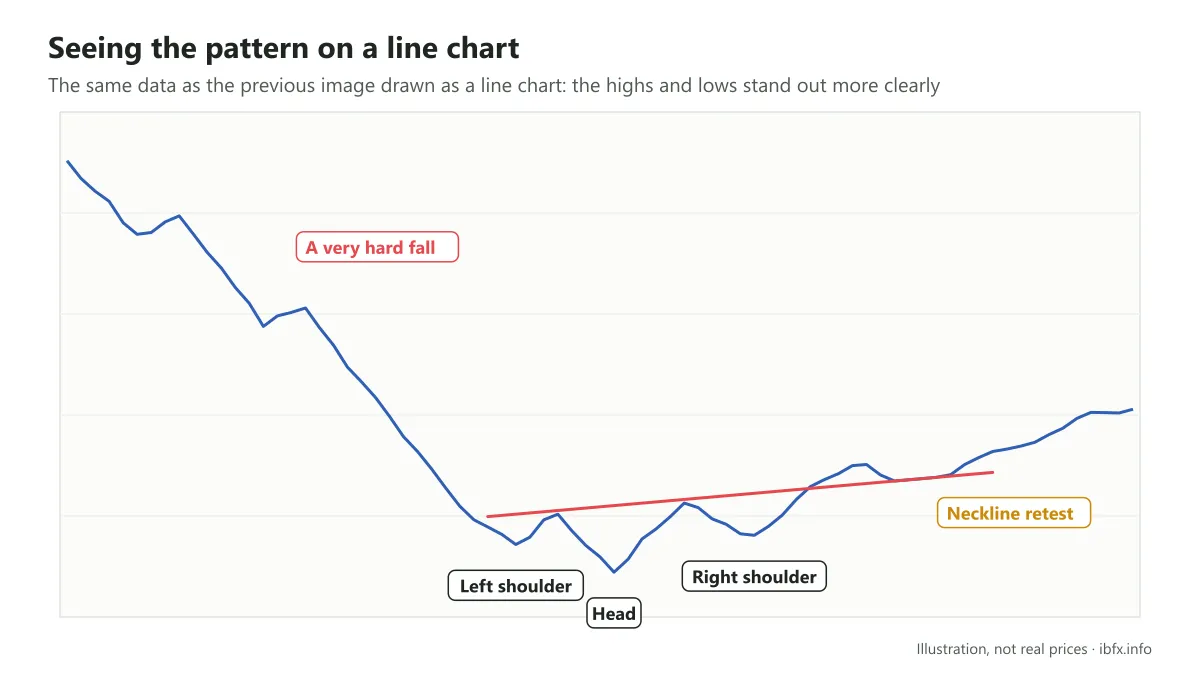
If you are a trader new to the job, you can switch to a line chart, which can help you see these shapes more easily than the candlestick pattern I walked you through above.
Some questions about the head and shoulders pattern
Is the head and shoulders a reversal pattern or a continuation pattern?
Both kinds, the head and shoulders and the inverse head and shoulders, are reversal patterns.
Must there be a clear trend before the pattern forms?
Yes. Because it is a reversal pattern, the head and shoulders needs a clear uptrend before it, while the inverse head and shoulders needs a clear downtrend before it.
Should you trade the moment price breaks the neckline?
It is best to wait for a candle to close on the other side of the neckline before you enter, to avoid a false breakout. More cautious still is to wait for price to pull back to the neckline before entering, at the cost of possibly missing the chance. If you enter the moment price has just crossed the neckline in order to get a better price, the risk of a false breakout is higher, and you must always have a stop loss.
See also similar reversal patterns: the double top and double bottom, and the triple top and triple bottom.