On this page
- What support and resistance are
- How support differs from resistance
- What forms support and resistance levels?
- How to identify support and resistance zones
- How to identify a resistance zone worth trading
- How do you trade support and resistance well?
- A few points about support and resistance you need to remember
Support and resistance is probably one of the most basic pieces of knowledge any trader needs when they start trading forex.
The thing worth saying is that most new traders do not understand how important it is, so they usually skim over it.
That is why, even after trading forex for a while, they still cannot identify support and resistance levels correctly or find the zones worth trading. The article below not only explains support and resistance carefully but also answers all of the questions above. Let us go through resistance and support together.
What support and resistance are
Support and resistance are horizontal levels, zones or thresholds that connect the highs of price or the lows of price.
Support and resistance form when the market price reverses and changes direction to make the next high or low.
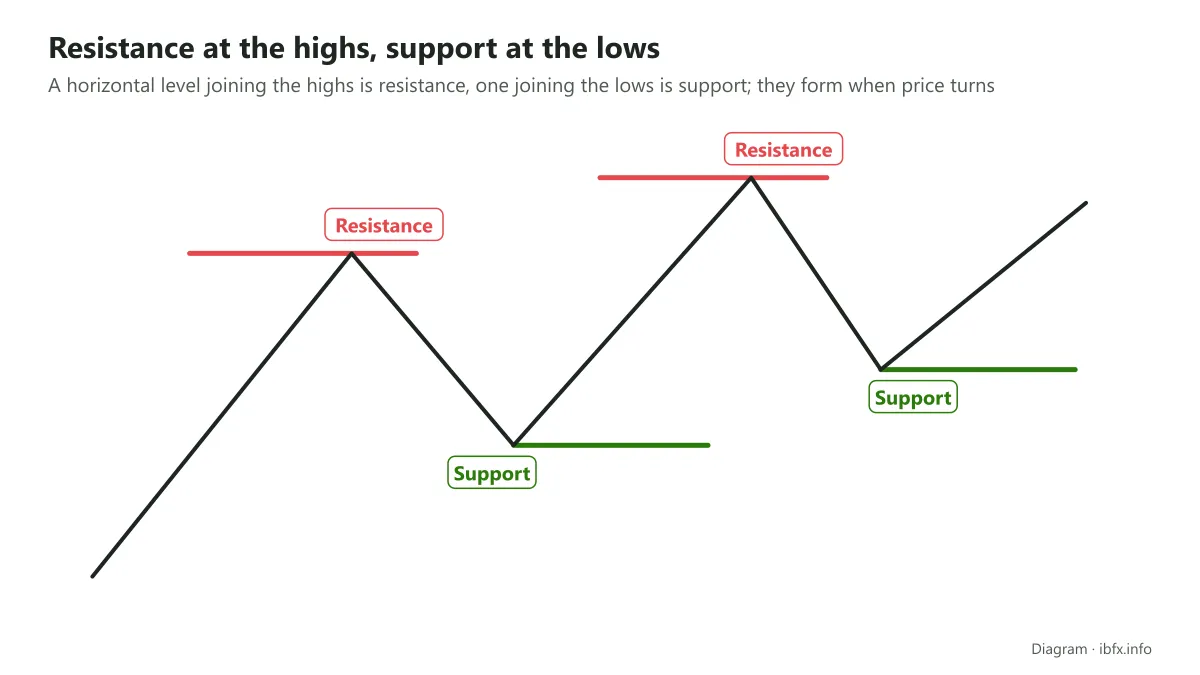
Resistance and support levels can repeat many times, from the past into the future.
A support zone and a resistance zone are where the interests of the 2 sides fight it out, like a tug of war: whichever side is stronger wins, so this is the area that shows the state of mind of the traders taking part in the market.
How support differs from resistance
To keep it simple, support is the lows and resistance is the highs.
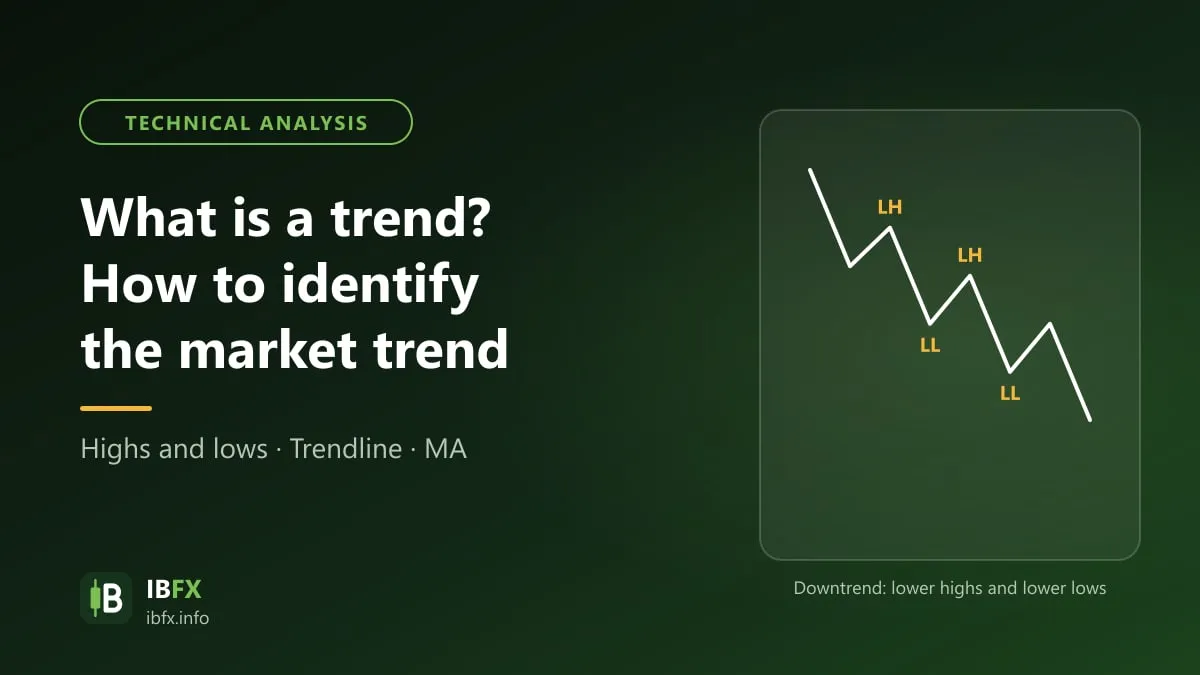
Price moves as a series of highs and lows, and their direction helps a trader identify the market trend.
An uptrend builds support and resistance levels that step upward, while a downtrend builds support and resistance levels that step downward.
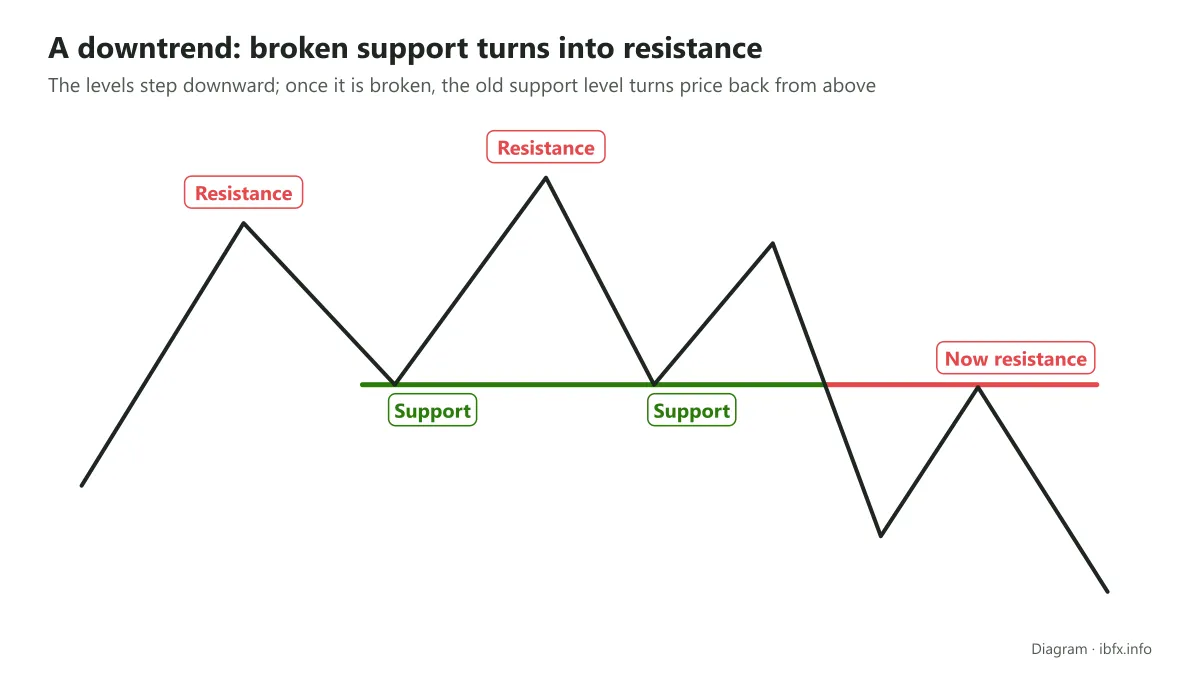
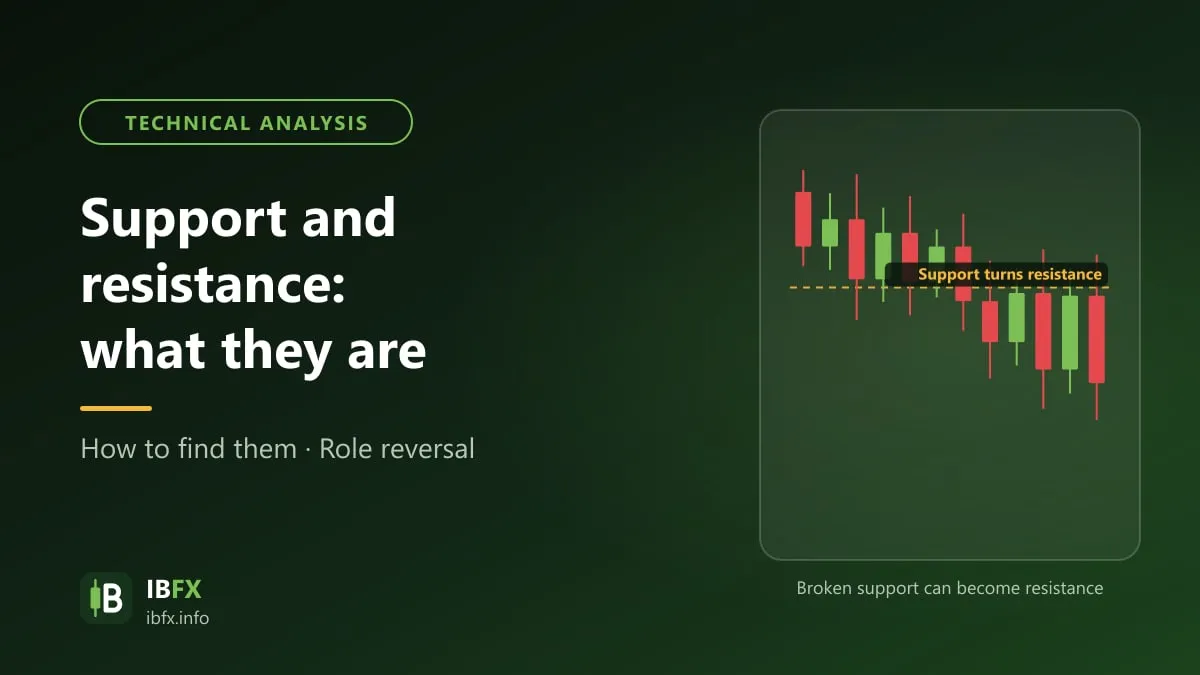
Note: if a support or resistance level is broken, support turns into resistance and, the other way round, resistance turns into support.
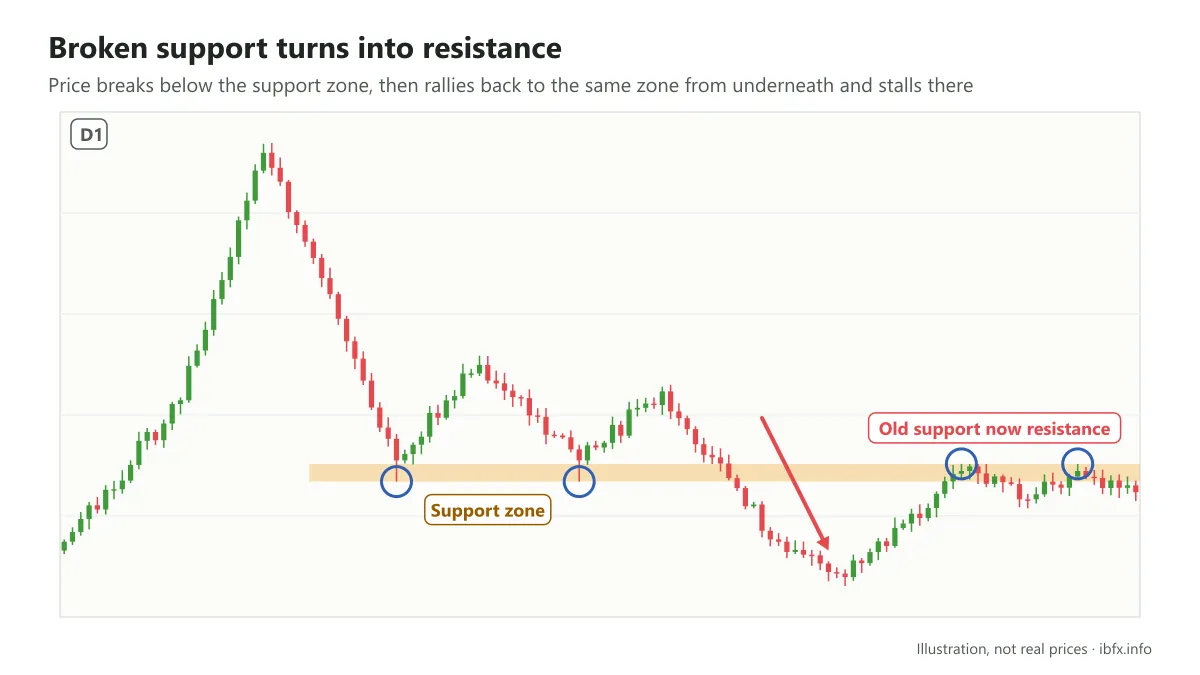
The support zone in the example above was broken and support turned into resistance: price rallied back and touched this same zone from underneath, and the fight between the two sides played out right there.
What do you use resistance and support for?
- As markers of trading psychology
- Getting out of a position quickly
- Setting an entry point
- Setting a stop loss point
What forms support and resistance levels?
Market psychology and the habit of regretting the past are the 2 main factors that build support and resistance levels. For this part you can read John Murphy’s book Technical Analysis of the Financial Markets to understand more.
Basically there are 3 main groups taking part in the market: buyers, sellers and the people standing outside.
Suppose gold is at 1,852 and you become one of the traders who buy gold at that price.
Luck is on your side, and gold shoots straight up to 1,890 USD/ounce. So gold has risen 380 pips, and if you bought 1 lot you have made 3,800 USD.
With gold, by the common convention, 1 USD is 10 pips (it depends on the broker). You can read the article below to understand more:
(This example is only there to illustrate market psychology. 1 lot of gold is a very large position size: if price goes against you by 38 USD, you lose 3,800 USD just the same.)
You will happily show your account off to the whole world, and plenty of people will be impressed and sorry they did not buy, or wonder how on earth they meant to buy and then did not.
You yourself (part of the game, on the buying side), after getting gold at such a good price and seeing gold rise exactly as you expected, may feel a pang of regret: why did I only take 1 lot, it should have been 10 lots.
Then the people standing outside the game: those who watched gold and thought it would rise but did nothing quietly regret it and wish they had bought a little; others breathe out in relief that they did not Sell, or are sorry they did not Buy…
The last group: the sellers, watching gold race up like that, break into a cold sweat, because they are on the wrong side and keep praying for gold to fall so they do not blow up an account, or they have been stopped out and now want to switch to buying gold to win back the money they lost.
All of these groups may wait for price to fall so they can take a new position, while many others are not patient enough and buy straight away. If they all come into the market at the same time when price drops back near that support level (here, opening a Buy), though, that will push price up.
Price falling back to support zones, with traders then jumping in to buy, counts as additional buying.
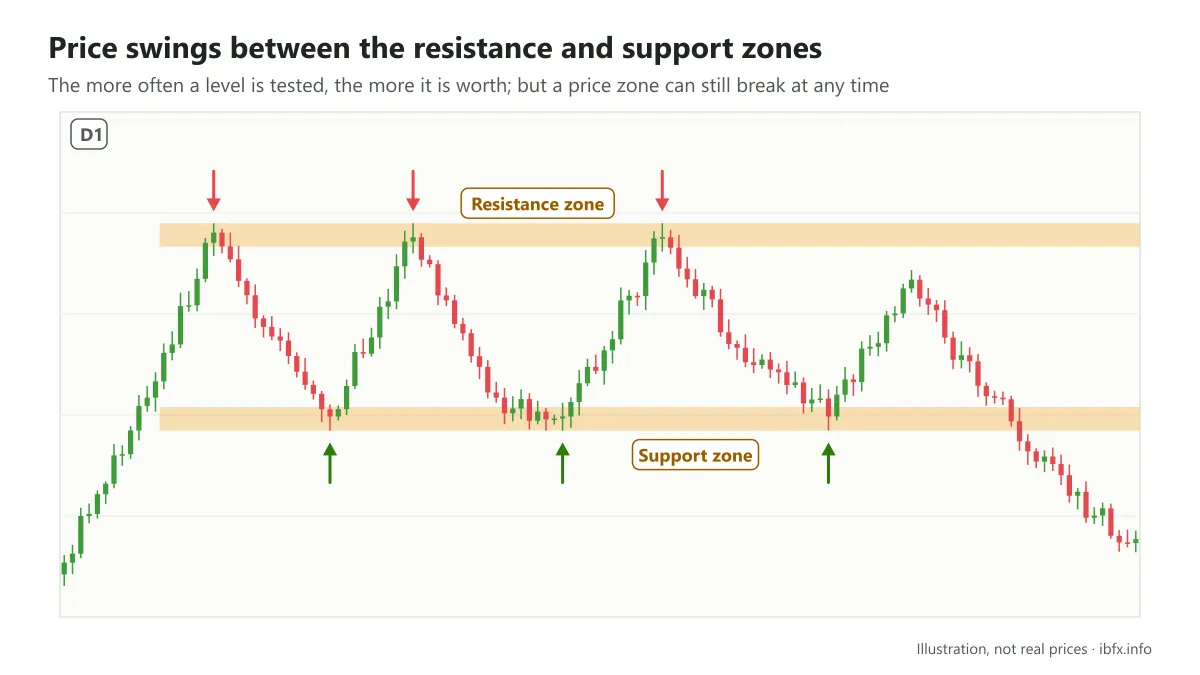
The same goes for a resistance level, so the more people take part at this area, or the more times this level is tested, the more support and resistance levels are worth.
Beyond psychology, one point worth making is that price is decided by supply and demand.
When a price zone forms, it is an agreement between buyers and sellers: buyers think 1,852 USD/ounce is a reasonable price to buy at, and sellers also think 1,852 USD/ounce is a reasonable price to sell at. When both sides agree that 1,852 USD/ounce is the bottom, they stop price being pushed any lower, and that is how what we call support forms. From that mark, hundreds and thousands of people take part, and once the 1,852 level has formed they push price higher still, here to 1,890.
By now the latecomers regret the 1,852 price in the past and wait for price to come back so they can buy in again. And if the agreement between buyers and sellers here still holds that 1,852 really is a reasonable level, price can be pushed higher again from there. The other way round, though, if selling takes over and price breaks below 1,852, the people who bought around 1,852 and are in a loss will want to sell to break even when price comes back up to this zone. That selling means 1,852 is no longer a support zone but turns into resistance.
How to identify support and resistance zones
So, first of all, to identify resistance and support correctly you have to remember 1 thing:
The trend of a currency pair in the foreign exchange market is decided by supply and demand. On top of that, the market has too many influences and is sometimes deliberately clouded with noise, so price often stops at random levels. And a great many people treat particular price levels as important, so it is at those particular levels that the highs and the lows form.
Note, though, that support and resistance are made out of thresholds, which means price zones that showed up in the past and are now being repeated, not one particular price.
So a support level is usually marked out from earlier lows (or from an old high that price has broken above), while a resistance level is marked out from earlier highs (or from an old low that price has broken below).
If you are a new trader and want to make this simpler when you look for the highs or the lows, use a line chart instead of a Japanese candlestick chart.
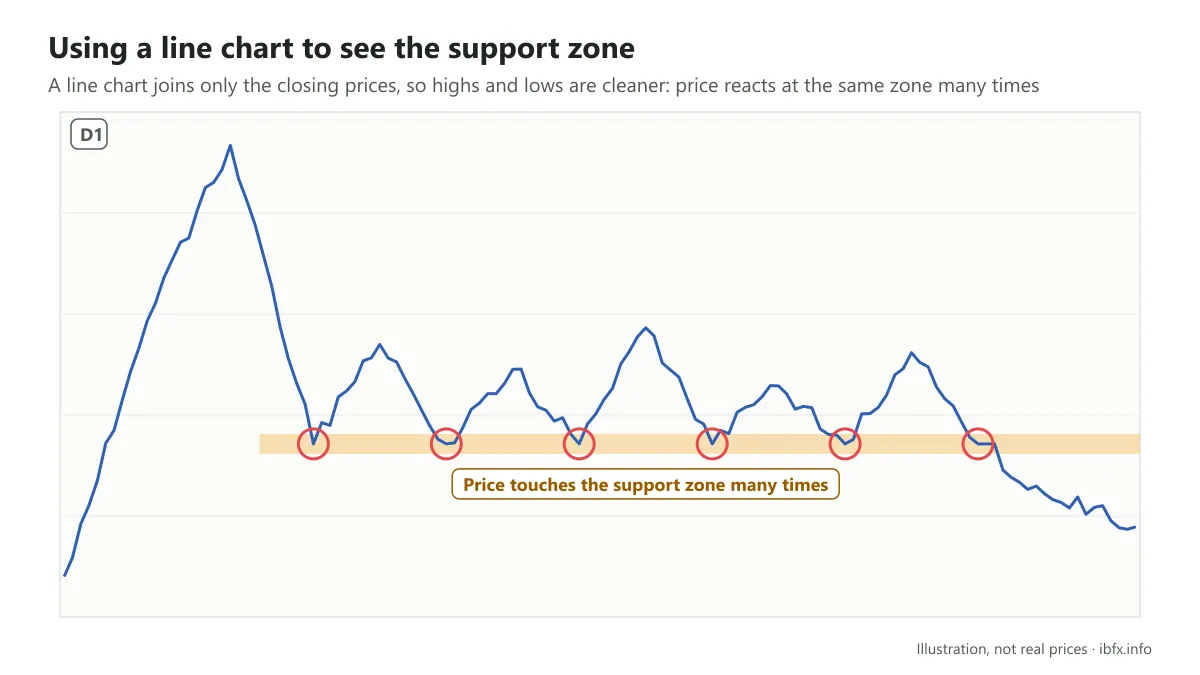
Price reacted at this zone many times, did it not? On the Daily time frame price hit this support level many times before it broke down.
Besides using a line chart, you can use the Japanese candlestick chart straight away, once your eye is used to marking them out as follows:
- A resistance zone: find the area of a high that showed up earlier, which is the price range from the close or the open to the highest point of the wick. Because it is a price range, people call it a zone or a threshold.
- A support zone: in the same way, it is the price range at a low, from the close or the open to the lowest point of the wick.
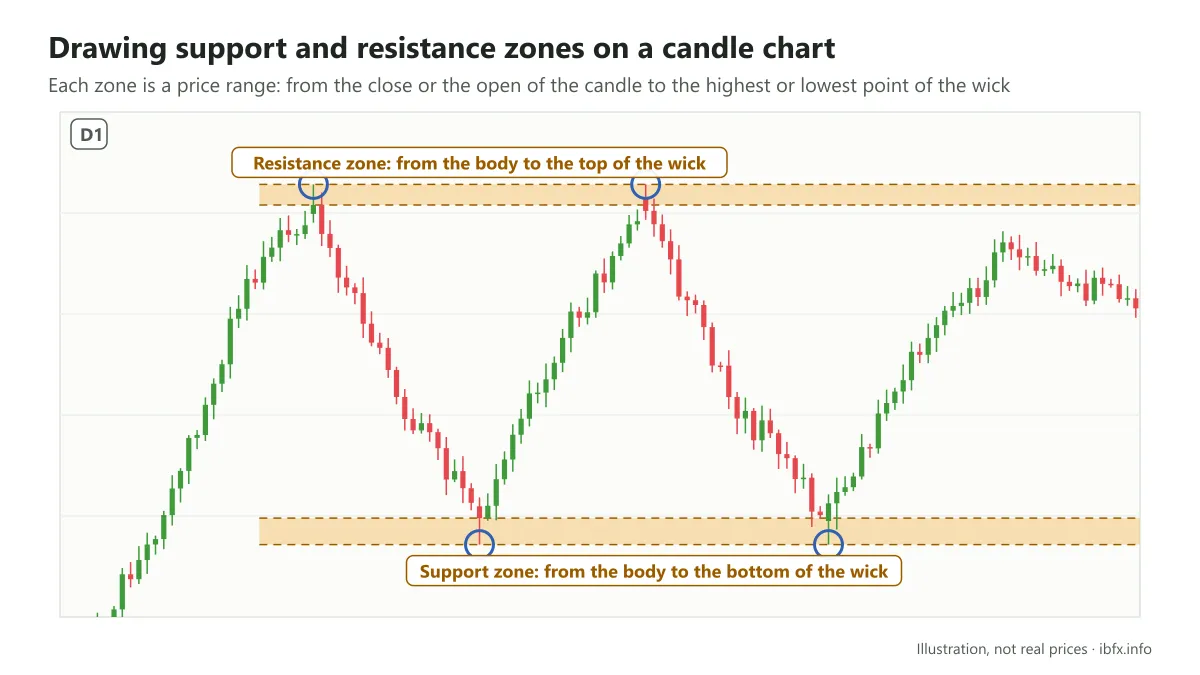
Out of countless support and resistance zones, which ones are worth watching?
Looking for support and resistance zones is a bit like liking someone: it makes you curious to find out more about them. So how do you turn detective?
You would certainly ask people close to them, or anyone who knows them, or find a way to strike up a conversation with your crush and then ask about the past, all so you gather more data and can judge the way they act and the things that happen to them.
The market is the same: because history keeps repeating itself, the data from the past are all important markers that people use to work out what may happen in the future.
That is why many experienced traders can work out that gold will rise to this level or that one (they can of course use other methods as well, such as measuring Fibonacci, using the barriers made by EMA lines, or pivot points, or Elliott waves).
And out of all the people you meet in life, you do not have a crush on every one of them. There is plenty of support and resistance on a price chart, but not every support or resistance zone is one worth trading.
How to identify a resistance zone worth trading
- Look for the support or resistance zone closest to price at the moment you are trading
- The more times a price level is tested, or the zone is touched again and again, the more the zone is worth trading
- The longer support and resistance levels take to form, the more that level means
The higher the time frame a level forms on, the more that support and resistance is worth: support and resistance on M5, M15 or M30, for example, gets broken often, or is weaker, than support and resistance made on H4, D1 or W1. Why say that? Because if that support or resistance zone forms on a higher time frame, it means it has formed many times, or been touched many times, on the lower time frame.
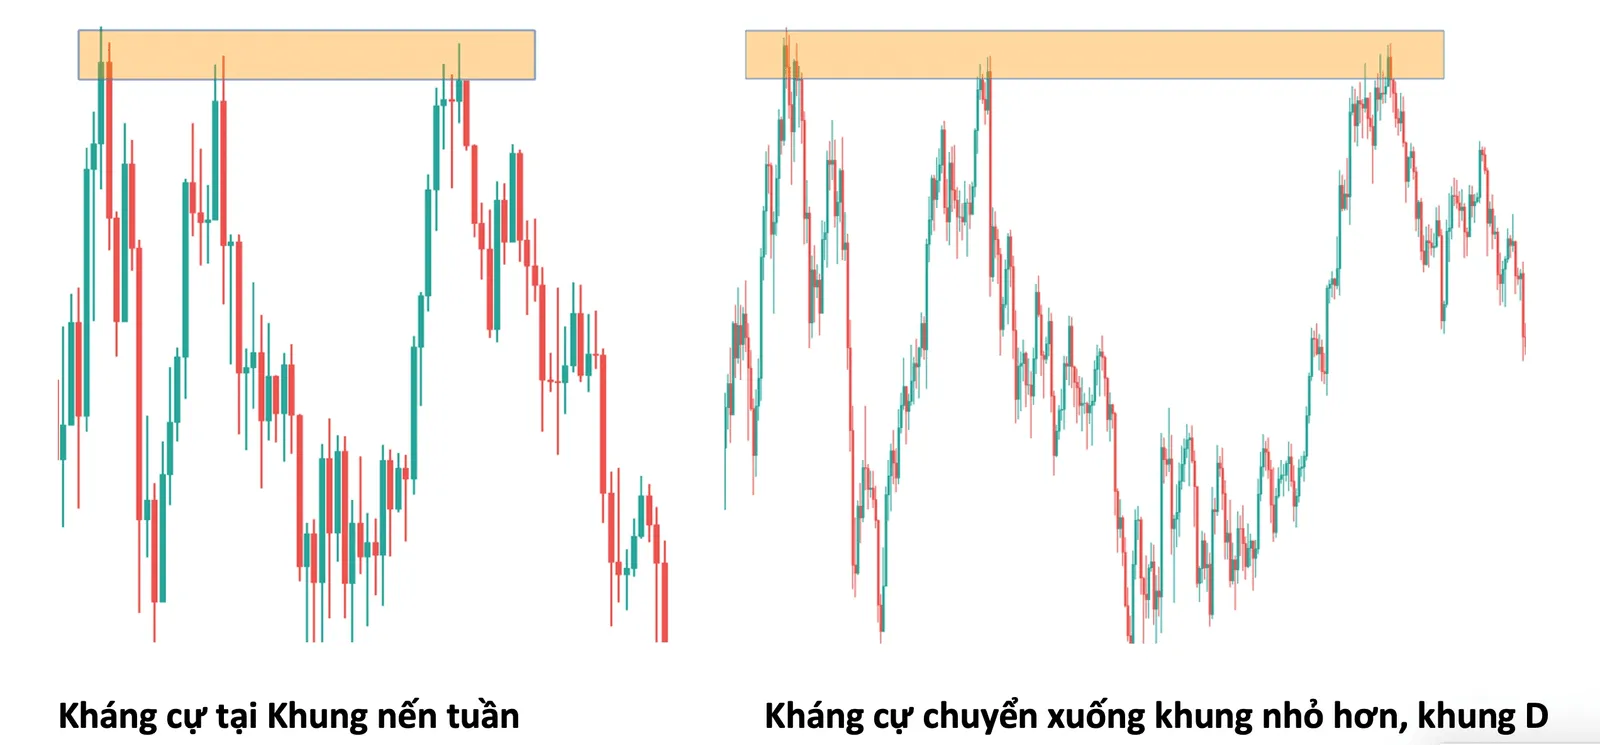
The screenshot shows the Vietnamese interface; the buttons and labels sit in the same places in the English version.
On the same chart across 2 different time frames you can see that gold touched the 1,790 zone many times on the Weekly candles. Switching to the Daily chart makes this even clearer: price kept rising to the 1,790 zone and then falling, as you can see on the Daily time frame at each following touch.
What does that tell us? Clearly that PRICE, or THE MARKET, HAS A MEMORY TOO, or that history tends to repeat itself.
That is why the support and resistance zones that really matter are where you consider taking profit or looking for an entry.
I will say it once more: if you are not used to it yet, use a line chart to spot support and resistance zones, which is easier than the Japanese candlestick chart.
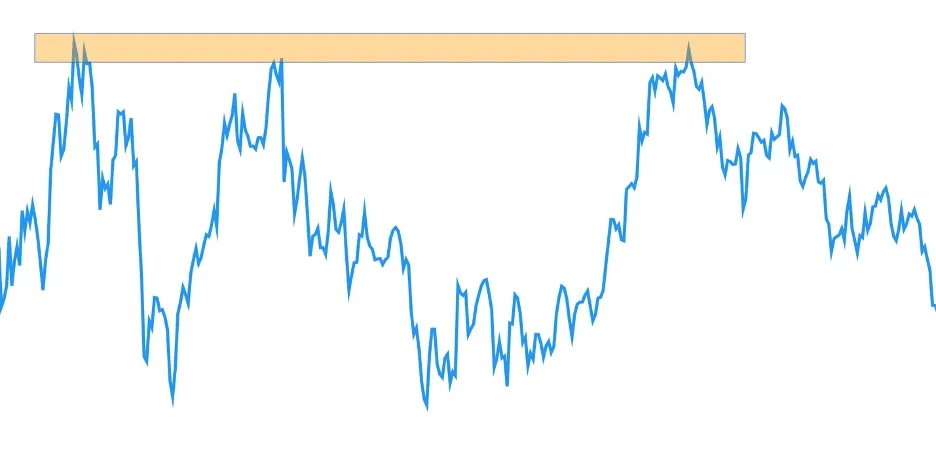
Still gold on the Daily time frame, but it is easier to read on a line chart than on a Japanese candlestick chart.
How do you trade support and resistance well?
The first thing is to identify the resistance zones worth trading, as I said above.
On top of that, your trading has to follow the flow of the market, which means you MUST identify the trend correctly.
For example, if the long-term trend is up, you can wait for price to react at strong support zones and buy; if price is in a downtrend, you can wait for price to reach resistance zones and sell.
There are also a few other ways to trade resistance and support:
Placing orders at support and resistance zones
This is the most basic way, used by a great many traders, and the classic line for it is buy at support and sell at resistance.
But as said above, not every support or resistance zone is a place for you to trade, so rushing into a trade the moment you see support or resistance very easily ends badly.
Look at the example below to understand more:
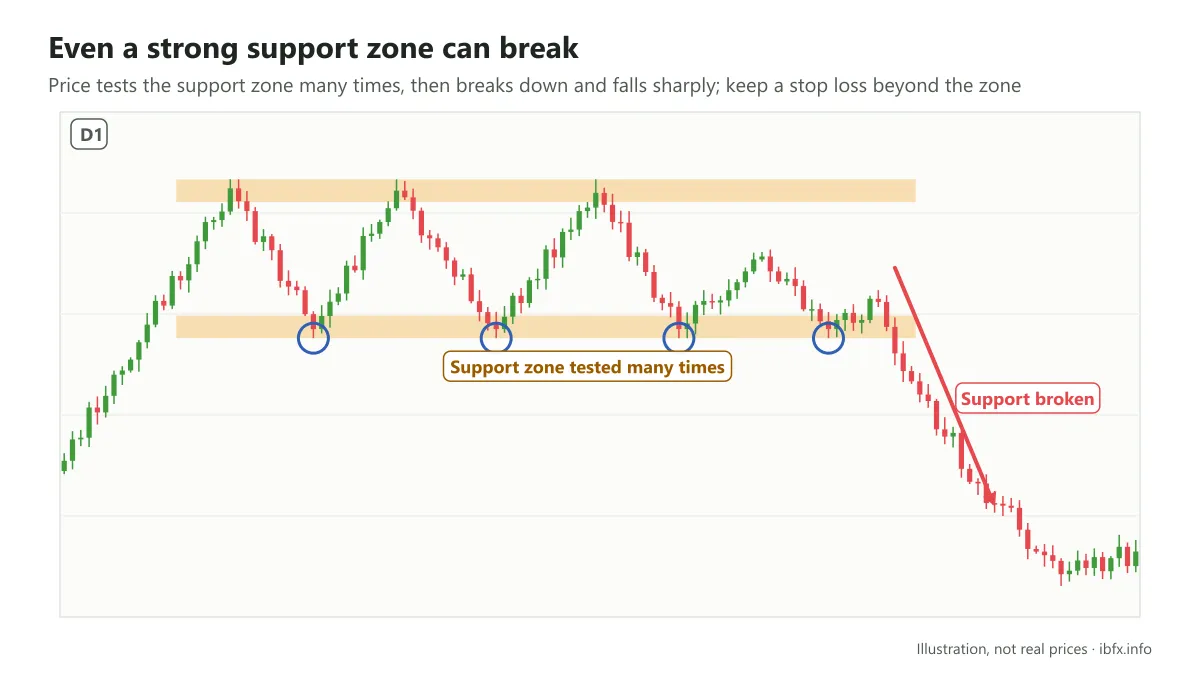
Clearly, price formed an extremely strong support zone on the Daily time frame, tested again and again, but in the end it did not hold: it was broken and price fell sharply.
That is why, to raise your odds of winning on a trade, it is best to combine it with some indicators or other reversal candlestick patterns.
Combine some other tools with support and resistance: reversal candlestick patterns, a breakout signal from a trendline, indicators such as RSI or MACD that give divergence or convergence signals…
This method is usually more reliable than the first one, because the signals above give extra confirmation of price action. If reversal candles show up at support and resistance zones, that is a situation worth considering for an entry, and it also lets you put the stop loss closer (just outside the reversal candle).
Look at the example below to see how it works:
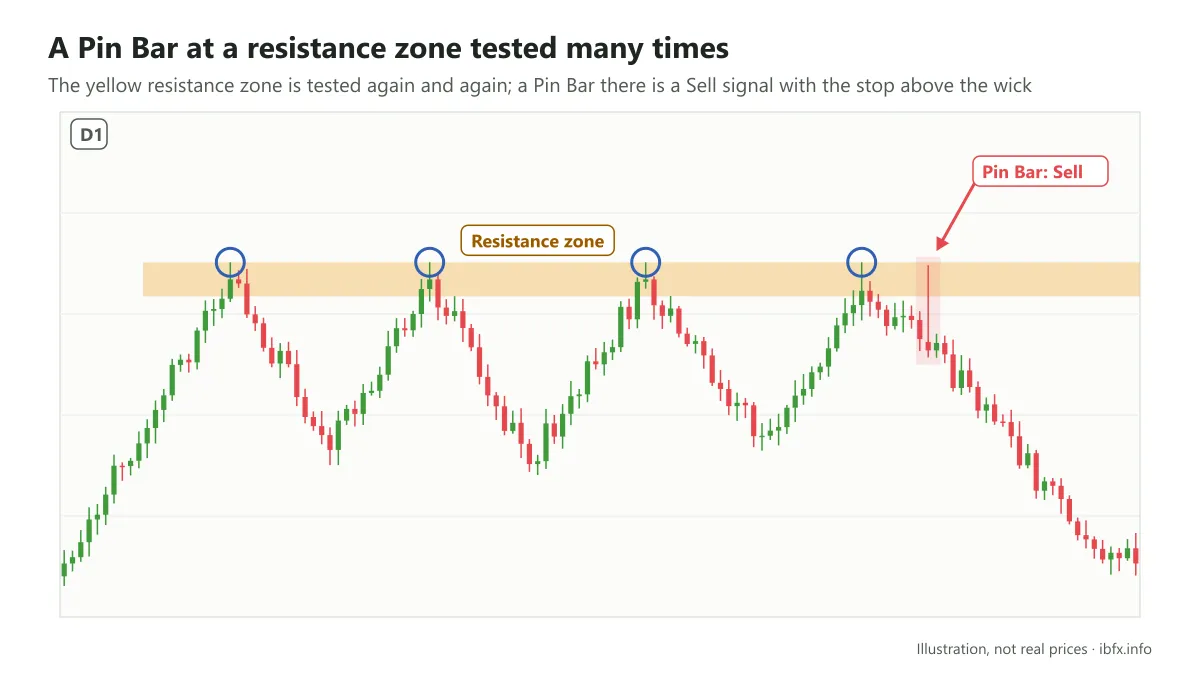
In this example the part shaded yellow is the resistance zone, which price tested again and again; combined with the Pin Bar at this zone, a Sell would have been in profit (though it does not work out every time).
Waiting for price to re-test support and resistance zones
As said above, the more often price tests a support or resistance zone, the more these support and resistance marks are worth. So price re-testing these levels is also one of the factors that makes a support or resistance zone worth trading.
For the price action school especially, if candles such as a Pin Bar or a Fakey show up here, that is a good sign to look for an entry, and it also makes the stop loss clearer to place.
A few points about support and resistance you need to remember
- Support and resistance are threshold zones on the chart that mark trading psychology levels and are used to set the entry and exit points on the chart.
- Support is a level below the current price. A resistance level is a level above the current price. Any low can be support and any high can be resistance. But not every zone is worth trading; they are only really useful when they have been tested again and again. Just as, out of 100 people you meet, only a few count as close friends, kindred spirits, or the one you have a crush on.
- Do not try too hard to draw many support and resistance zones; focus on the closest ones and the ones most worth trading.
- The support or resistance lines you draw do not always touch the ‘exact’ high or low of the Japanese candles. Drawing support and resistance is not a science, so it does not have to be too exact; it rests mainly on each trader’s skill, or more exactly it is an art, so the only way to get better at it is practice and real experience.
- For price action trend trading, a Pin Bar or a Fakey appearing right at a support or resistance zone is one of the most common and best-liked trading strategies.
- Trading support and resistance should be combined with extra trading tools, such as a momentum indicator or reversal candlestick patterns, to filter out some of the noisy signals.
- Support and resistance can be broken at any time, so always put the stop loss on the other side of the price zone. Read more: why support and resistance levels get broken.