On this page
If you set out to find the origin of technical analysis in forex trading, the answer you end up with is Dow theory. It is more than 100 years old, and it is no accident that Dow theory is seen as the foundation of technical analysis in the financial markets in general and in forex in particular. That is why, whichever school of technical analysis you go on to study, the first step is to understand Dow theory thoroughly. So what is Dow theory? Why does it matter that much?
The history of Dow theory
The father of Dow theory is Charles H. Dow. The basic principles of the theory took shape through a series of editorials he wrote for the Wall Street Journal. Those articles set out Dow’s beliefs about how the stock market reacts, and about how to measure the health of the financial market in order to look for a profit.
In 1902 Charles H. Dow died while his ideas had still not been put together into a finished theory. The people who carried on his work, above all William P. Hamilton (editor of the Wall Street Journal from 1908 to 1929) and after him Robert Rhea, went on to develop it, set it out in order, and produce Dow theory as we know it today.
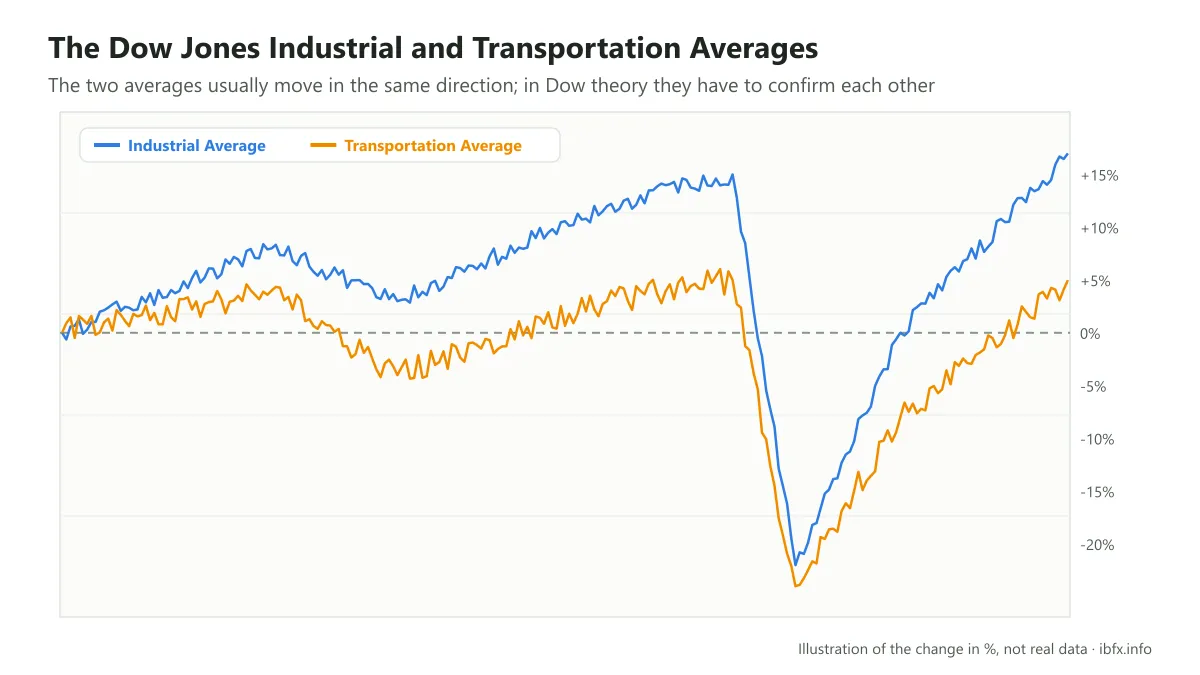
Dow believed the stock market as a whole is a reliable gauge of the overall condition of an economy. And by analyzing the market as a whole, you can judge those conditions, work out the direction of the main trend of the market, and see the direction in which each individual stock is heading.
To do that Dow relied mainly on 2 averages: the Dow Jones Industrial Average and the Dow Jones Railroad Average (now the Transportation Average), which Dow compiled and published in the Wall Street Journal. He took the view that they could reflect business conditions accurately because they covered the two main segments of the economy: industry and the railroads (transportation). The averages have changed over the past 100 years, but the theory still applies, and it has become one of the most basic theories for forex trading as well as for the modern financial market.
Most of the Western technical analysis we know today is influenced by Dow theory. So if you want a clear grip on technical analysis in forex, you need to know the 6 basic principles of Dow theory.
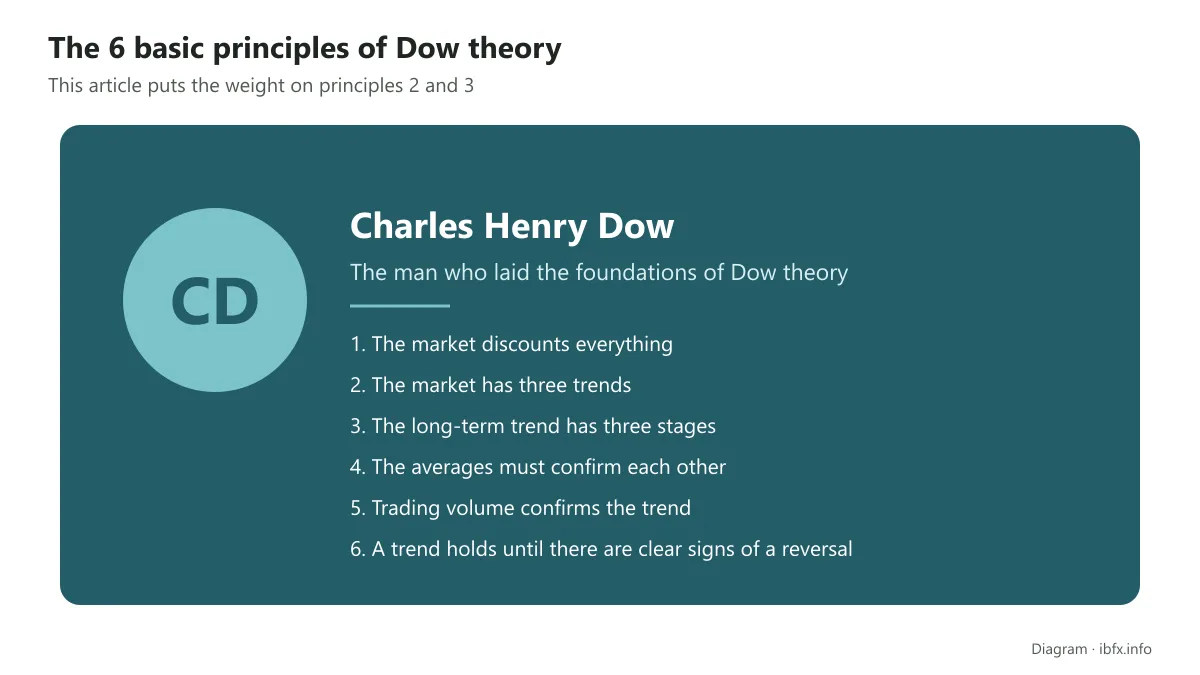
The 6 basic principles of Dow theory. Do your best to understand and hold on to principles 2 and 3.
Principle 1: the market discounts everything
The first basic premise of Dow theory says that all information – from the past, from the present, even about the future – affects the market and is reflected in the price of stocks and averages.
The information Dow is talking about here covers everything from investor sentiment to inflation and interest rate data. The only thing left out is what cannot be known in advance, such as an earthquake, a tsunami or an act of terrorism. Even so, the risks of such an event are priced into the market straight afterward.
One thing to note: according to Dow, information does not let a trader, or the market itself, know everything; it is only used to forecast events that will happen in the future. Even the factors that have already happened, are about to happen, and may happen will be priced into the market. When things change, the market has to adjust, and price with it, to reflect that changed information. This idea also turned up in the work Eugene Fama did in the 1960s and 1970s, under the name the efficient market hypothesis. Dow theory differs, though, in that it is used to forecast trends in the future.
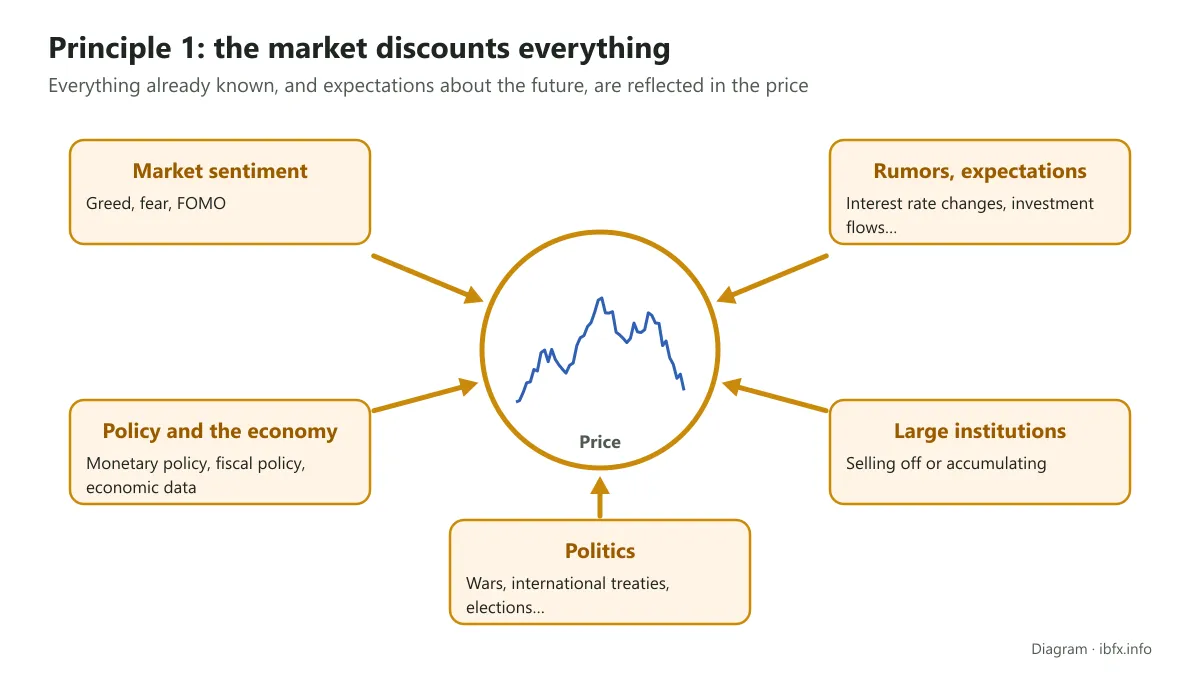
On top of that, the fact that the market reflects everything is nothing new to a trader, because it has always been put to use in finance. A great many traders can work out the market trend just by looking at price movement, without looking at other things such as indicators.
Like mainstream technical analysis, Dow theory focuses mainly on price. It differs in that Dow theory cares about the trend of the whole market (through the averages) rather than about each individual stock.
For example, someone who follows Dow theory will look at price movement through the indicators that sit inside the main trend. Once they have an idea of the trend in the market, they make an investment decision. If the long-term trend is up, the investor will buy and trade individual stocks at a reasonable valuation.
Principle 2: the three trends of the market
Before we go into the detail of analyzing the trend in Dow theory, we need to be clear about what a trend is. And although the market always moves in one particular direction when it has a trend, it never travels in a straight line. It rises to some level and makes the high of a trend, then falls back gradually and makes the low of a trend. Whether it rises or falls, though, it still moves in one particular direction.
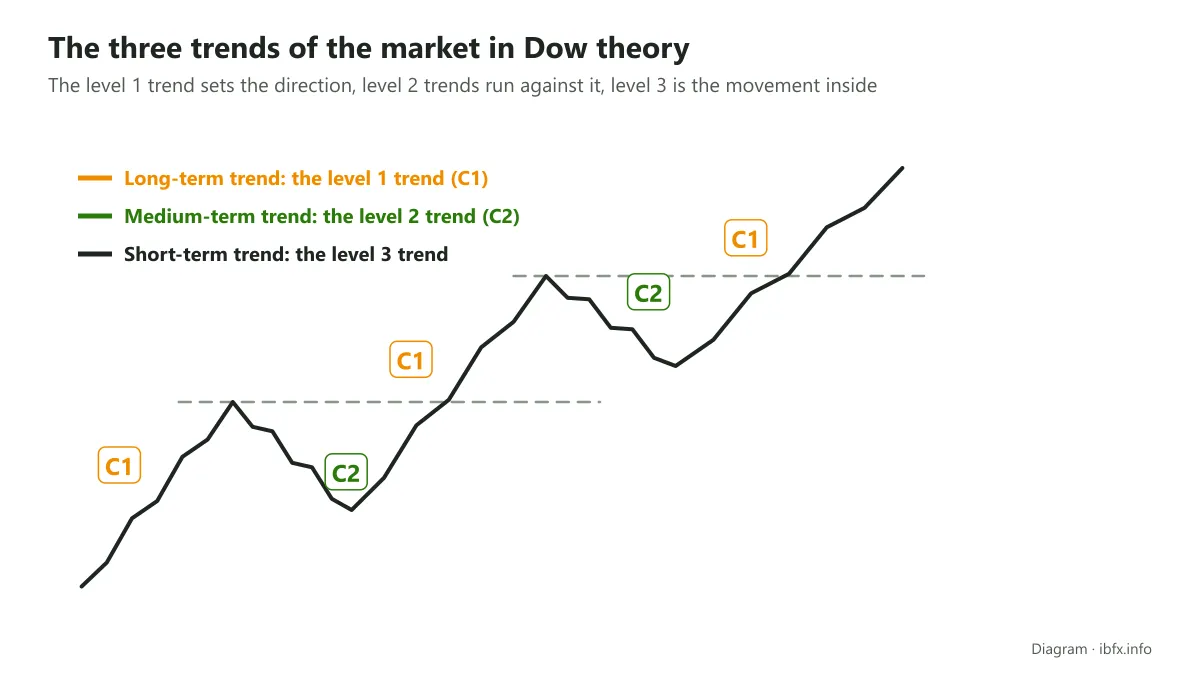
According to Dow, the three trends of the market are: the long-term trend (the level 1 trend, marked C1 in the diagrams), the medium-term trend (the level 2 trend, marked C2) and the short-term trend — the three that Dow’s own English writings call the primary, the secondary and the minor trend, in that order.
The long-term trend, the level 1 trend in Dow theory
The level 1 trend comes in both forms, an uptrend and a downtrend. In its nature the level 2 trend is the force that holds back the progress of the level 1 trend.
For example, in an uptrend that runs for several years, the market usually has corrective falls lasting a few weeks to a few months, which take back about 1/3 to 2/3 of the earlier rise, and only then does it carry on up. Those corrections are level 2 trends.
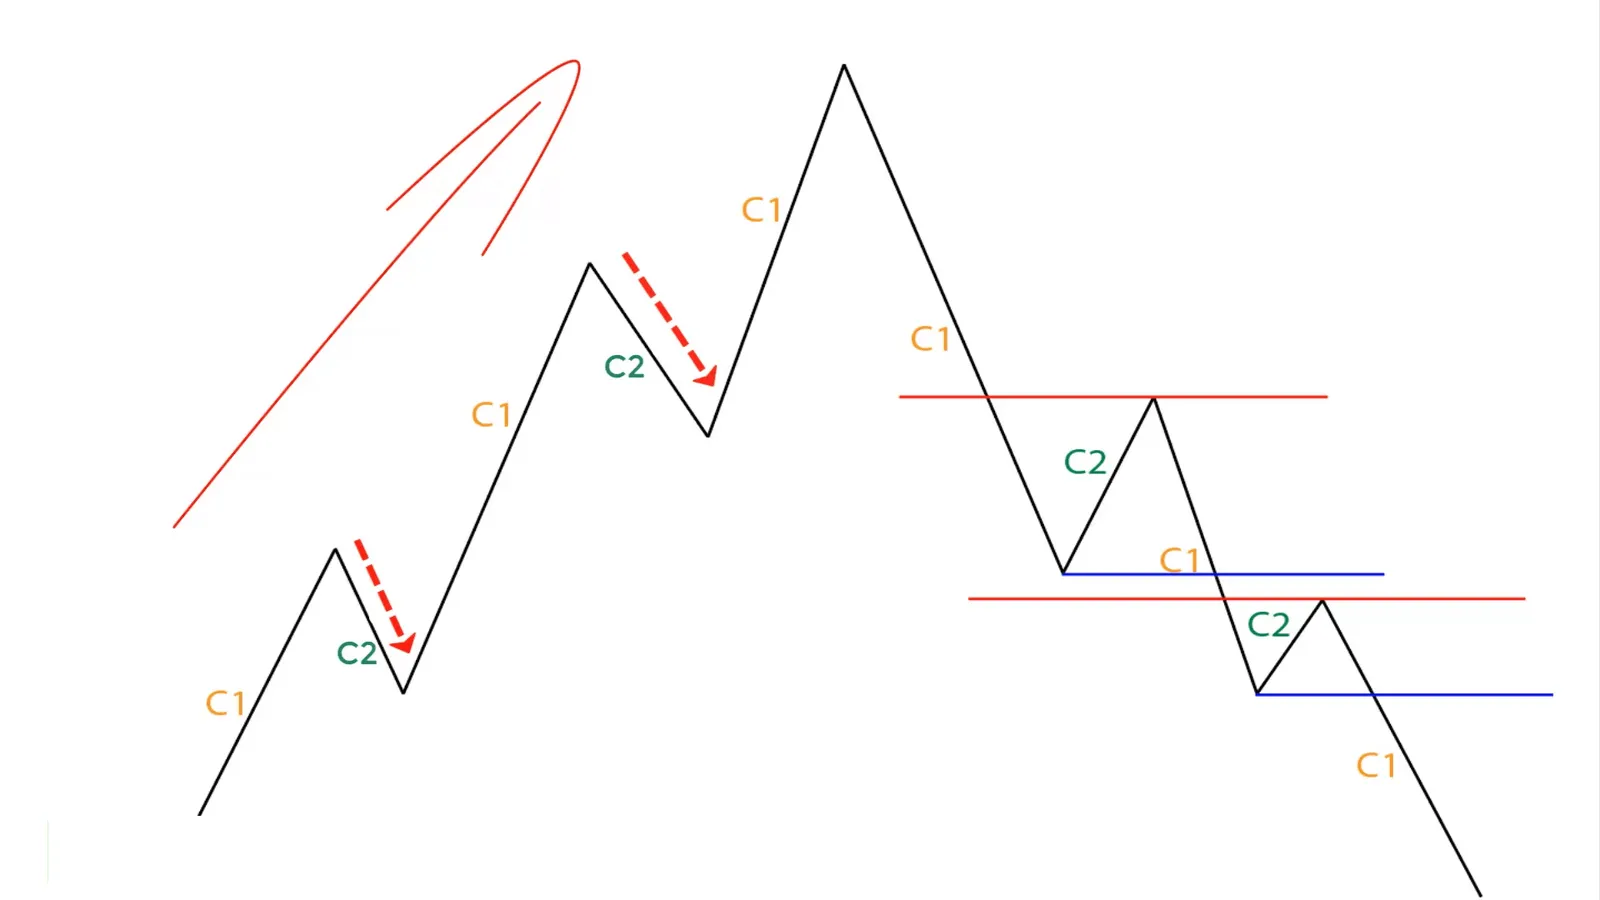
Look at the illustration above. On the left, the red arrows stand for a level 1 trend that is an uptrend: after every rising leg there is a falling one, which drags price back, or holds that rise back from carrying on. And the “troublemaker” that makes a mess of everything and stops the rise from developing is what we call the level 2 trend.
In the same way, on the red lines we drew on the right, inside a downtrend you can see that after every falling leg there are rising legs, and these too are taken as the level 2 trend, holding the fall back from carrying on.
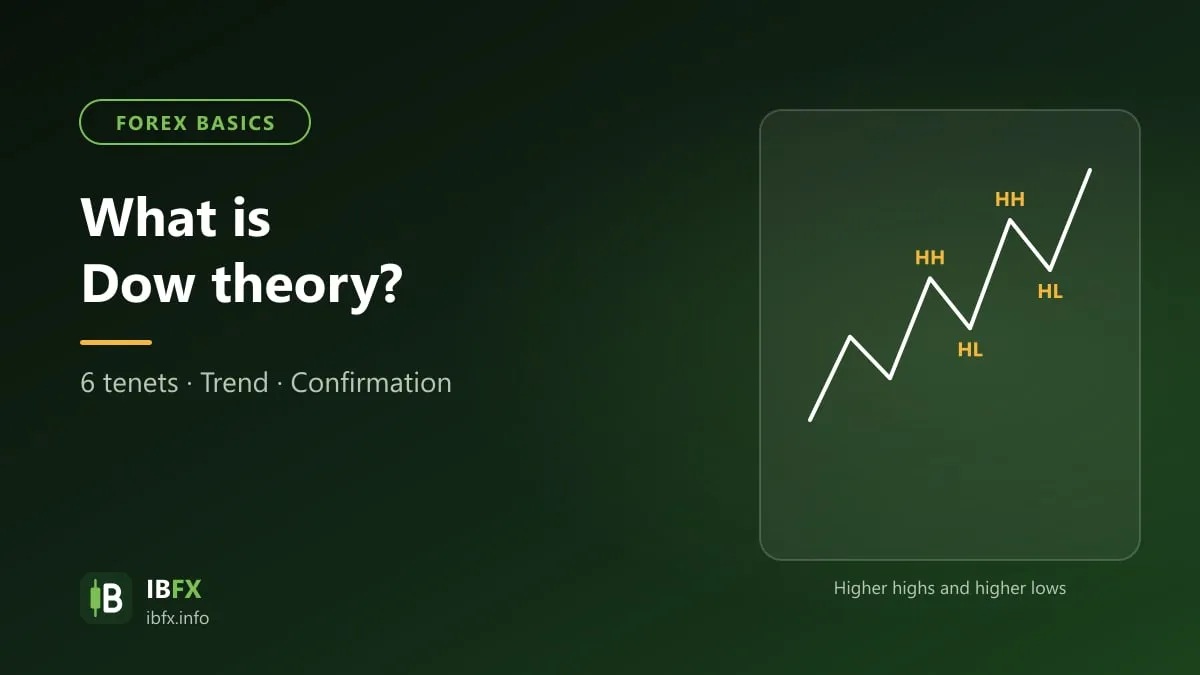
So the key point here is that A LEVEL 1 TREND (AN UPTREND) ONLY CARRIES ON when, and only when, it keeps making HIGHER HIGHS and HIGHER LOWS. Or each high has to be above the one before it and each low has to be above the one before it, just like the steps of a staircase.
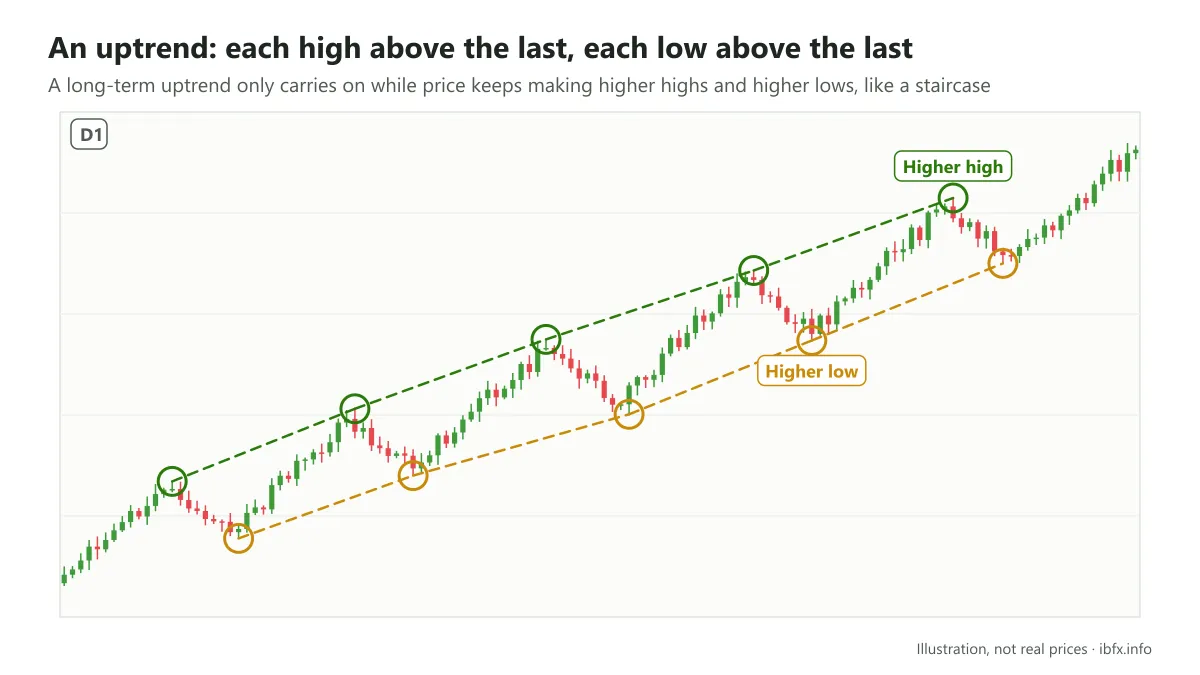
A level 1 trend (the long-term trend) that is an uptrend will make higher highs and higher lows.
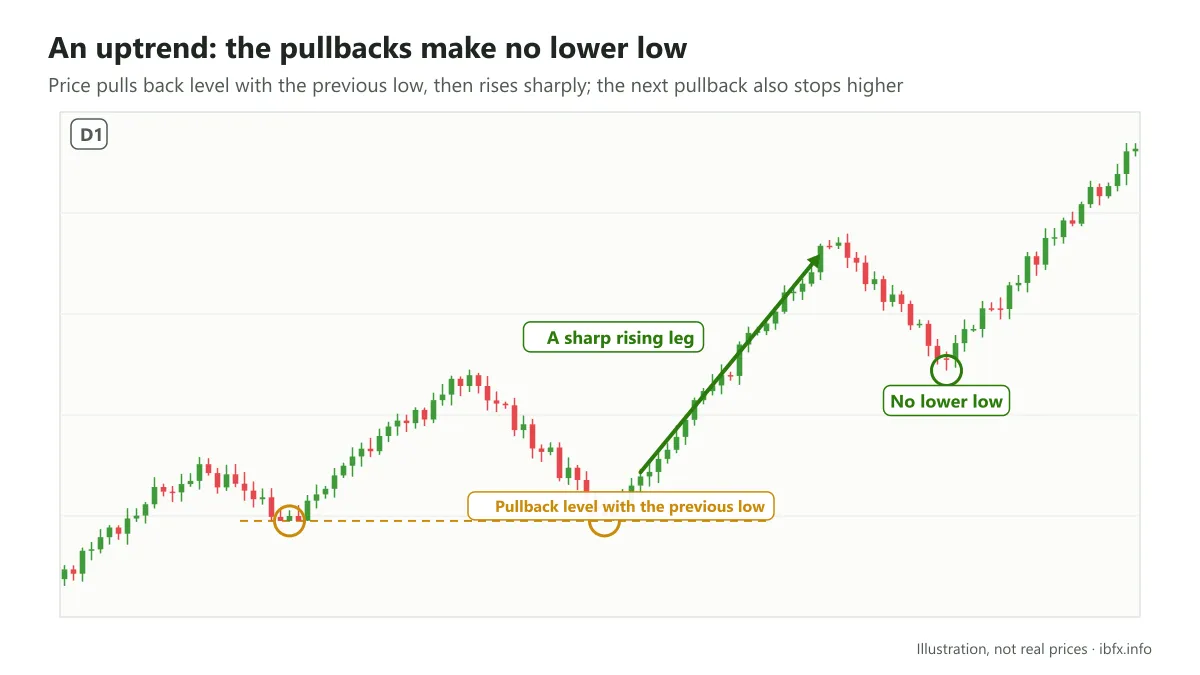
In the example above, price made higher highs and higher lows one after another. Price did fall back and correct at times, but you can see that this corrective fall was still level with the low in front of it, not below it. Price then had a very strong rising leg, after which it corrected down again, and again could not make a lower low, so this can be taken as a run-up before it carries on rising.
Meanwhile, if the level 1 trend is a downtrend, that means it will make lower highs and lower lows:
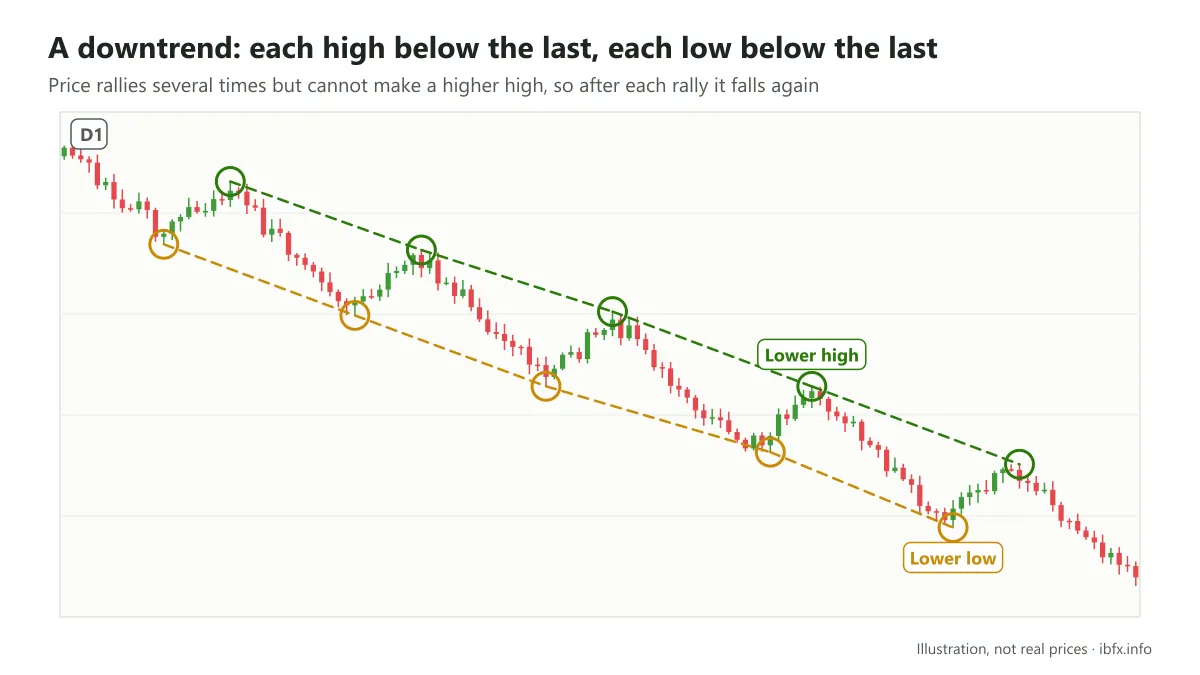
A long-term trend that is a downtrend will make each high below the one before it and each low below the one before it.
Looking at the example above, price made lower highs and lower lows one after another, so it fell away gradually.
Many times after a falling leg price recovered and rose, but it could not make a higher high, so after the rally price carried on falling.
How long a trend takes to form
According to Dow theory, the long-term trend is the largest trend and can run for years. The medium-term trend, meanwhile, may only run three weeks to three months and almost always runs against the long-term trend. Finally, the short-term trend usually runs less than three weeks and has to do with the price movement inside the medium-term trend.
One thing to note: however long the long-term trend runs, it stays in force until a reversal appears.
Also according to Dow, the level 1 trend is the most important trend for reading the market, and it has a large effect on price movement as well as on the level 2 trend and the short-term trend.
So you should give priority to trading with the trend: if the market is in an uptrend, give priority to looking for BUY trades; the other way round, if the market is in a downtrend, give priority to SELL trades. Beginners should hold back from trading against the long-term trend, and even with the trend you still need to place a stop loss.
The medium-term trend – the level 2 trend
This is taken as the “run-up” stage, the one that passes on the strength for the level 1 trend to carry on. On top of that, the medium-term trend always runs against the long-term trend.
If the long-term trend is an uptrend, the medium-term trend will be the corrective falls. The other way round, if the long-term trend is a downtrend, the corrective stretches are the recoveries in price, after which price carries on falling.
The level 3 trend - the short-term trend
The short-term trend, in Dow theory, does not run longer than 3 weeks, and it acts as a correction or produces price movement against trend 2.
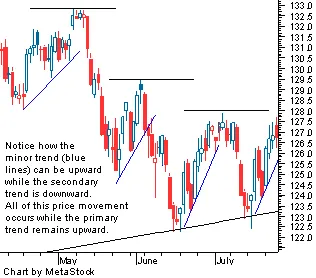
Because it is short-lived, the short-term trend is not a big concern for a trader. That does not mean ignoring it completely, though; the short-term trend still has to be watched, because this short-term price movement is also a part of the long-term and the medium-term trend.
In the spirit of Dow theory, a trader should give priority to the level 1 trend, because the other trends are often unclear or noisy. Concentrating too hard on the short-term trends can lead to mistakes: traders get distracted by short-term movement and lose the overall view of the bigger market picture.
Principle 3: the three stages of the long-term trend
Because trend 1 is the most important trend, in this part we will talk in detail about how the stages of a long-term trend (an uptrend or a downtrend) are formed.
A level 1 trend that is an uptrend has 3 main stages: the accumulation stage, the boom stage (public participation) and the excess stage (over-exuberance).
The other way round, the 3 stages of a falling market are the distribution stage, the sharp decline stage (panic) and the despair stage.
THE LONG-TERM UPTREND (A BULL MARKET)
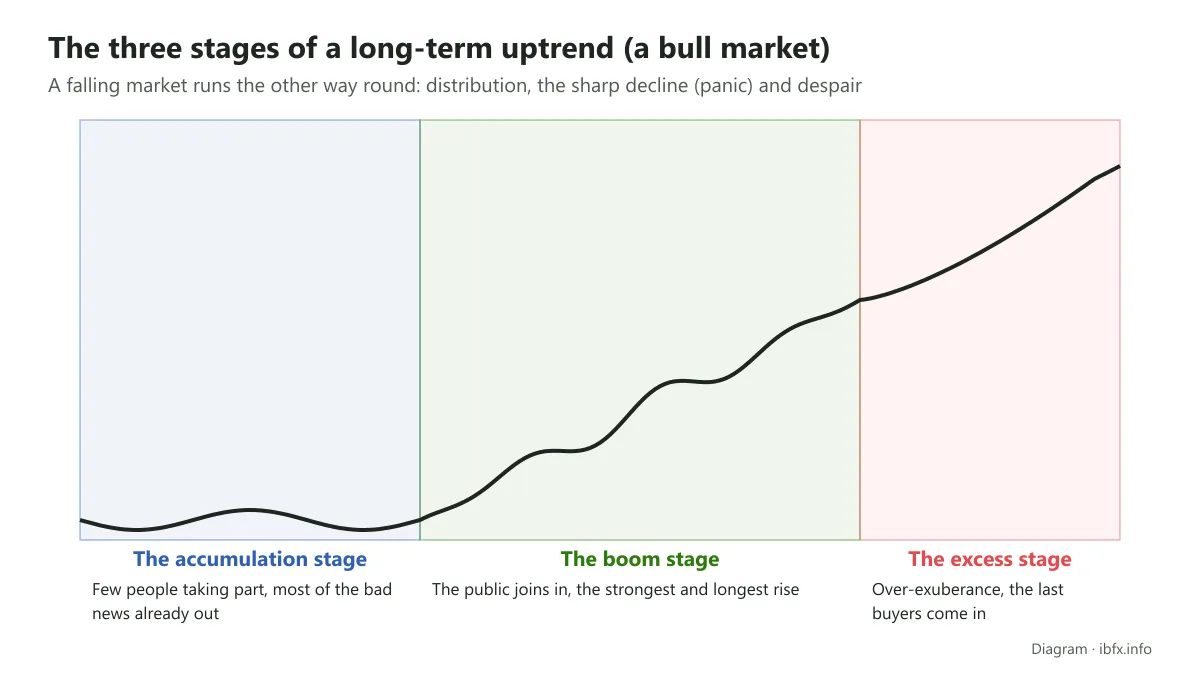
THE ACCUMULATION STAGE
This is the stage that sits at the start of a rising market, and it is also the point at which very few traders are taking part in the market.
The accumulation stage usually sits at the end of a downtrend, when everything seems to be at its worst. But it is also the moment when the price in the market is extremely attractive, because by this point most of the bad news is out and selling pressure gradually melts away, so the risk of a further fall is lower, although not absent. The accumulation stage is also the hardest one to spot, and a trader finds it hard to tell whether the downtrend has really ended or is still going on.
THE BOOM STAGE
As more and more investors join the market during the accumulation stage, it means they are starting to believe the worst has passed and that a recovery is on the way.
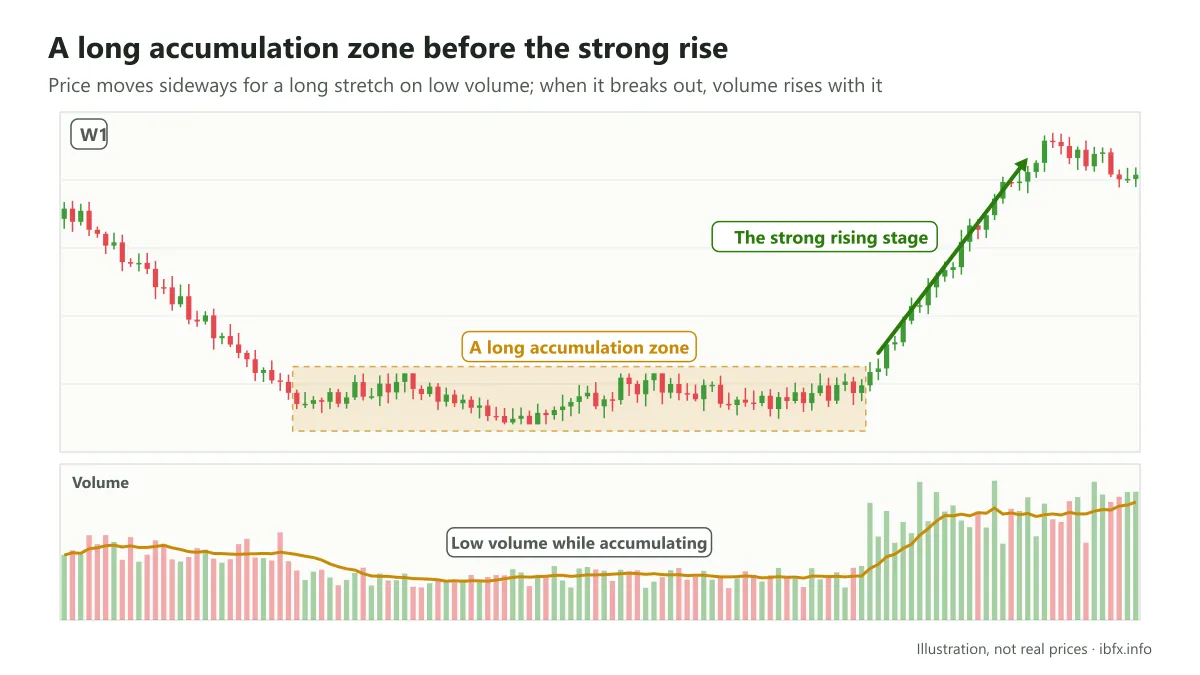
When that becomes reality, the negative mood starts to melt away, and business conditions – marked by earnings growth and strong economic data – improve. At this point optimistic news starts coming out, drawing many investors back and pushing price higher and higher.
This stage is not only the longest one, it is also the stage with the largest price movement. It is also the stage in which most technical and trend traders start holding longer term positions and taking a profit.
THE EXCESS STAGE
When the market has risen too strongly, the buyers begin to lose their grip, and at this point it moves into the excess stage – the final stage of the uptrend, and also the stage in which many of the speculators who accumulated earlier start looking to trim their positions, selling them to the people joining the market. The market at this point often falls into the state that Alan Greenspan (the former Chairman of the Fed) once called “irrational exuberance”.
This is also the stage in which the last buyers start joining the market – after price has already risen a great deal. Those who come in late hope the gains will carry on, having missed several earlier opportunities. Unfortunately, they are buying the top, and the chance of getting out is really rather thin.
During this stage there are a great many signs that buying is weakening, or that the trend is gradually growing weaker. It is also a sign that the trend above is sitting at the starting point of a long-term downtrend.
THE LONG-TERM DOWNTREND (A BEAR MARKET)
THE DISTRIBUTION STAGE
The first stage of a bear market is called the distribution stage. This is also the stage that comes right after the excess stage of the level 1 trend. It is the moment when the “sharks” unload!
This stage is the opposite of the accumulation stage in a rising market in that a great many traders believe price will keep on being pushed higher still, which leaves many traders very optimistic about the market, expecting price to fly to “the moon”. It is also the stage in which the last investors in the market carry on buying. And of course they do not know that they are really buying the top.
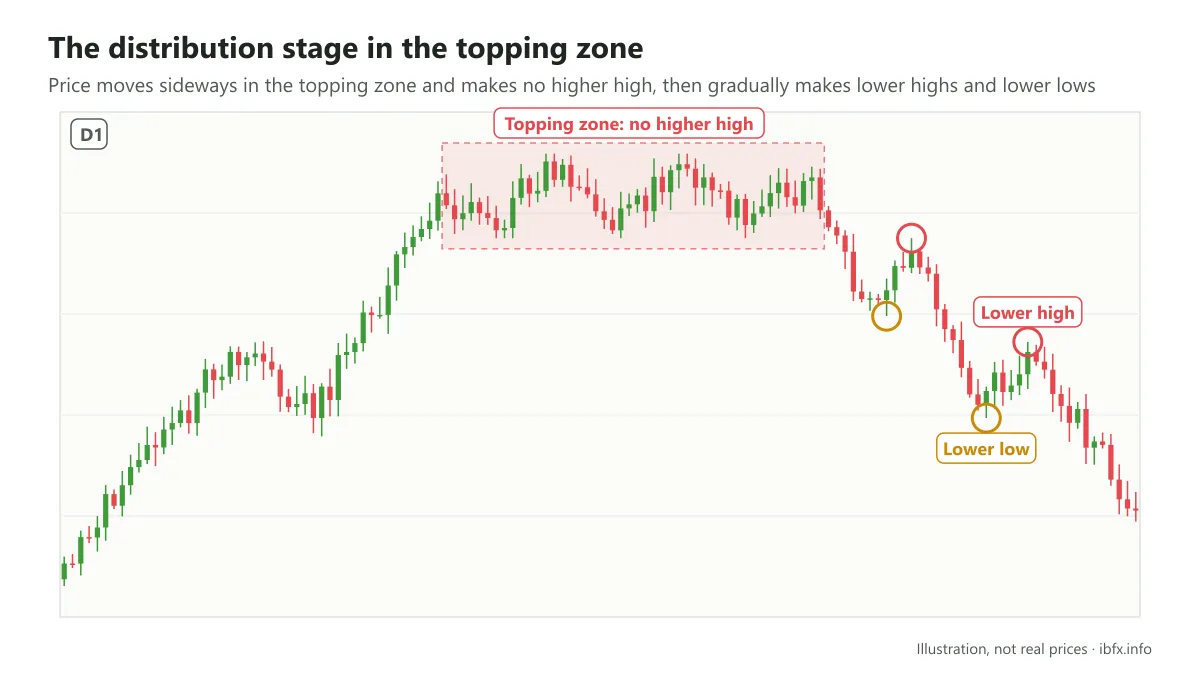
You can also see that at this point price seems unable to make higher highs and higher lows. Instead, it gradually makes lower highs and lower lows.
THE SHARP DECLINE STAGE
This is the stage in which price starts sliding, and it goes fast and loud!
Just as in a bull market, instead of making higher highs or higher lows one after another to confirm an uptrend, during the sharp decline stage price will only make lower highs and lower lows.
At this point business conditions are extremely bad and the worst news all comes out at once, like a blow struck straight at investors. That leaves them in a state of extreme confusion, panic selling appears, and price falls harder and harder.
THE DESPAIR STAGE
The final stage of a falling market is also the stage that starts off a rising trend about to be formed.
This is also the stage full of panic, and one that very easily leads to panic selling.
During this stage the market is nothing but gloom, and traders are in a negative frame of mind, with thin hopes for companies, the economy and the market as a whole. So they hardly care about price at all, and only want to get out as soon as they can.
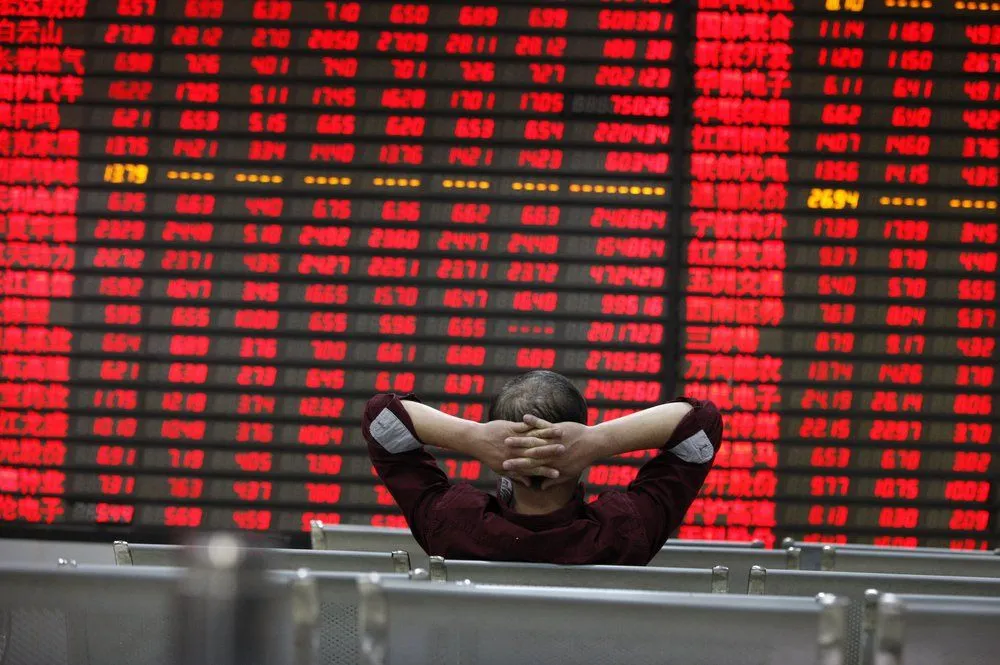
Note that the picture above is a board from the Chinese market, where red means a price going UP, the opposite of the colour convention in Vietnam and the West.
But when everything (apparently) at its worst is happening is exactly when the accumulation stage of a rising trend is about to begin.
And so the cycle repeats over and over, year after year, century after century.
Principle 4: the averages must confirm each other
In Dow theory, a reversal from a bull market (a rising market) to a bear market (a falling market) cannot be confirmed without confirmation from 2 averages (traditionally the Industrial Average and the Railroad Average).
This means the signals that appear on the chart of one average have to match, or correspond to, the signals that appear on the chart of the other.
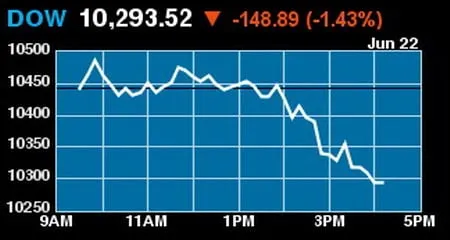
For example: if an average such as the Dow Jones Industrial Average confirms a new rising price trend, but the Dow Jones Transportation Average is still in a falling price trend, then there is no way to confirm that an uptrend could be happening.
This principle was built for the US stock market. When it is applied to forex, some traders adapt it by comparing related currency pairs (EUR/USD against the USD Index, for example), but that is an adaptation and not the original of Dow theory.
Principle 5: trading volume is a condition that confirms the trend
According to Dow’s theory, the signals to buy and to sell are based on price movement. That is why volume is also used as an indicator, to help confirm what the market is suggesting to a trader.
What this principle shows is that in a rising price trend volume will rise along with price when price moves in the direction of the trend, and fall when price moves the other way. For example, in an uptrend volume will rise when price rises and fall when price falls.
So in the case where volume runs against the trend (price rises but volume falls, price falls but trading volume rises), that is a sign of weakness in the current trend, and there may be a trend reversal in the time ahead.
A note for forex: the foreign exchange market has no central exchange, so there is no shared trading volume figure; the volume on MT4 is only the tick volume of the broker, so this principle is a matter of reference only. Read more: What is volume?
Principle 6: a trend holds until a sign of a reversal appears
We identify the trend so that we do not trade against it or fight it. According to Dow theory, this sixth and final principle holds that a trend stays in force until several signs appear that it has reversed.
A trader needs to wait patiently for a clear picture of the trend reversing, because, as we know from principle 2, the market will have many short-term (minor) trends and medium-term trends, so it is very easy to mistake what is really the long-term trend for what is only a correction of the trend.
Things to note about Dow theory
Dow theory does have certain limits: it is fairly slow, and it is not always completely right, above all for short-term trading, because of the effect of crowd psychology along with the growth of the internet. On top of that, today’s market trades on minute and second time frames rather than on the daily time frame of the stock market of old, which is why the market is noisier and the information less accurate.
Dow theory is still an important foundation for understanding the trend, though. Reading and understanding the whole set of principles will help you understand more of the technical analysis tools used in the financial markets in general and in forex in particular. Read on: What is a trend? How to identify the market trend.