On this page
In trading, divergence is a technical event you meet often on the chart. It is fairly easy to spot and useful if a trader understands what it really is and uses it alongside other tools.
To understand what divergence is, you need to keep in mind that divergence is not a certain entry signal but a warning: the momentum behind price is fading. A few things about divergence can run against common thinking, for example divergence can last a very long time before price actually turns.
You can look for divergence on most of the common oscillators such as RSI, Stochastic, MACD and so on; pick the one indicator that suits you and fits your style when you go looking for divergence signals.
What is divergence?
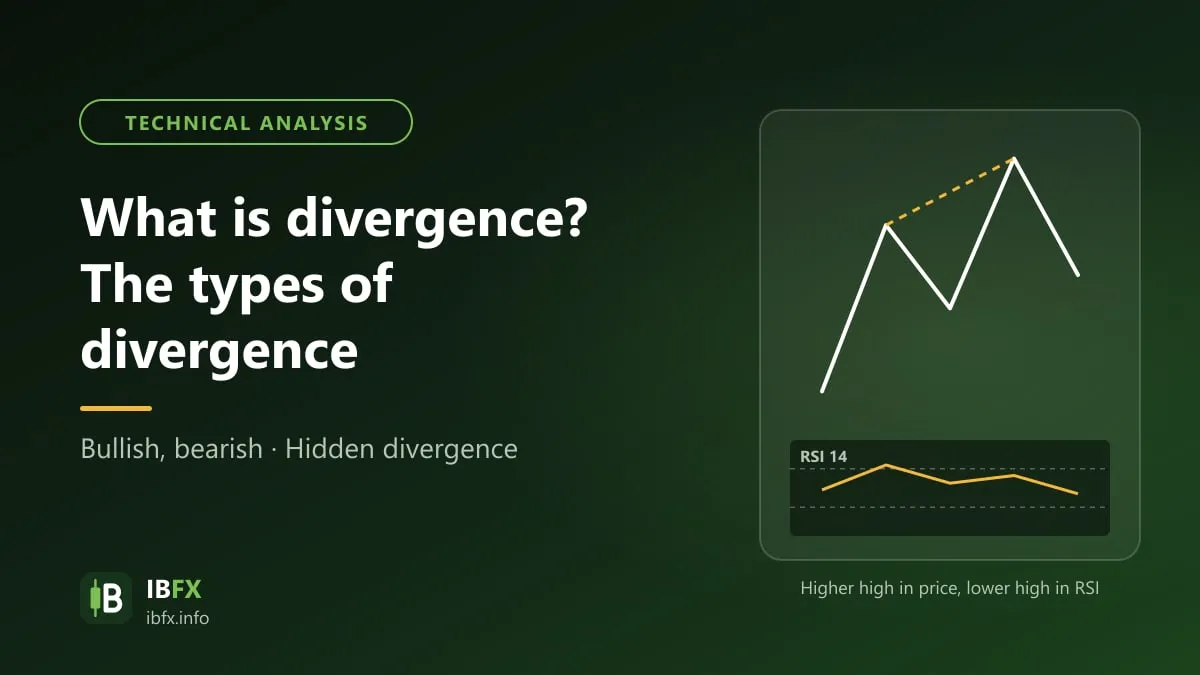
Divergence is when price and an oscillator move in opposite directions: price still makes a higher high (or a lower low) but the indicator does not. This is one of the early signs that the current trend may be weakening and could turn.
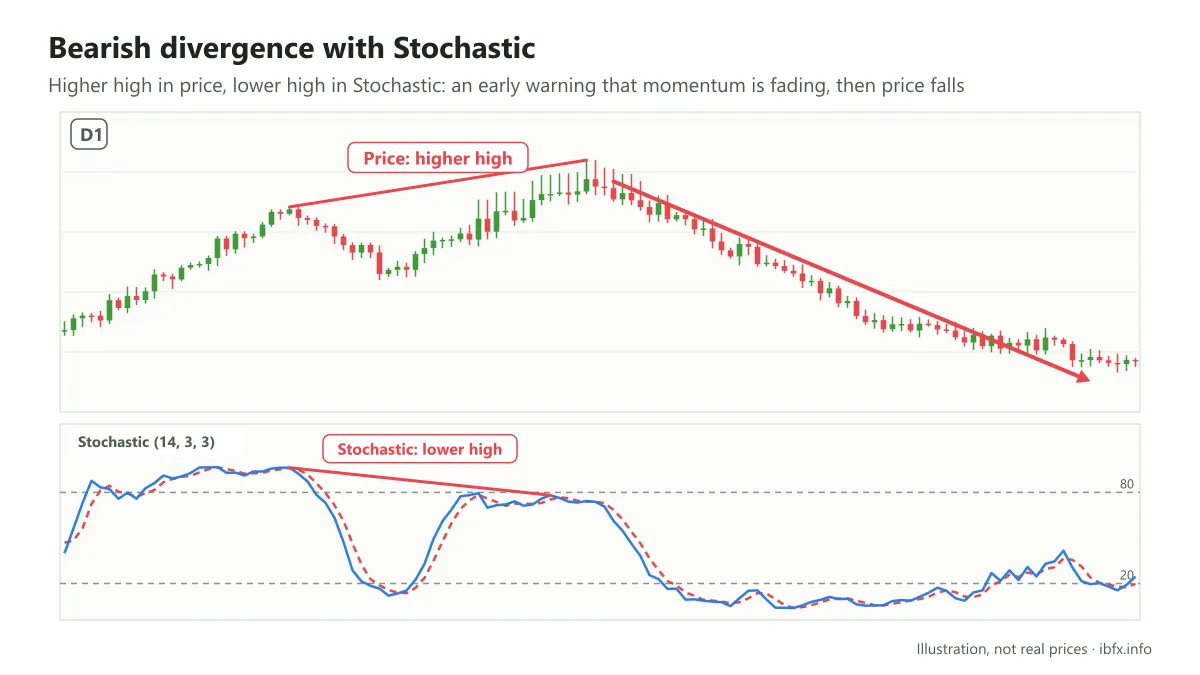
A divergence using Stochastic, an early sign of a reversal to the downside.
You can picture divergence as an undercurrent below that runs against the price wave rising on the surface.
In an uptrend, price is making waves that get higher and higher; when divergence shows up, the momentum underneath is running the other way, warning that price could turn down, or at least that the market’s upward strength is fading. In a downtrend it is the other way round.
Divergence is a fairly common signal and a great many traders who follow technical analysis watch for it.
The types of divergence in trading
Regular divergence (a reversal signal)
Regular divergence comes in 2 types: bullish divergence and bearish divergence.
Bullish divergence is when price falls and makes a lower low than the previous low, while the oscillator makes a higher low than its previous low.
This is a warning that the downtrend is losing strength and that price may be forming a bottom.
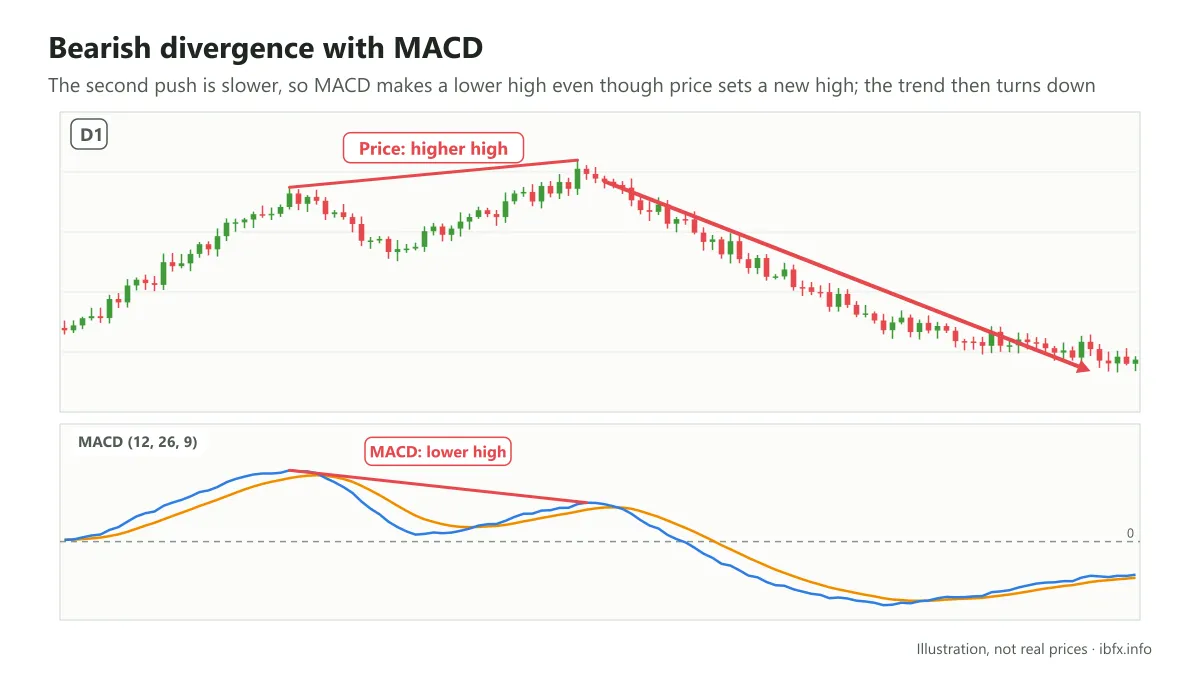
Bearish divergence with MACD: price makes a higher high but MACD makes a lower high, a sign that the uptrend may turn.
The other way round, bearish divergence is when price rises and makes a higher high than the previous high, while the oscillator makes a lower high than its previous high.
This is a warning that the uptrend is losing strength and that price may be forming a top.
Hidden divergence (a continuation signal)
Besides regular divergence there is also hidden divergence, which usually signals that the current trend may continue after a pullback:
- Hidden bullish divergence: in an uptrend, price makes a higher low than the previous low, but the indicator makes a lower low than its previous low.
- Hidden bearish divergence: in a downtrend, price makes a lower high than the previous high, but the indicator makes a higher high than its previous high.
For a beginner, hidden divergence, which runs with the trend, is usually easier to trade than regular divergence, because you do not have to guess tops and bottoms.
What to watch out for when you use divergence
Divergence showing up inside a trend does not mean that the trend is going to end. In a strong trend, divergence can show up several times in a row and last quite a long time before the trend actually changes.
So traders need to treat divergence as a warning signal and should combine it with other tools such as support, resistance, trendlines, moving averages and so on before they decide to enter, to cut down on false signals.
Bearish divergence means more when it shows up at strong resistance zones; in the same way, bullish divergence means more when it shows up at strong support zones.
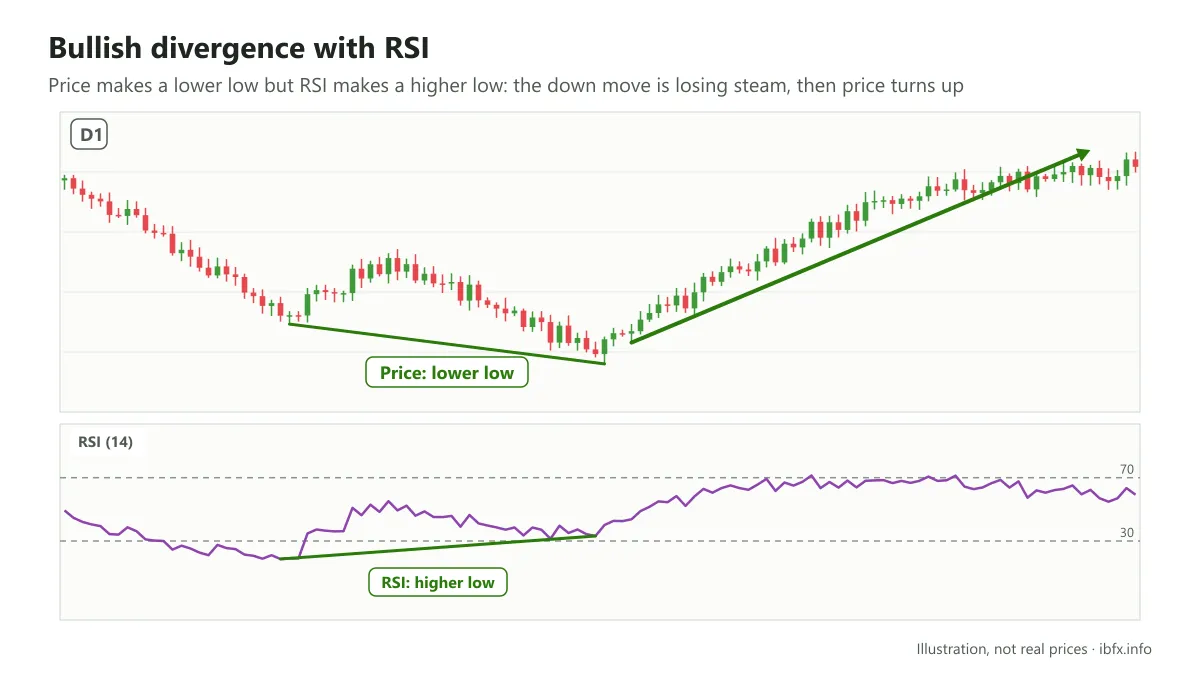
A bullish divergence, with the divergence shown on RSI.
You should combine multi-timeframe analysis, at least looking at a higher timeframe as well, to avoid noisy divergence signals on the lower timeframe.
The trend is a very important factor, especially the trend on the higher timeframe: divergence that runs against the higher timeframe trend usually leads only to a pullback.
You can also look at the trading volume of the candles in the area where the divergence top or bottom forms for extra confirmation (in forex that is tick volume, which is for reference only).
You need to treat support and resistance levels as a price zone. When price makes the 2nd top or bottom that completes the divergence, that zone usually covers several candles, so do not enter the moment you spot a divergence. Wait for one more confirmation signal, for example a reversal candlestick pattern, price breaking a short-term trendline, or price breaking the nearest high or low, and only then enter; the stop loss goes on the far side of the 2nd top or bottom.
Divergence can also be used to manage an open trade: when divergence shows up against your position, you can consider taking part of the profit or moving your stop loss to protect the profit you have.
Finally, trading is a game of probability and divergence can be wrong too. Try not to let a false signal shake you, and not to get overconfident after a signal that worked; always place a stop loss and practice on a demo account first.