On this page
In trading, volume is a useful piece of information alongside price: it helps a trader judge how busy the market is and how strong a rise or a fall is. Volume in forex, however, has features that differ from stocks, and a beginner needs to understand them clearly before using it.
What is volume?
Volume is the number that measures how much was bought and sold over a stretch of time, within a single H1 candle or a single day, for example. On the stock market or the futures market, trading is centralized on an exchange, so volume is the number of shares or the number of contracts actually matched.
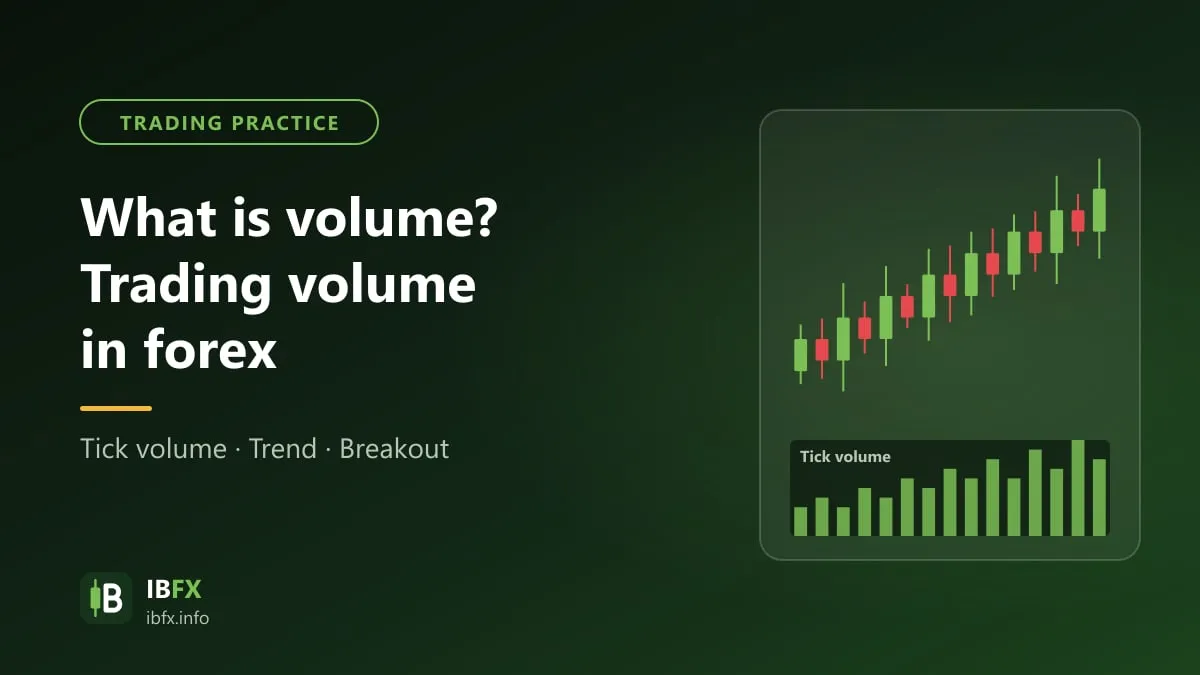
Spot forex is different: it is a decentralized market where trading takes place between a great many banks, institutions and brokers, so there is no single volume figure for the market as a whole. The volume you see on MT4 and MT5 is tick volume, that is the number of times the price changed within each candle, as recorded by each individual broker. Because of that:
- Tick volume reflects how busy the market is only indirectly: the more times the price changes, the busier trading usually is.
- Tick volume can differ from one broker to another.
- If you need real volume figures, some traders turn to the volume of currency futures on the CME (the Euro FX contract, for example, which corresponds to EUR/USD), or to the weekly COT report from the CFTC to see the positions held by the various groups of investors.
In practice, tick volume usually moves quite closely with how busy the market really is (rising sharply in the European session, the US session and when news comes out), so you can still use it as a reference, as long as you understand its limits.
Why volume matters
Volume tells you how much interest the market is taking in a price move. A rise or a fall that comes with large volume shows there are many participants and that money flow is behind it, while a rise or a fall on small volume is usually less reliable.
Volume is also tied to liquidity. A day trader needs a market with high liquidity in order to get in and out easily at a low spread. In forex that usually means the major pairs such as EUR/USD, USD/JPY and GBP/USD, during the hours of the European and US sessions. See also: The forex trading sessions and their hours
How to use volume in trading
Volume is usually used as a confirmation tool that adds to price analysis, rather than as something that produces buy and sell signals on its own. The three common uses are confirming a trend, spotting a possible reversal and confirming a breakout.
Confirming a trend
- Price up, volume up: the uptrend is being supported and is more likely to continue.
- Price up, volume falling away: interest is fading; the price can still go higher, but be careful, particularly as it moves toward resistance zones.
- Price down, volume up: the downtrend is being supported. If you hold a sell position, this is a confirming sign; if you hold a buy position, consider getting out.
- Price down, volume down: selling pressure may be weakening, but the signal on its own does not say much.
In a clear trend, the moves that run with the main trend usually carry larger volume than the pullbacks. If a pullback comes with unusually large volume instead, that can be a sign the trend is weakening.
Spotting a possible reversal
After a long trend, if one or a few candles appear with a sudden spike in volume, that can be a climax: buyers (or sellers) pouring in one last time, with the push behind the move running out.
- A volume spike at a top after a long uptrend, on a candle with a long upper wick, can be a sign that buying has exhausted itself.
- A volume spike at a bottom after a long downtrend, on a candle with a long lower wick, can be a sign of exhausted selling.
A volume spike, however, also appears very often in the strong breaks that open a new rise or fall, or simply when news comes out. So do not enter against the trend just because you see large volume; wait for further confirming signals such as a reversal candle or a break in the structure of highs and lows, and always place a stop loss.
Confirming a breakout
At important support and resistance zones, volume helps you judge the quality of a break. When the price breaks through resistance or support with a sharp rise in volume, the breakout is more likely to succeed. If the price goes through on low volume, with nothing remarkable about it, the risk of a false break is higher.
Volume-based indicators
- Volume and the moving average of volume: helps you see which candle carries unusually high or low volume compared with the norm.
- OBV (On-Balance Volume): adds up the volume of rising sessions and subtracts the volume of falling sessions, used to see whether money flow is behind the price trend or not.
- Money Flow Index (MFI) and Chaikin Money Flow (CMF): combine price and volume to measure buying and selling pressure.
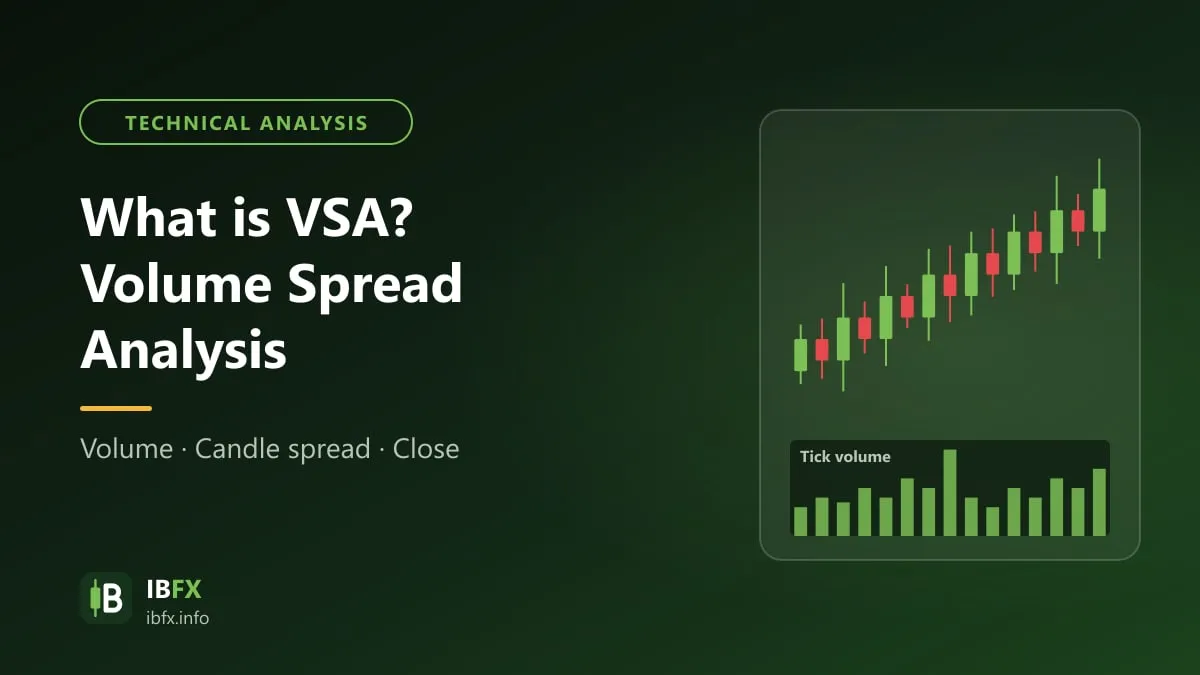
- VSA (Volume Spread Analysis): analyzes the relationship between volume, the range of the candle and the closing price.
Note that when you use these indicators on spot forex, the input data is still nothing more than tick volume.
Conclusion
Volume is a useful tool for confirming a trend, spotting a possible reversal and judging the quality of a breakout, but in forex it is only tick volume, with plenty of limits. Do not use volume as an entry signal on its own; combine it with price analysis, support and resistance, and always manage risk, risking only about 1–2% of your account on each trade.