On this page
Breakout is a familiar and fairly important idea for traders in financial markets such as stocks, foreign exchange and cryptocurrency. A breakout is price breaking out as it moves through the market, and it is also the name of a trading strategy in which traders make use of these breaks in price to look for profit.
Trading the breakout strategy is far from simple, because false breaks happen very often. As a new trader you need to study it closely, practice on a demo account and always limit the risk on each trade.
So what is a breakout, how do you spot a breakout in the market, and how do you limit the risk when you trade breakouts?… Let’s go through this article together.
What a breakout is and the kinds of breakout in the market
What a breakout is
A breakout is price breaking out of an important price zone that it has held inside for a certain stretch of time beforehand. After price breaks out successfully, the market tends to move in the direction of the break.
The important price zone the market holds for a stretch of time before the breakout happens is usually a sideways accumulation, a zone bounded by the trendline of an uptrend or by the trendline of a downtrend, or an accumulation zone in one particular shape or another… after the breakout happens successfully, the market tends to push hard in the direction of the break, which may be a striking reversal or may be the current trend carrying on but with more force and a stronger push.

Traders who follow the breakout strategy look to make use of this strong push. Not every breakout, however, has enough force to build a new trend, and not every break turns out successful. This is the risk traders run into again and again when they trade this strategy.
Breakouts happen on every kind of asset traded in the market and on every timeframe, so the breakout strategy can be applied to many trading styles, from scalping and day trading through to swing trading and position trading. The smaller the timeframe, the more false breaks there are.
The kinds of breakout in the market
Although it is generally understood as price breaking out of an important price zone, a breakout takes many different forms in the market, depending on the marks of the important price zone before it and on how the break plays out. Each kind of breakout has different marks, a different rate of successful breaks, and a different trading strategy to go with it.
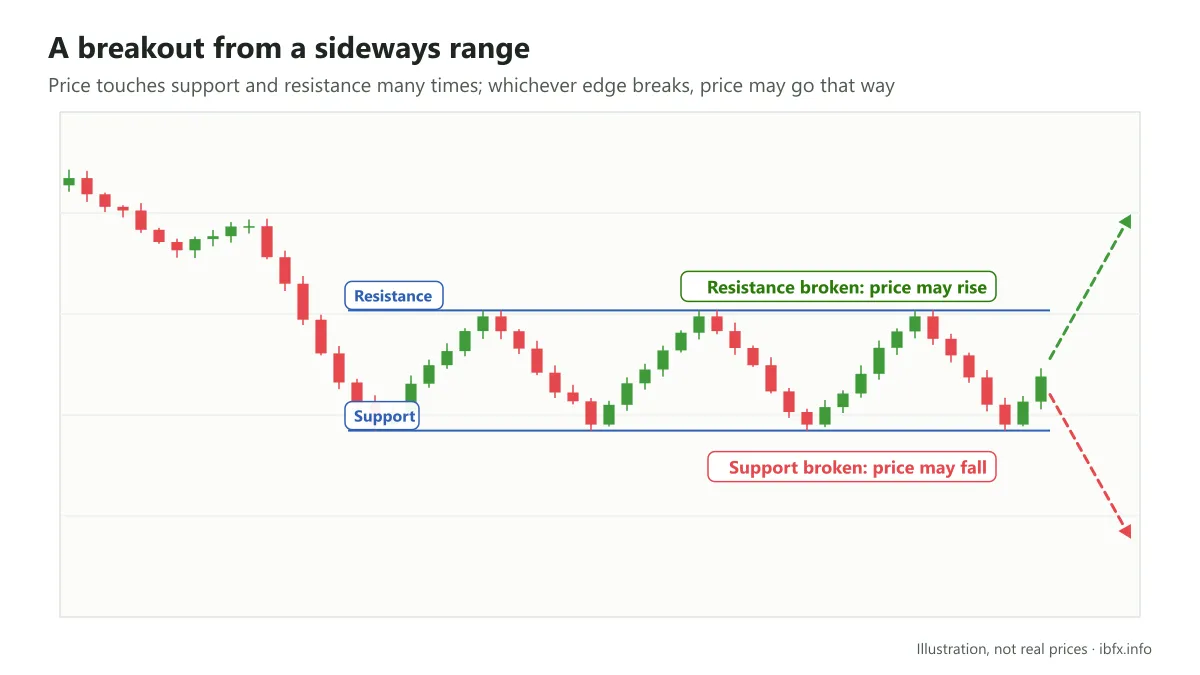
- A breakout from a sideways accumulation
A sideways or sloping accumulation zone forms when buyers or sellers are in a resting phase, gathering their forces before a new push. Price breaking out of this accumulation zone means it has cleared the support level on the way down or cleared the resistance level on the way up.
A support or resistance level offers a strong barrier when price has touched it and turned back at least 3 times. The stronger the barrier, the harder price usually runs once it is broken.
- A breakout from the trendline of a trend
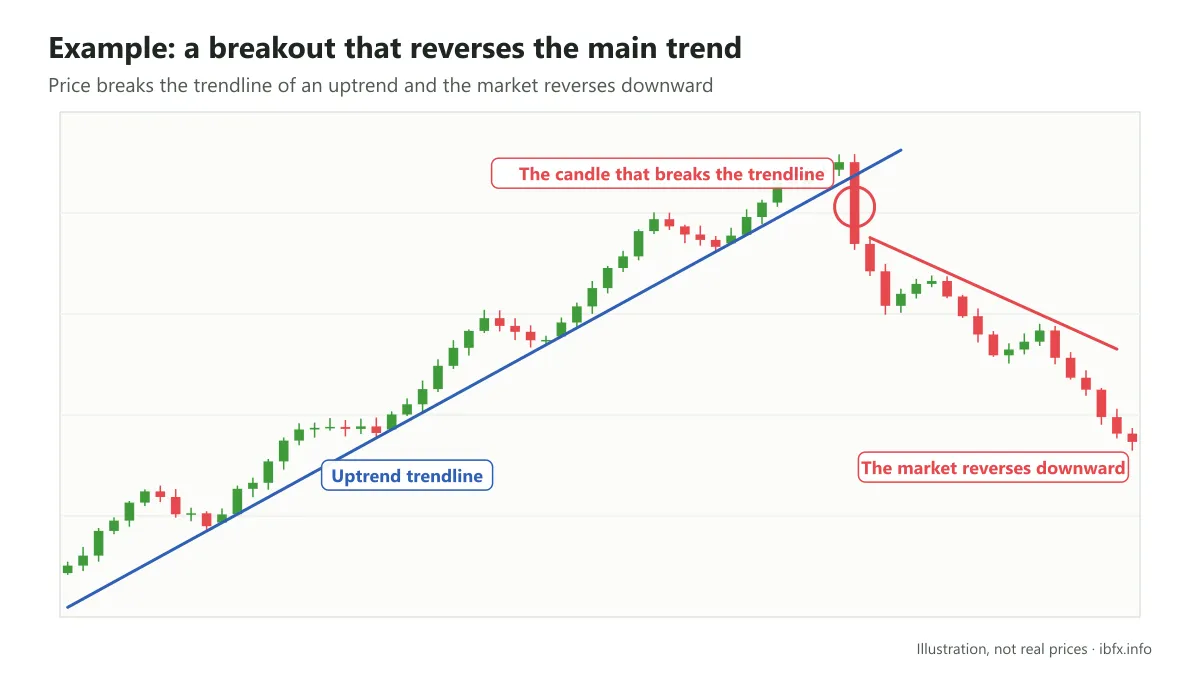
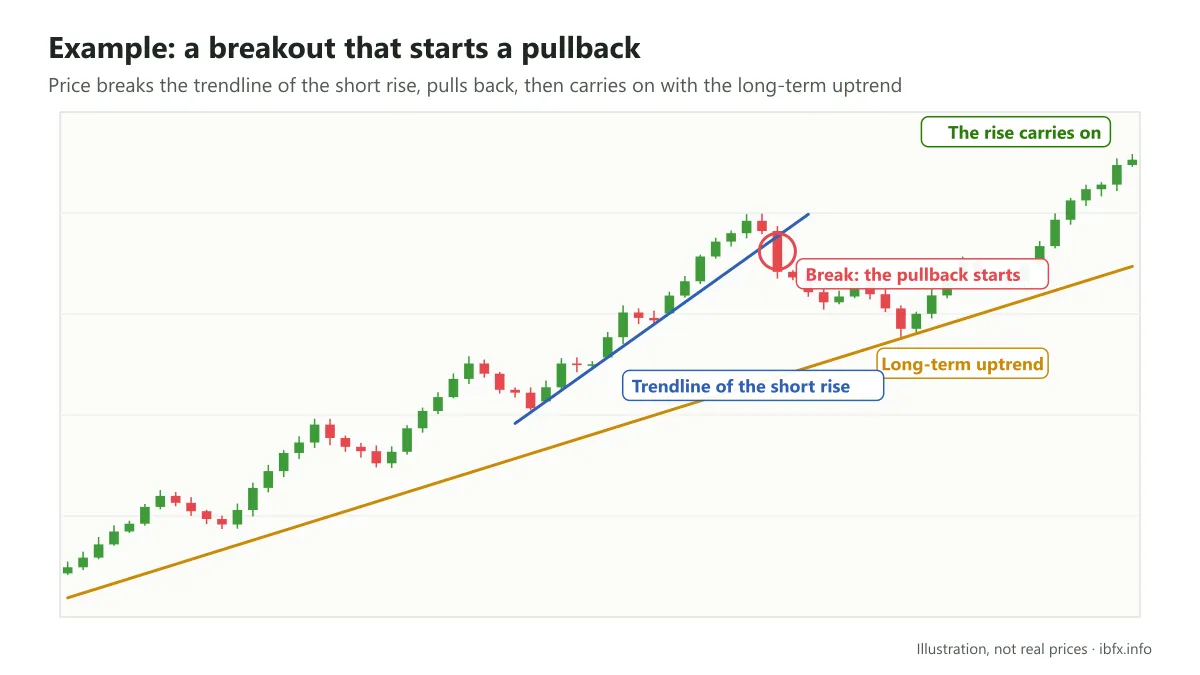
The lower trendline of an uptrend plays the part of a strong support level; the other way round, the upper trendline of a downtrend plays the part of a strong resistance level. When price breaks out of these important levels, the market may reverse, or it may only move into a correction or go sideways.
After a long-term uptrend or downtrend, a medium-term stretch of uptrend or downtrend, or a short-term up or down wave, the market slows down a little because the current trend is gradually weakening or is simply taking a rest; at that point the other side attacks hard and builds strong breakouts. The result is that the current trend reverses, or a new correction forms before the old trend carries on.
In many cases too, price breaks the upper trendline of an uptrend (which at that point plays the part of a resistance level) and forms a new uptrend whose trendline has a new slope. In the same way, price breaks the lower trendline of a downtrend (which at that point plays the part of a support level) and forms a new downtrend whose trendline has a new slope.
Example: a breakout that reverses the main trend
Example: a breakout that forms a correction in the market
- A breakout from price patterns
A price pattern is one of the important tools of the price action school of analysis.
Most price patterns stand for periods of accumulation in the market, but not simply sideways accumulation: the accumulation zone takes very distinctive shapes such as a triangle, a rectangle, a flag or a wedge…
When price breaks out of these patterns it usually runs fairly clearly in the direction of the break, but a false break can still happen.
See also: An introduction to the candlestick patterns of price action.
Example: price breaking out of a descending triangle
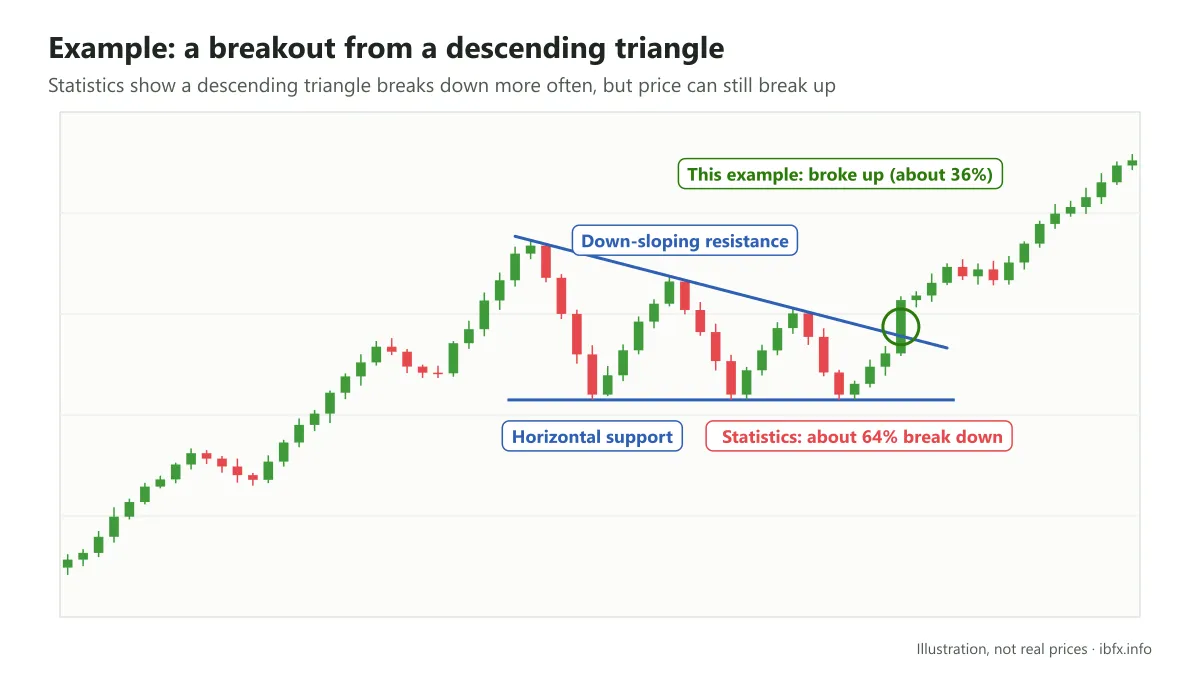
The market is in an uptrend, then moves more and more slowly and accumulates into a triangle-shaped price zone. This is the Descending Triangle price pattern (a down-sloping resistance line and a horizontal support line).
The Triangle price pattern does not give a precise signal about which way the market will go after price breaks out of it. In the Descending Triangle pattern, as the accumulation zone forms price makes lower highs while the lows stay at the support level, which shows that sellers seem to have the upper hand. Going by the statistics cited by Kirkpatrick C.D & Dahlquist J.R (mainly from the US stock market), the chance of price breaking out downward is higher than upward, at a ratio of about 64%:36%; the situation above, however, fell into the less likely case, with price breaking upward and the market carrying on higher right after.
Why the breakout strategy is risky, and what a false breakout is
Breakout trading can bring back a high profit because price often pushes hard after the break. What matters, though, is whether price breaks out successfully. Price may clear the support or resistance level and then turn straight back into the earlier price zone and hold there a while longer, or break successfully in the opposite direction; that leads traders to think price has broken out successfully and to enter at once, and what they get back is a fairly bitter result.
That unsuccessful break in price is what is called a false breakout, or a fakeout.
The breakout strategy is riskier than other strategies because false breakouts happen in the market again and again, or because price does break out successfully but the push is not strong, so price does not travel far in the direction of the break and the profit does not cover the trading costs, or the risk:reward ratio is poor and does not work over the long run.
Example 1: a false breakout of a sideways accumulation
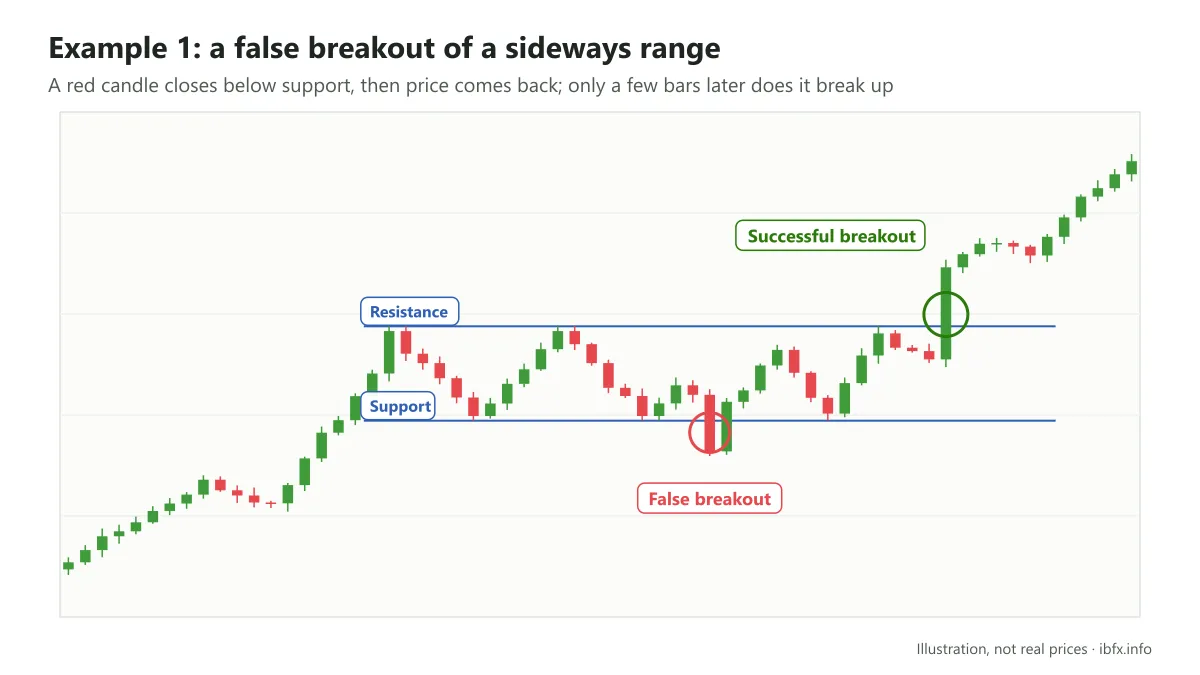
A red candle with a fairly long body breaks the support level of the sideways accumulation, but right after it price turns back into the accumulation zone, and only a few sessions later does price really break out upward successfully, with a green candle with a very long body. If you entered a Sell right after the red candle (the false breakout bar) closed, that trade lost money.
Example 2: a false breakout of the trendline of a trend
The screenshot shows the Vietnamese interface; the buttons and labels sit in the same places in the English version.
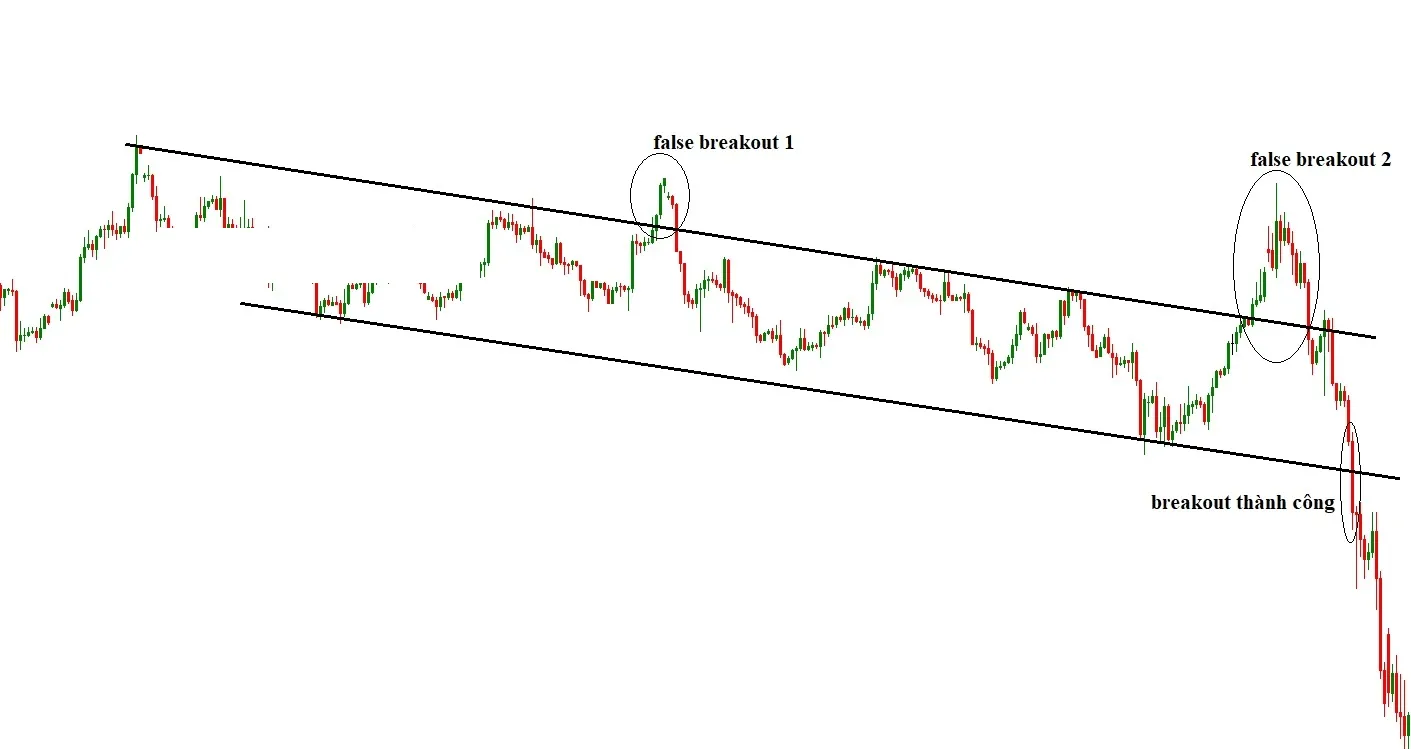
In a downtrend, price cleared the trendline of the trend 2 times, but after only a few sessions it went back inside and carried on with the downtrend; those were 2 false breakouts of price. At the 3rd time, price really broke the lower trendline of the trend, which at that point was playing the part of an important support level. This successful breakout did not reverse the current trend, but it did start a new downtrend with a wider fall, and the trendline of the new trend is steeper too.
Example 3: price broke out successfully but paid little and risked a lot
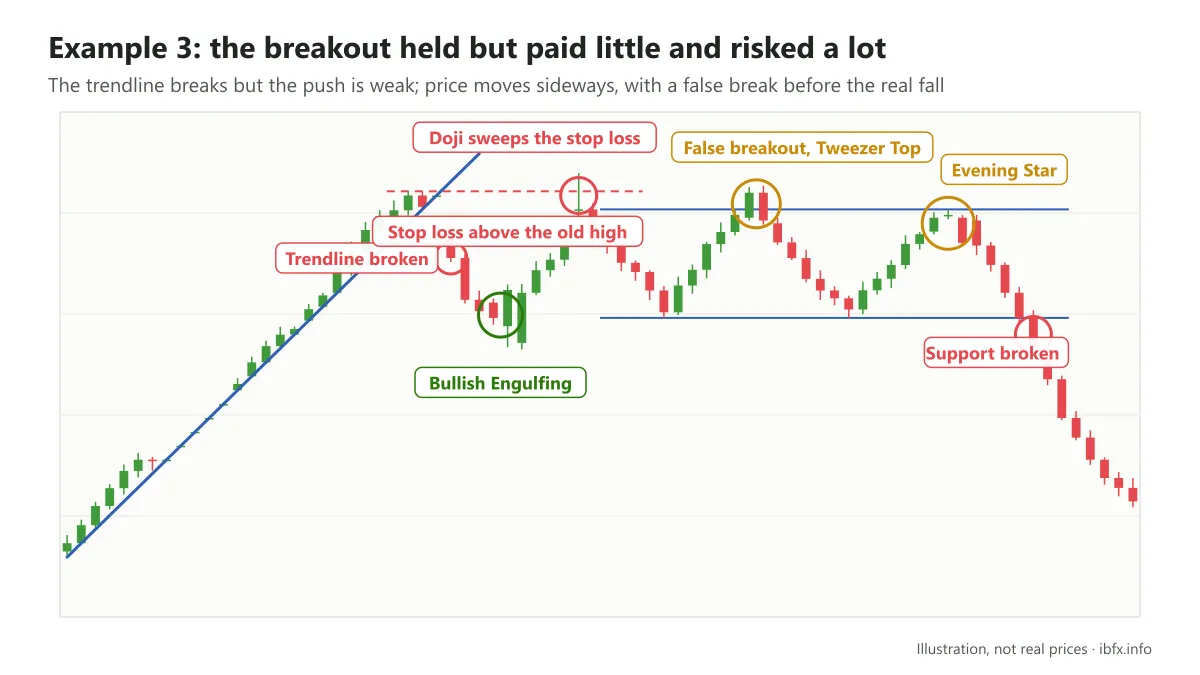
First, price breaks the trendline of the uptrend successfully and the market reverses downward. The force of the break, however, is not strong enough, so price only goes down part of the way and then turns back up. If you entered a Sell at the break point and then took profit on the bullish reversal signal from the Bullish Engulfing pattern, the profit you brought back is not high. The other way round, if you did not see the reversal signal and held the trade on because you hoped price would go deep in the direction of the break, your trade may have had its stop loss swept by the Doji candle, if you had put the stop right above the highest high of the uptrend before it.
In this case, after the successful break with a weak push, price went on to form a sideways market. Inside this sideways range, price formed a false breakout when a green candle closed outside the resistance level. If you were impatient and entered a Buy when that candle finished, your trade lost money, because the day after it a red candle showed up and formed the bearish Tweezer Top reversal pattern.
After holding inside the sideways range a while longer, price formed an Evening Star pattern, which gives a bearish reversal signal; entering a Sell here gives the best entry price. If you waited longer, price then broke the support level successfully and fell sharply, and a Sell entered at that point still made money. Note: looking back at the chart once everything has happened is easy, but while it is happening you cannot know for sure which break is the real one.
Signs of a breakout and a false breakout
What matters is how to tell whether price will break out successfully, or how to avoid the false breakouts.
First, no forecast can ever be 100% certain. Even once price has closed outside the important price levels it can still turn back inside only a few sessions later. Although nobody can be 100% sure price will break out successfully, there are signs that let traders tell whether the chance of a successful break is high or low.
- One, the chance of a successful break usually comes with high trading volume.
A strong push by one of the 2 sides, buyers or sellers, is confirmed by the trading volume at that moment against the average volume over the most recent stretch before it. If the trading volume is much higher than the average, the chance of a successful break is higher, and the other way round.
High trading volume shows that sellers or buyers really did take part in force, but it is no promise that price will go on. Note: forex has no central exchange, so there is no common trading volume; the Volume indicator on MT4 is only the number of price changes (tick volume) at your own broker, and it is for reference only. See also: What is volume?
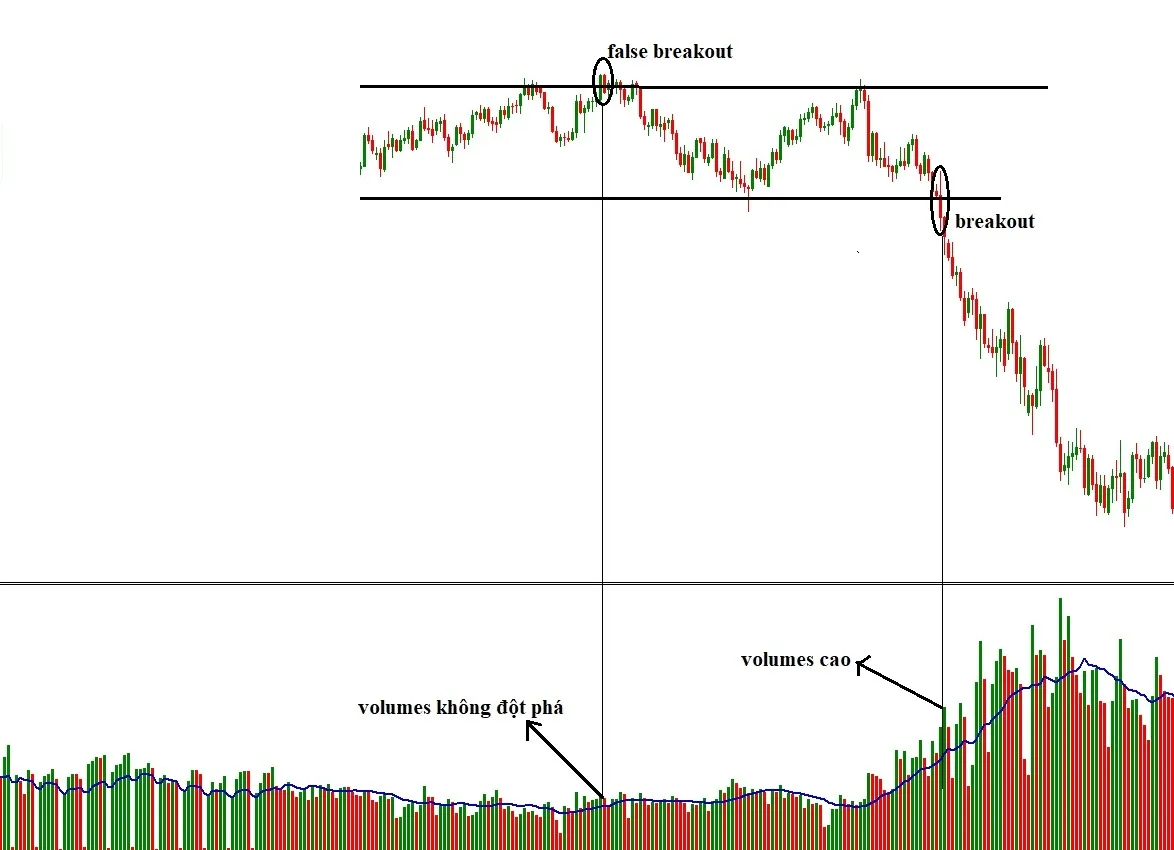
The screenshot shows the Vietnamese interface; the buttons and labels sit in the same places in the English version.
In the false breakout the trading volume did not change much from the volume before it, while in the successful breakout the trading volume rose quickly.
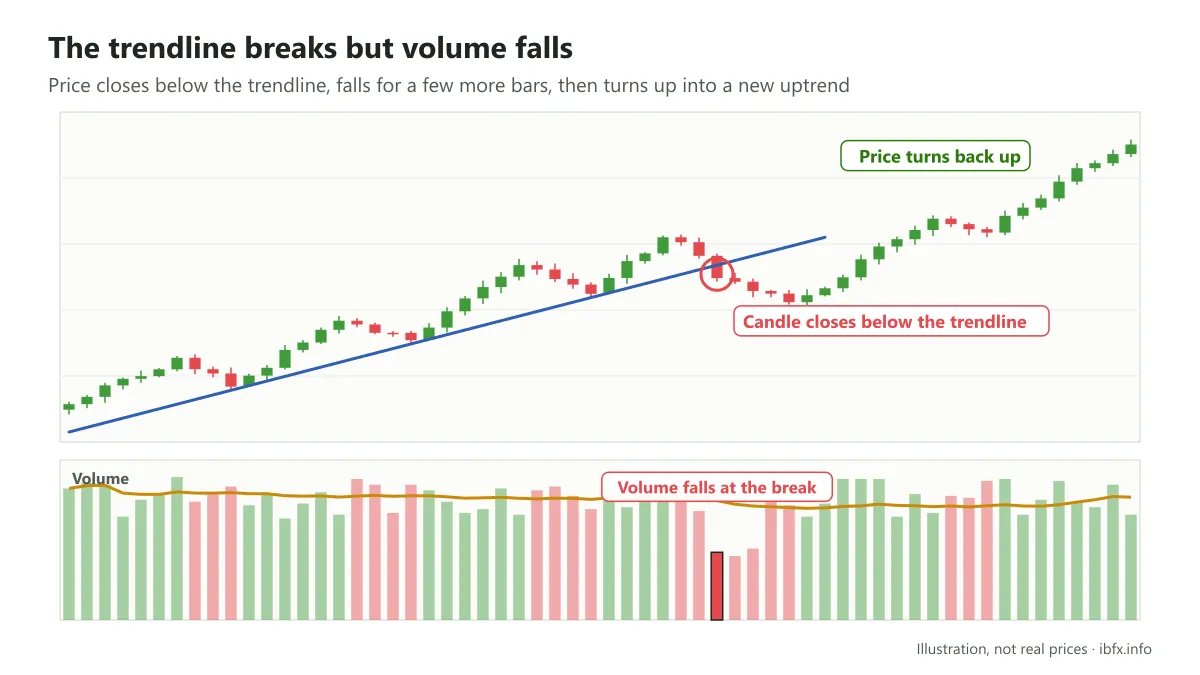
In this situation, you would have thought price would break out successfully, because after the candle closed below the support level the market went on with a run of falling sessions. Right at the moment of the break, however, the trading volume not only failed to rise but actually fell against the sessions before it, and the result was that price went up right after and formed a new uptrend.
- Two, after a breakout price usually comes back to the support or resistance level to retest it before moving in the direction of the break.
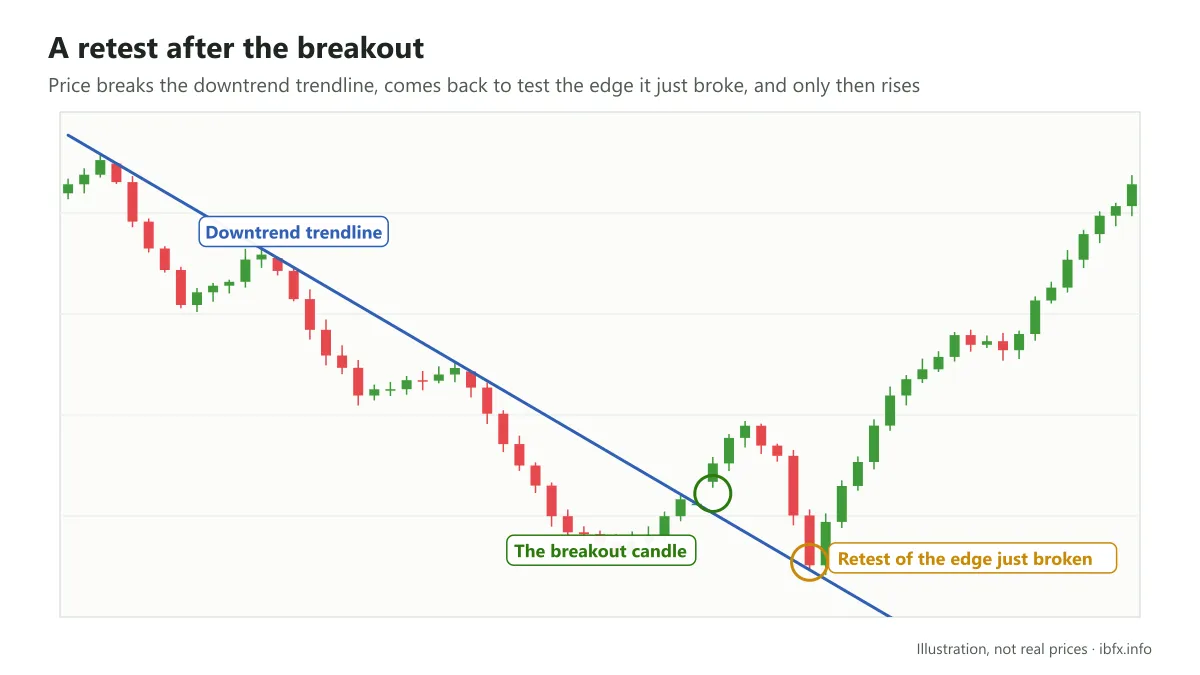
A retest of price works as a firmer confirmation of the breakout. In practice price may retest the support or resistance level after only 1-2 sessions and then carry on in the direction of the break; sometimes the retest takes longer, and there are cases where price retests more than 1 time before it properly moves with the breakout. And usually traders enter after price has retested rather than right at the moment of the break.
That said, there are plenty of cases where price moves in the direction of the break straight after the breakout without retesting, and if you wait for a retest to enter you may miss the chance to enter at all.
- Three, the breakout signal is usually confirmed by technical indicators.
Traders often use the reversal signal from technical indicators to confirm the break in price. One of the most used signals is divergence on oscillators such as RSI and Stochastic.
- A bearish divergence: when price makes a higher high than the high before it but the indicator makes a lower high than the high before it.
- A bullish divergence: when price makes a lower low than the low before it but the indicator makes a higher low than the low before it.
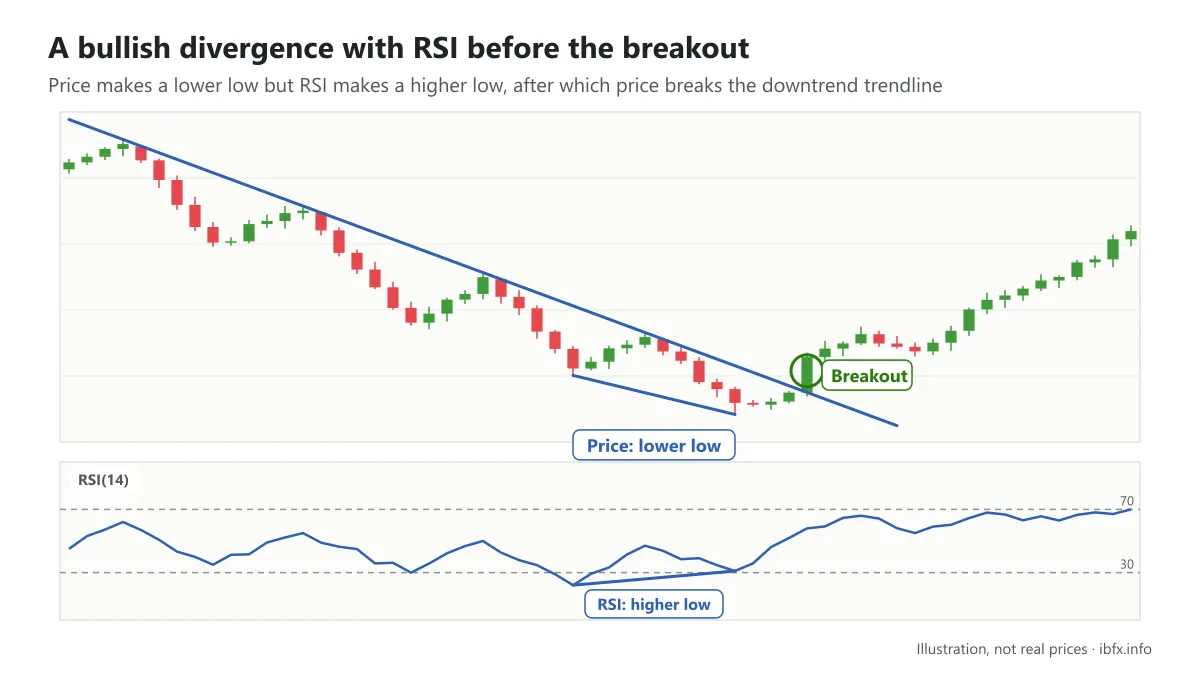
Before price broke the resistance level, a bullish divergence appeared between price and the RSI indicator, a signal pointing to price reversing upward. This signal added to the case that price would break out successfully.
In practice, the more signals confirm the breakout the higher the chance of a successful break usually is; you can combine all 3 signals above, but nothing is certain even then.
Besides that, to limit the risk of trading a false breakout you need to identify the support and resistance levels of the sideways accumulation zone correctly, or draw the trendlines of the trend correctly. Only then does telling a real breakout from a false one work better. There are 2 things to keep in mind about this.
- Do not force the trendlines or the support and resistance levels to fit what you want. They have to be lines that run through the highs and the lows, and a strong barrier has to have price turning back at it at least 3 times.
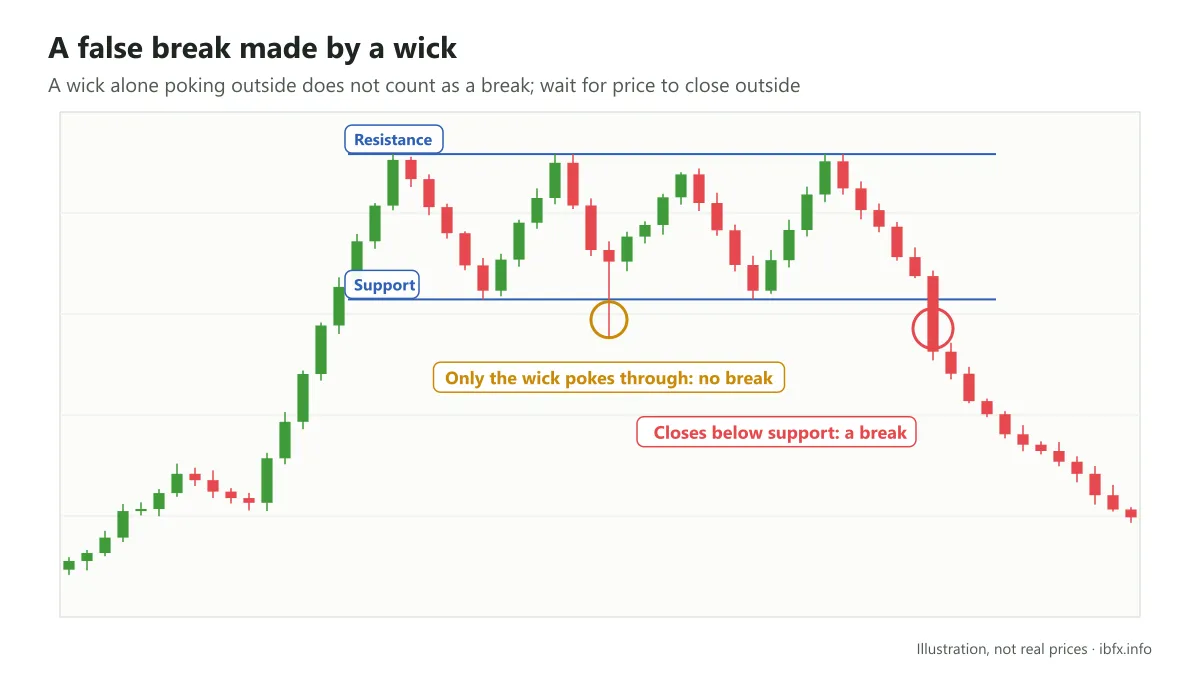
- Many traders set support, resistance or a trendline by the closing prices rather than by the highs and the lows, because a great many false breakouts are made by wicks. Only when price closes outside the support or resistance level should you go on to weigh the chance of a successful breakout; if only a wick pokes outside, treat it as price not having broken out.
How to trade a breakout
Trading a breakout goes through these basic steps:
- Step 1: identify the current trend of the market: sideways, up or down
- Step 2: draw the trendline or the support and resistance levels for that trend
- Step 3: spot the breakout signal: price closes outside the support or resistance level
- Step 4: confirm the breakout signal with volume, a retest or a technical indicator
- Step 5: enter if the chance of a successful breakout is high, and set the stop loss and the take profit.
Of these 5 basic steps, the first 4 have already been woven into the sections above; as for the entry step, each kind of breakout has its own strategy for entering, placing the stop loss and taking profit.
For a breakout of a sideways accumulation zone or a breakout of the trendline of an uptrend or a downtrend, the way you enter and take profit or loss is the same.
There are 3 ways to enter:
- Way 1: enter as soon as the breakout bar closes. This way gives the best entry price if the break is real, but it also runs into the most false breaks.
- Way 2: enter at the close of the confirming candle right after the breakout bar. If the break is upward the confirming candle is a green candle, and the other way round.
- Way 3: wait for price to retest the support or resistance level and only then enter.
Way 1 can always be carried out; ways 2 and 3 may not, because the confirming candle or the retest does not show up after price breaks out.
Placing the stop loss and the take profit
- For a sideways accumulation zone: when price breaks up (a Buy), put the stop loss below the resistance level just broken (which now plays the part of support), or, more safely, below the low of the breakout candle; when price breaks down (a Sell), put the stop loss above the support level just broken or above the high of the breakout candle.
- For a breakout of the trendline of a trend, put the stop loss below the nearest low before it (a Buy) or above the nearest high before it (a Sell).
- Take profit when you have reached your profit target or when a signal that price is reversing shows up.
- Work out the position size from the distance to the stop loss, so that if you lose you only lose a small part of the account (1–2%, for example).
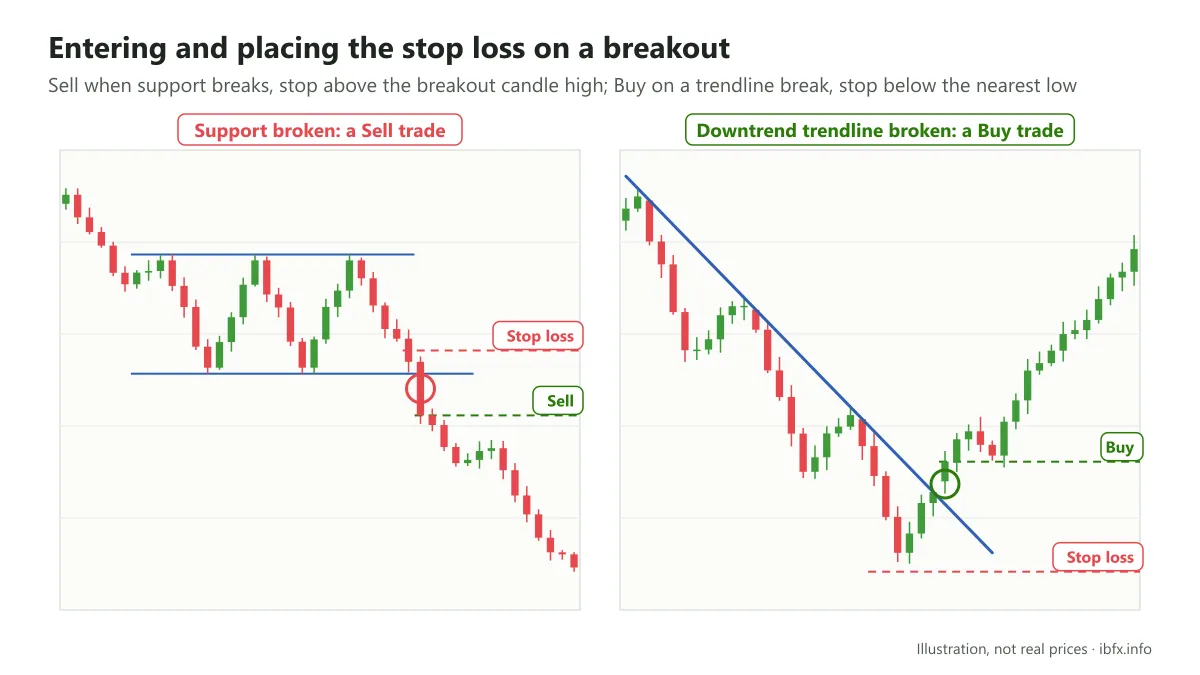
For breakouts of price patterns, each price pattern has its own way of being traded, and you can learn about them through each price pattern.
See the articles on price patterns below:
- The rising wedge and the falling wedge
- The double top and the double bottom
- The triple top and the triple bottom
- Head and shoulders and inverse head and shoulders
Final thoughts
Breakouts happen often in the market, on every financial trading instrument. As said above, however, trading breakouts is far from simple because false breaks are very common, especially for a new trader. You need to practice on a demo account, wait for a confirming signal, and do not forget money management so that you do not blow up an account on a breakout.