On this page
Price action is a way of analyzing the market straight from what price does on the chart, and one of the important tools of that method is the Japanese candlestick pattern. In an earlier article we went through reversal candlestick patterns; this time we will introduce you to the Marubozu candle, a candle often treated as a continuation signal and watched by a good many price action traders.
What is a Marubozu candle? How to spot one and what it means
What is a Marubozu candle?
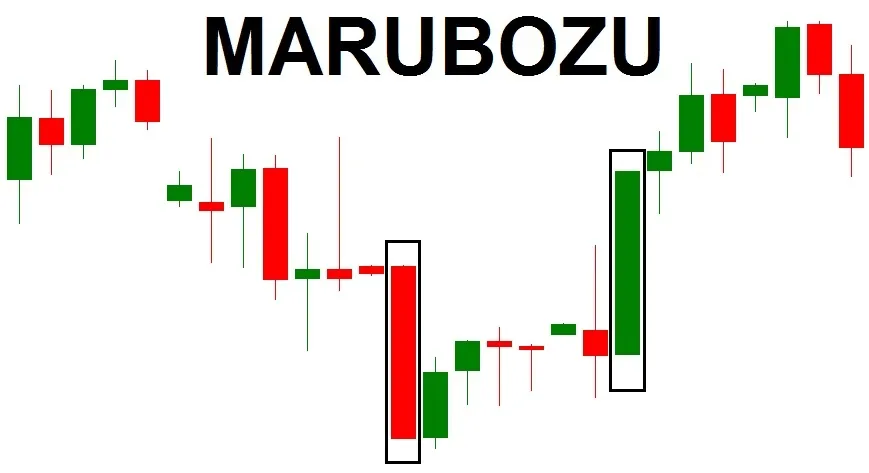
The Marubozu candle also goes by the name “power candle”, because it shows the overwhelming, one-sided strength of a single side (buyers or sellers) during the session that formed the candle. Marubozu in Japanese means “bald”, simply because this candle has no wick at all: its high and low fall on the same levels as the close or the open of the session. A Marubozu can appear at any point of a strong uptrend or downtrend, signalling that the trend carries on, or it can appear at the end of an accumulation or distribution phase, signalling that the market is starting a new trend.
The Marubozu pattern is used widely across financial markets driven by supply and demand: stocks, forex, crypto, commodities and so on.
How to spot the pattern
A Marubozu is a single-candle pattern, made of just 1 signal candle with the following features:
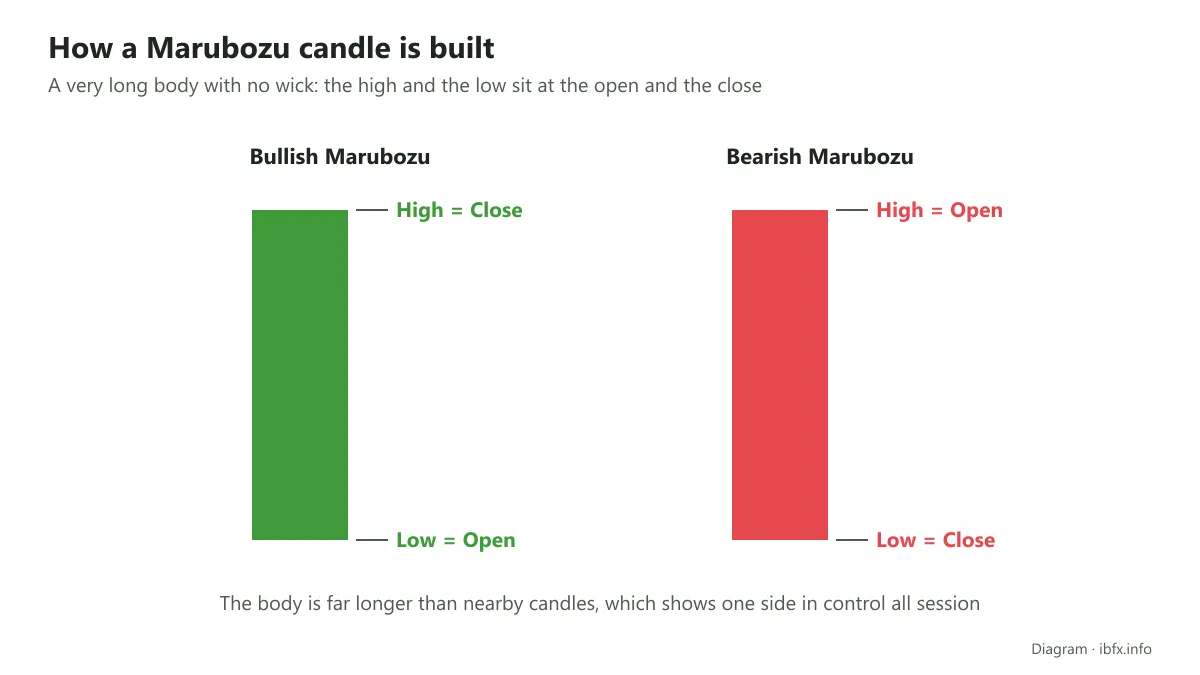
- A very long body, usually much longer than the bodies of the candles near it (some traders use a rule of thumb: longer than the previous 5 candles).
- No upper wick and no lower wick, or if there is one, it is very short.
- A bullish Marubozu has its high at the close and its low at the open. A bearish Marubozu is the other way round: its high is at the open and its low is at the close.
The features above are the features of the basic Marubozu pattern.
What the Marubozu pattern means
The basic Marubozu pattern splits into 2 types: the Bullish Marubozu and the Bearish Marubozu.
- Bullish Marubozu
This is the basic rising Marubozu. A bullish candle with a very long body and no wick shows that throughout the session buyers had the upper hand completely, with no hesitation between the two sides. A Bullish Marubozu shows buyers overwhelming sellers for the whole session (even though every trade still has a buyer and a seller), buying pressure is very strong, so buyers are likely to stay on top in the sessions that follow.
- Bearish Marubozu
This is the basic falling Marubozu. A Bearish Marubozu has a long bearish body and no wick, which shows sellers had the upper hand completely through the session while buying was weak. Selling pressure is strong, so sellers are likely to keep the upper hand in the sessions that follow.
The Marubozu and its variants
Besides the basic Marubozu pattern, this candle also has other variants: power candles with a short wick that appears on one side only, either above or below.
The Bullish Marubozu with a wick
This is the basic rising Marubozu plus a wick above or below the body, but not a meaningful one.
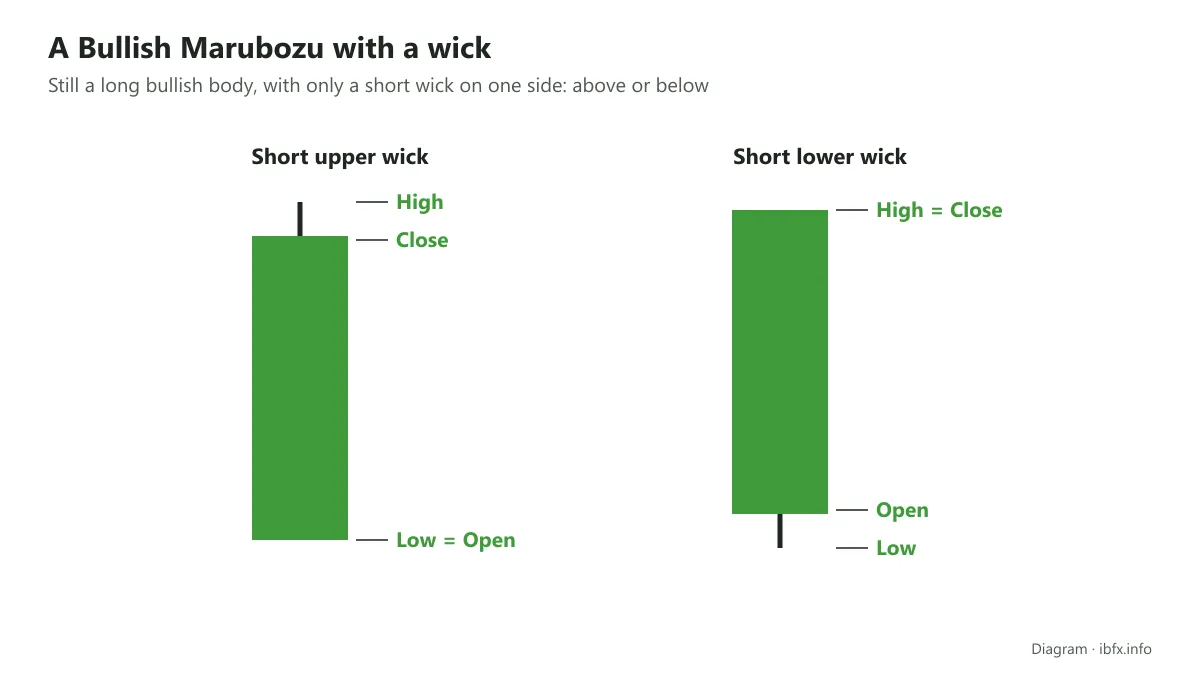
- Bullish Marubozu with an upper wick: from the very start buyers had the upper hand, pushing price up without a break, and no lower wick formed until the end of the session. Towards the close, sellers tried to push price down to catch the top, but not by much because buying was too strong, which is why there is an upper wick, though a fairly short one. Even though buyers were not in complete control from start to finish, this Bullish Marubozu still shows buying pressure is very strong, and price may well keep rising in the sessions that follow.
- Bullish Marubozu with a lower wick: early in the session, or in the middle of it, sellers tried everything to push price down against the strength of buyers; price did drop below the open, but not by much, which is why the lower wick is very short. Because buying was stronger, price was driven up to the close, and there is a good chance price keeps rising in the sessions ahead.
The Bearish Marubozu with a wick
This is the basic falling Marubozu with an upper or lower wick, but not a meaningful one.
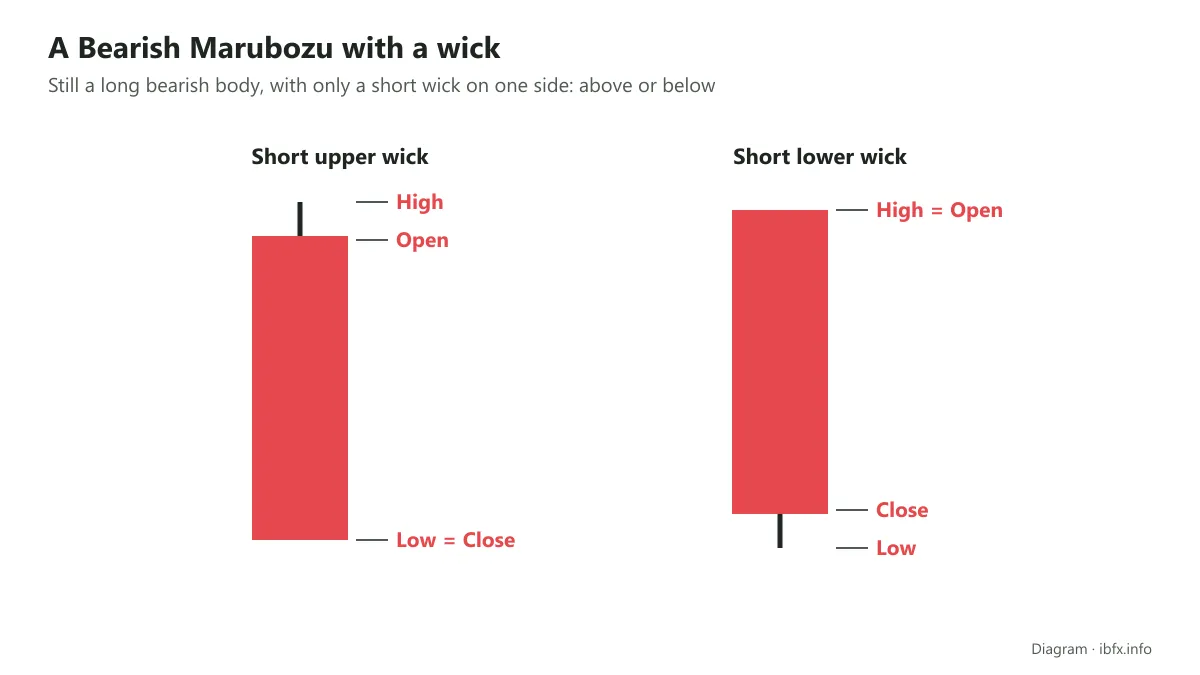
- Bearish Marubozu with an upper wick: at first buyers tried to push price up, but buying was not big enough, so price rose only slightly before being dragged back down, and the proof is the very short upper wick. Selling was stronger, so price fell to the close. Even though they did not have the upper hand for the whole session, sellers seem to have beaten buyers outright, and sellers are likely to stay on top in the sessions that follow, with the market heading down.
- Bearish Marubozu with a lower wick: near the close, buyers tried to push price up to catch the bottom but not by much, which leaves a lower wick, though a very short one. Sellers can still have the upper hand in later sessions.
How to trade the Marubozu candle
A Marubozu at a support or resistance level
One particular use of this pattern is that the High, Low, Open and Close of a Marubozu are often watched as support or resistance levels for price.
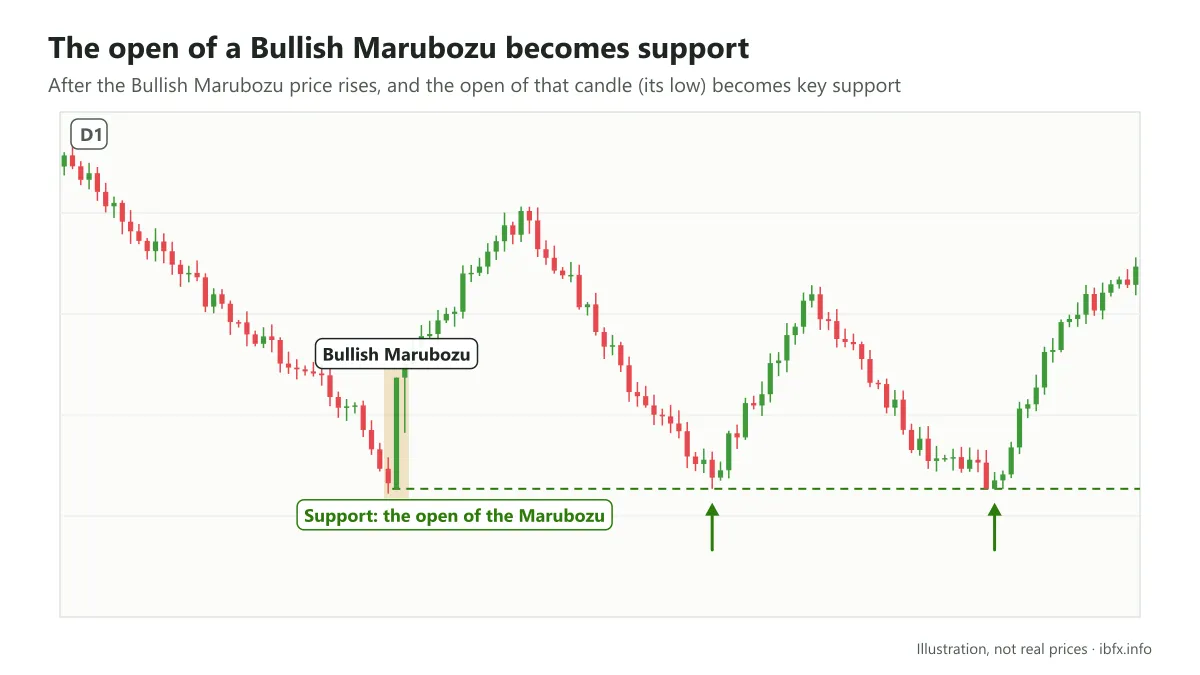
In this case, after the Bullish Marubozu forms, the market moves up, and at the same time the open of this candle ( = its low) becomes an important support level for price in the future.
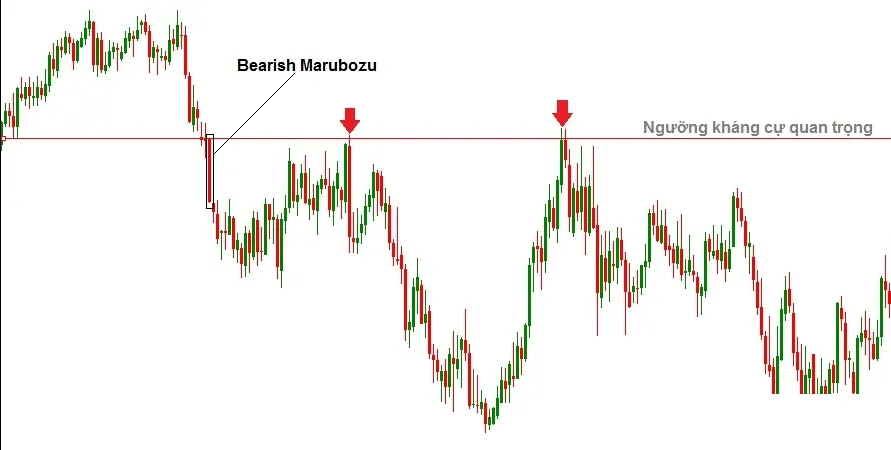
The screenshot shows the Vietnamese-language interface; the buttons and labels sit in the same places in the English one.
After a Bearish Marubozu appears, the market moves down, and at the same time the high of the Marubozu ( = its open) now acts as an important resistance level for price in the future.
The Marubozu as a continuation pattern
If a Bullish Marubozu appears in an uptrend, that is a sign the uptrend may carry on. If a Bearish Marubozu appears in a downtrend, that is a sign the downtrend may carry on.
How to trade it
- Work out the overall trend the market is in at the moment: you can see it by eye when you zoom the chart out, or use tools such as a trendline, a price channel, a moving average and so on.
- When a Marubozu appears, enter a Buy or a Sell as soon as the session that formed the Marubozu ends, or wait for price to retest the support or resistance level made by the levels of the Marubozu.
- For a Bullish Marubozu in an uptrend, enter a Buy when price breaks the high of the Marubozu after the retest.
- For a Bearish Marubozu in a downtrend, enter a Sell when price breaks the low of the Marubozu after the retest.
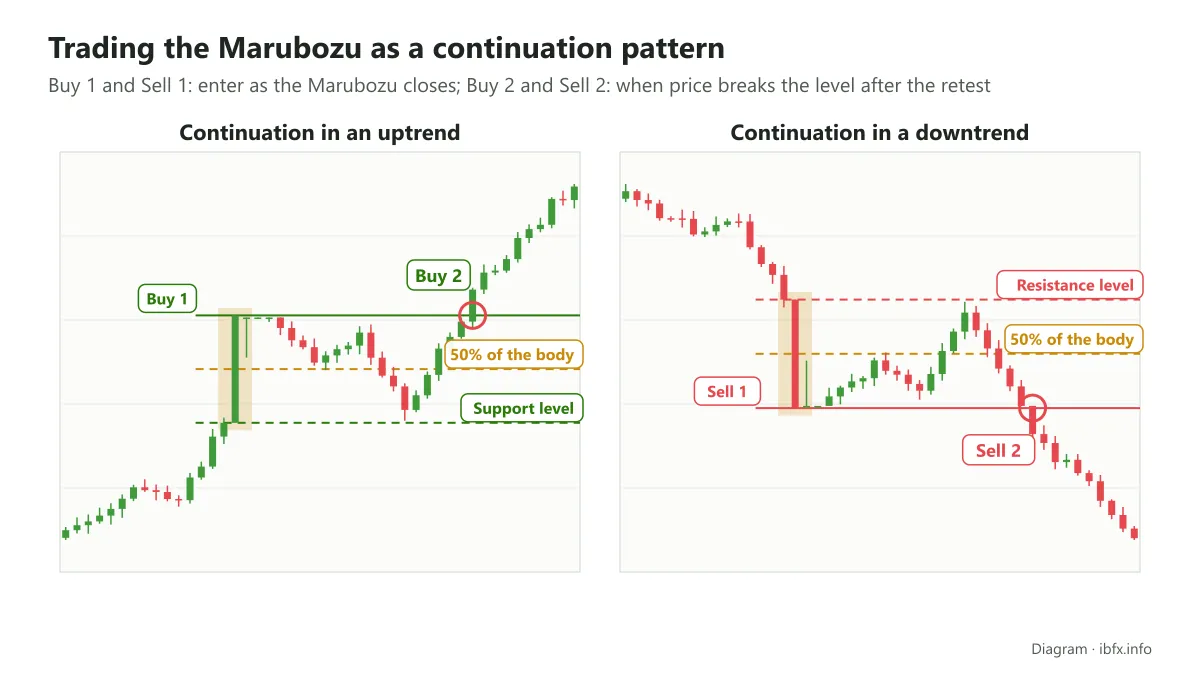
Note: when price retests the Marubozu, it may only retest the level that matches 50% of the length of the body, or a level somewhere between 50% and the support or resistance level.
Placing a stop loss: for a Buy on a Bullish Marubozu, the stop loss usually goes below the low of the candle; for a Sell on a Bearish Marubozu, it goes above the high of the candle. Because a Marubozu body is very long, the distance to the stop loss is usually wide, so you need to cut your position size to match, to keep the amount you can lose within what you allow yourself (1–2% of the account, for example). Some traders place the stop loss at the 50% level of the body to keep it closer, and in exchange it gets taken out more easily.
In the trading diagram above, Buy 1 and Sell 1 match the entry taken when the Marubozu closes. Buy 2 and Sell 2 are the entries taken when price breaks the support or resistance levels (the levels that match the low or the high of the Marubozu) after the retest.
Example: 1
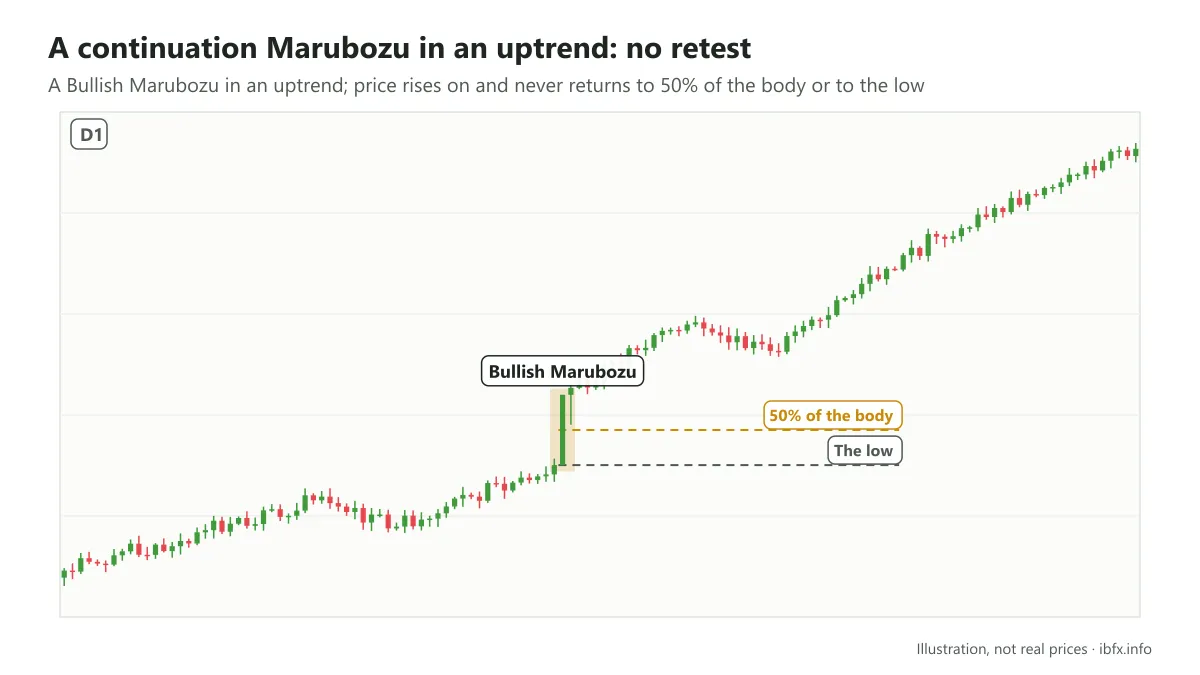
A Bullish Marubozu appears in an uptrend, price keeps rising afterwards and never retests the important levels such as the support made by the low of the Marubozu or the level that matches 50% of the body.
Example 2
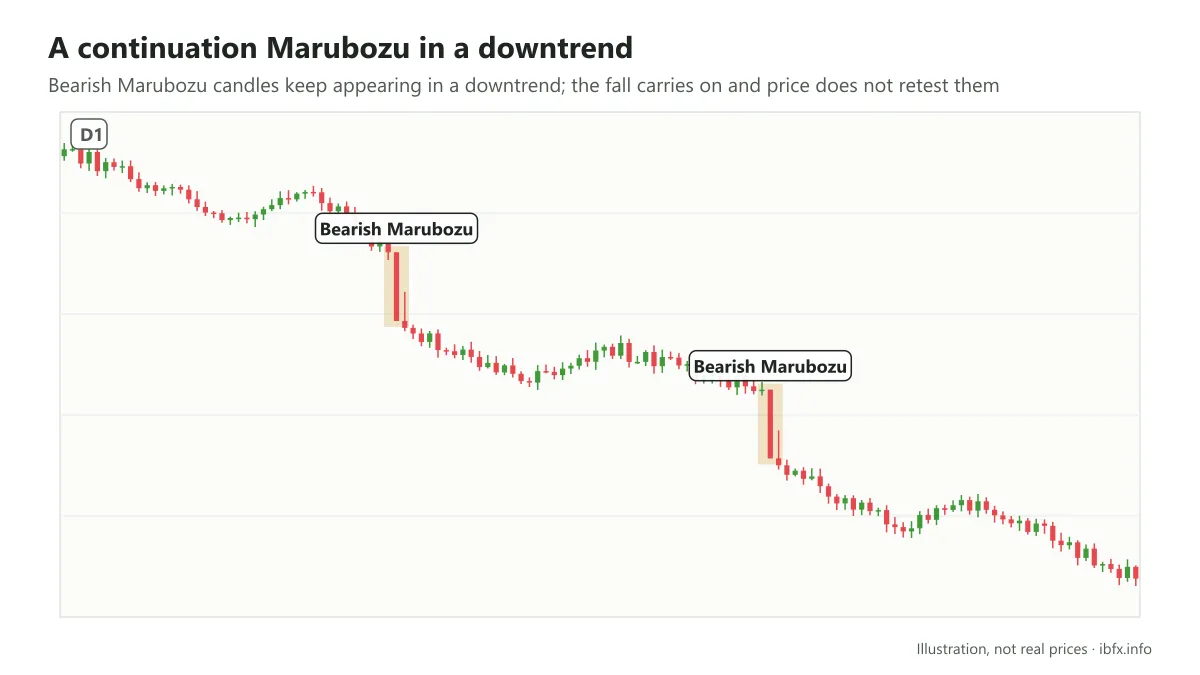
Bearish Marubozu candles appear one after another in a downtrend, and afterwards the downtrend carries on. Price does not retest the Marubozu.
Example 3
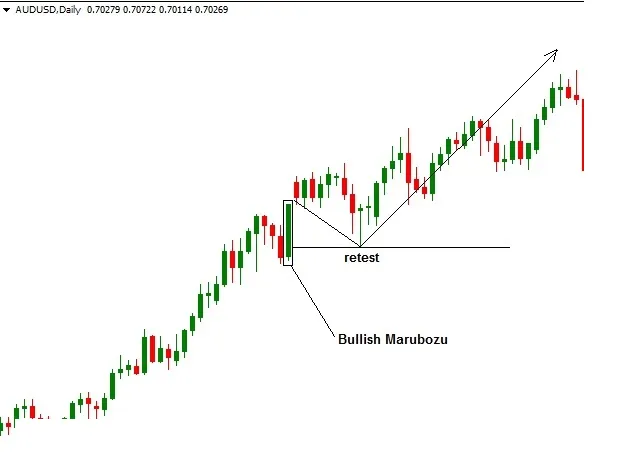
In this case price does retest the Marubozu, but not at the basic levels such as 50% of the body or the support level; it retests at levels that sit between the two.
Trading a breakout with a Marubozu
When price breaks through important price zones, it often runs on in the direction of the break. If price breaks a support level or a distribution zone, the market may start a downtrend; if price breaks a resistance level or an accumulation zone, the market may start an uptrend. If the breakout bar is a Marubozu, the breakout signal is usually treated as stronger, but a false break can still happen.
How to trade it
- Work out the strong support and resistance zones. Usually, while price is in an accumulation phase (it can move sideways, up or down, but the rise or fall is small), important support or resistance levels form. You can find these levels with a trendline.
- When a Bullish Marubozu clears a resistance level plainly, enter a Buy at the close of that candle, or wait for price to retest the resistance zone.
- When a Bearish Marubozu clears a support level plainly, enter a Sell at the close of the candle, or wait for price to retest and break the support once more.
Example 1:
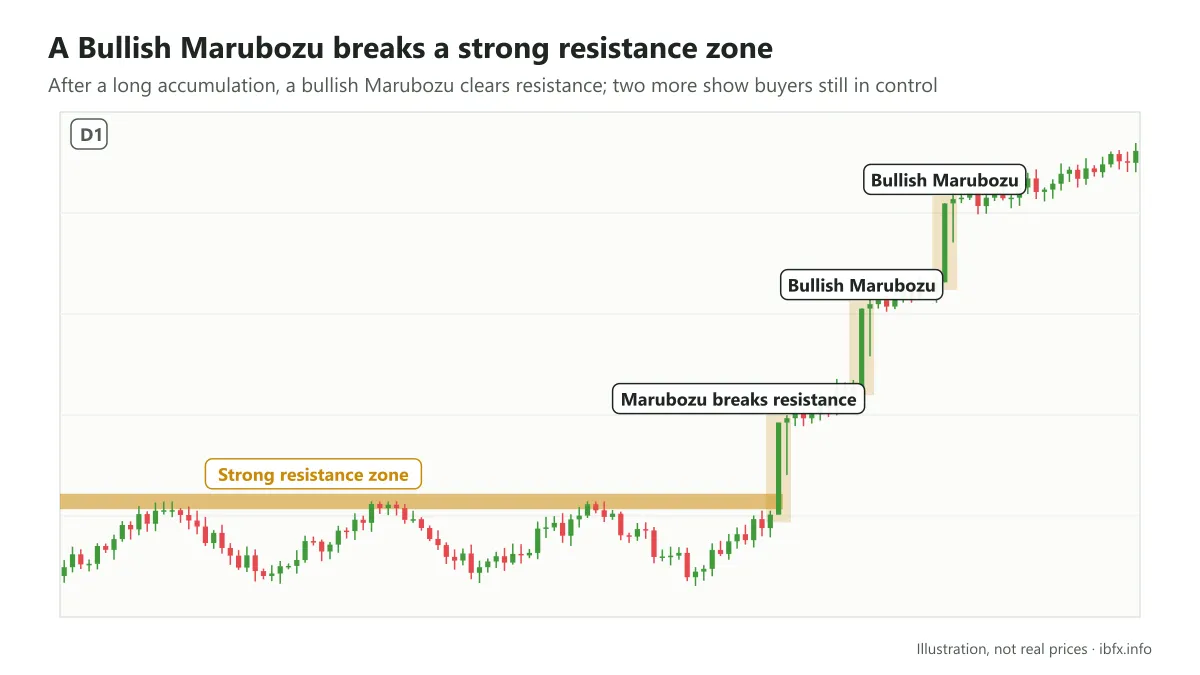
After price accumulates for quite a long stretch, a Bullish Marubozu appears and clearly breaks the resistance of this zone, and a new uptrend forms. Right after that, the market forms 2 more Bullish Marubozu candles, which shows the uptrend is being reinforced and the strength behind it is still very much there.
Example 2
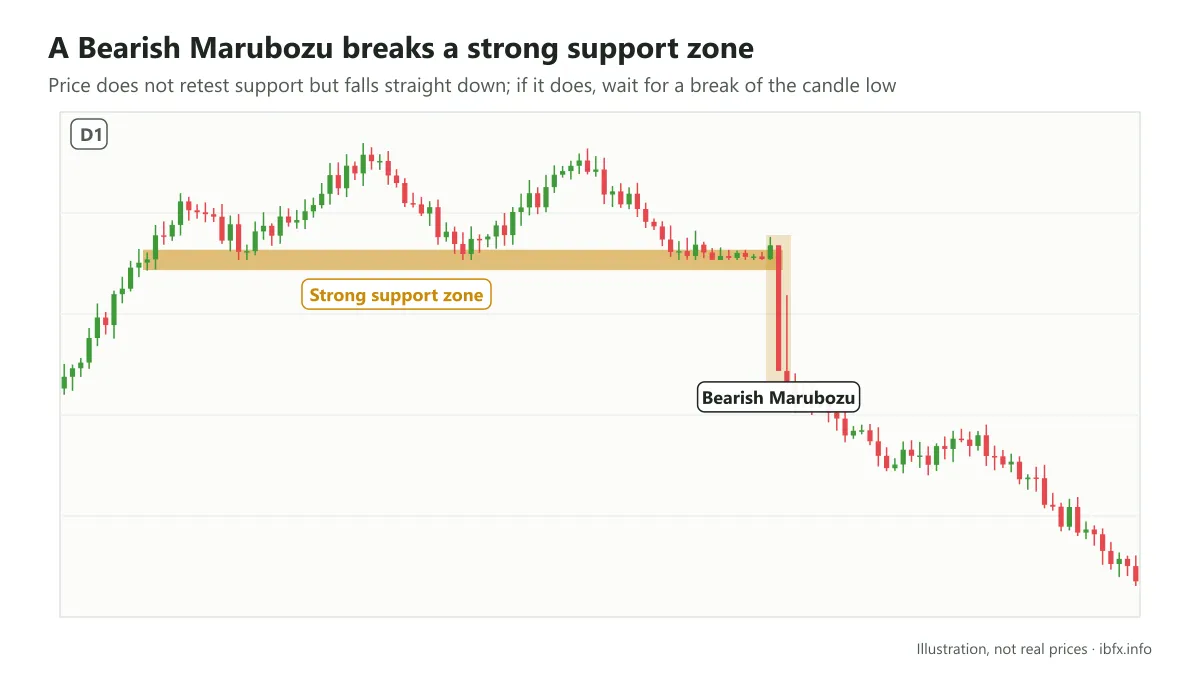
In this case, and in the one above too, price does not retest the support or the resistance but goes straight down, or straight up.
Example 3
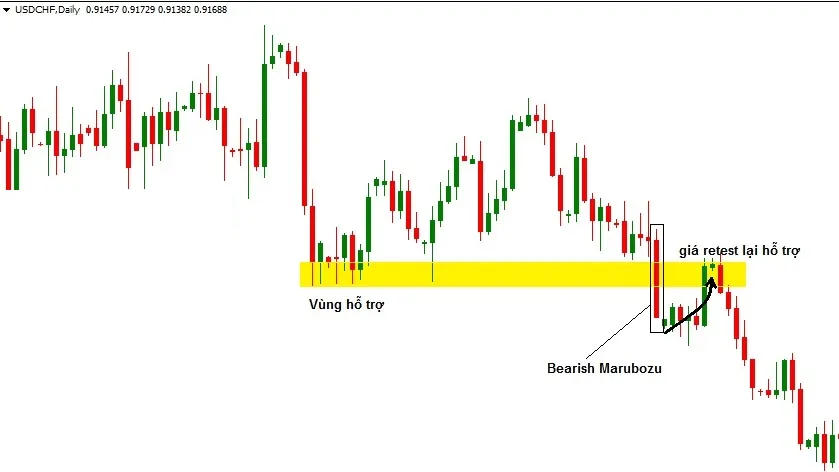
The screenshot shows the Vietnamese-language interface; the buttons and labels sit in the same places in the English one.
After a Bearish Marubozu breaks a support zone, price does not fall straight away but retests the zone once more before it really heads down. In this case you can enter when price breaks the low of the Marubozu after the retest.
Signals from the Marubozu pattern are fairly strong and work in plenty of cases, but of course those signals are not always right and the market does not always move the way a trader expects. As with any other candlestick pattern, to make the Marubozu more reliable you should add a few other tools and methods to confirm the signal it gives. Tools commonly used to confirm a Marubozu signal include the moving average (if the Marubozu appears within an uptrend or a downtrend and touches moving averages that are acting as support or resistance for that trend, the continuation signal is more reliable) and Fibonacci (if the Marubozu appears at important Fibonacci levels, the signal from this pattern is more reliable), and so on.
We hope this article has given you a grip on what the single-candle Marubozu pattern means and how to trade it. Practice spotting it and try the entries on a demo account, keeping a record of the results, before you apply any of it with real money.