On this page
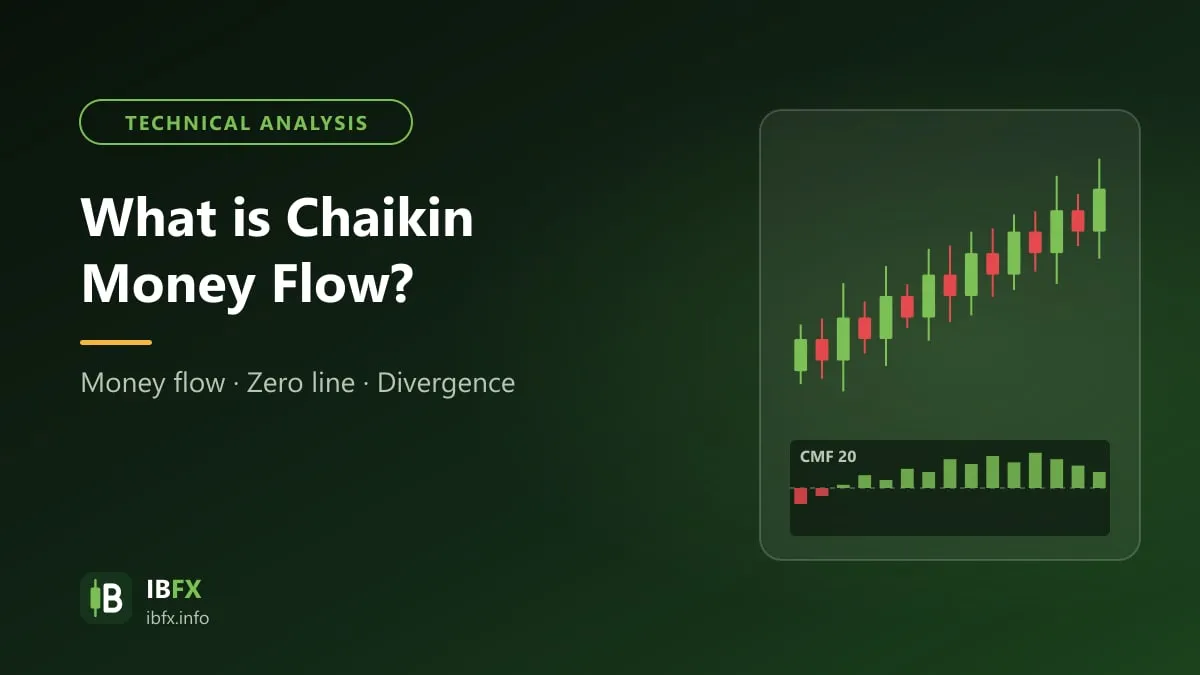
Carrying on the series of articles introducing the indicators, this time it is the turn of one of the better known indicators in the volume family: Chaikin Money Flow. Let us look at what is special about this indicator and at how to put it to work in your trading.
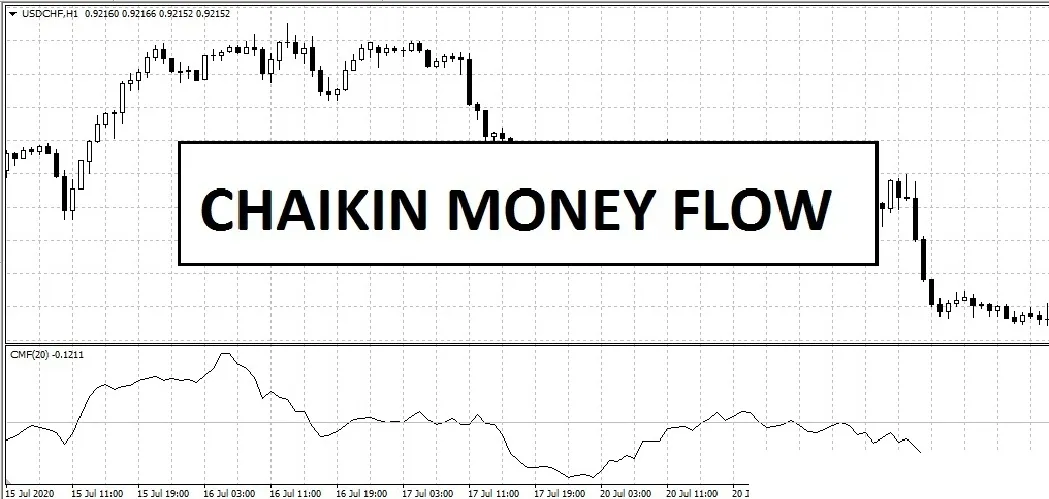
Understanding the idea of money flow volume
What is money flow volume?
Before going deeper into the Chaikin Money Flow indicator, we want you to understand money flow volume, an idea that bears directly on this indicator.
Money flow volume is the amount of money used to trade an asset (to buy and sell it) over a given stretch of time. One thing to say straight away: in forex that figure does not exist. MT4 and MT5 give you tick volume only — the number of price changes — and only for the broker you happen to use, so every volume indicator in forex, the CMF included, runs on a proxy rather than on real money. More precisely, money flow volume tells you how much money was bought and sold in the market over a given period.
Money flow volume shows how much interest investors are taking in the asset being traded. Large money flow volume shows investors are very interested in the asset; the other way round, when investors are not very interested, or are hesitating between decisions, money flow volume falls.
Why money flow volume is worth studying in forex trading
Measuring money flow volume helps a trader judge the push behind the current trend, which gives a further basis for a view on what happens next.
Money flow volume reflects the strength of the trend. When the market is in an uptrend, if volume rises as well, that shows the trend is being supported; if volume falls, traders are hesitating and the trend may weaken or turn. The other way round in a downtrend: volume rising along with the trend shows strong selling; if volume falls, selling is easing off and the market may turn.
Money flow volume measures how liquid the market is. An asset with large money flow volume is one that gets bought and sold a great deal in the market and has high liquidity; the other way round, an asset with small money flow volume is one the market takes little interest in, with low liquidity. Swing traders and day traders pay particular attention to this, because an asset with high liquidity usually has a lower spread, which saves on trading costs.
What is Chaikin Money Flow? Where it came from and the formula
The Chaikin Money Flow indicator (CMF) means exactly that: Chaikin’s money flow. It was developed by Marc Chaikin, who began working on Wall Street in 1966.
Marc Chaikin has worked in the market as a trader, a stockbroker, an analyst and the head of the Options department at a large Wall Street broker. In 2011 Marc Chaikin and his colleagues founded Chaikin Analytics, a platform that provides analysis and stock trading ideas to investors, based on the Chaikin Power Gauge, a model that scores stocks on 20 factors.
CMF is the result of combining price and trading volume to show the money flowing into and out of the market for an asset over a given stretch of time, and from that to judge buying and selling pressure from the way that money flow moves.
The Chaikin Money Flow formula
The default period of the CMF indicator in the software is 20, but traders usually use a period of 20 or 21, and 21 is also the number the man who created the indicator used.
CMF (21) = the sum of money flow volume over 21 periods / the sum of trading volume over 21 periods.
Where:
- Money flow volume for each period = the money flow multiplier x trading volume
- The money flow multiplier for each period = [ (Close – Low) – (High – Close) ]/ (High – Low)
With Close, High and Low being the closing price, the high and the low of each period, or each trading session.
CMF values can be negative or positive, because the money flow multiplier can be negative or positive, and they move between -1 and 1, which is why the horizontal 0.0 line is chosen as the center line of this indicator.
How to set up the Chaikin Money Flow indicator on MT4
CMF does not come with MT4, so you have to download it and install it as a custom indicator. Only download the indicator file from a source you can trust, such as the official MQL5 library from MetaQuotes; stay away from .ex4 files of unknown origin, as they can carry malware. (On TradingView, CMF is there in the indicator list already.)
Once you have downloaded the indicator, unzip it and copy the chaikin-money-flow-indicator file to the clipboard (Ctrl+C), as in the picture below:
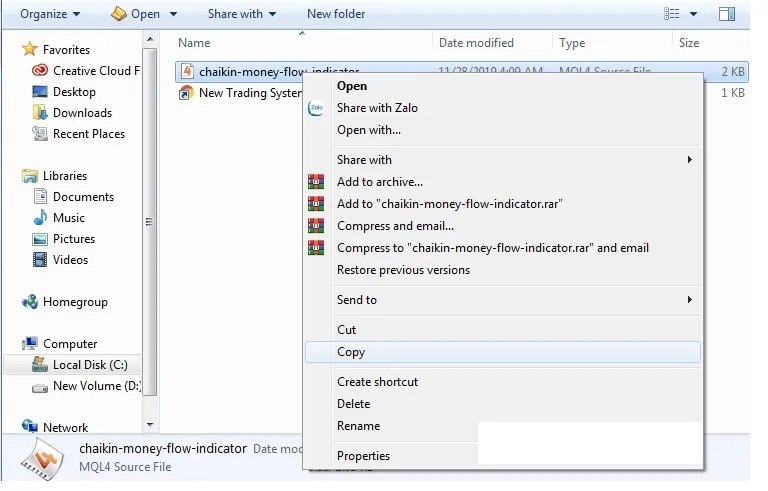
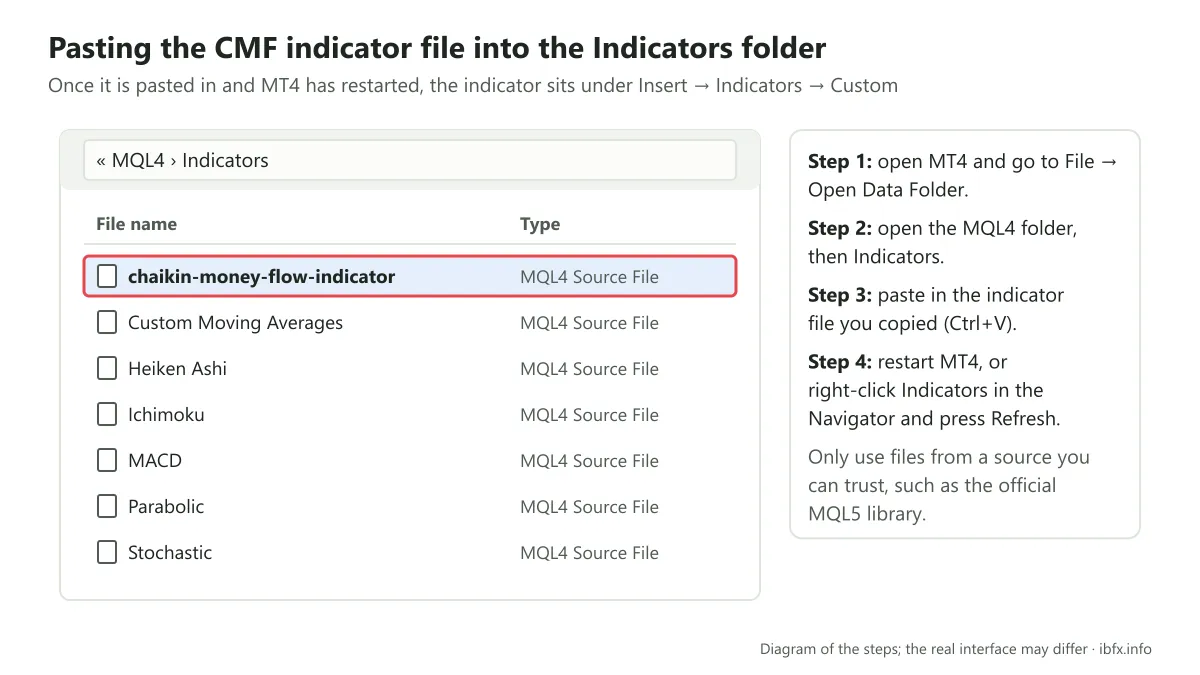
Open MT4, go to File and pick Open Data Folder. When the window appears, pick the MQL4 folder and then Indicators. Then paste the CMF indicator file you copied above into that folder and you are done.
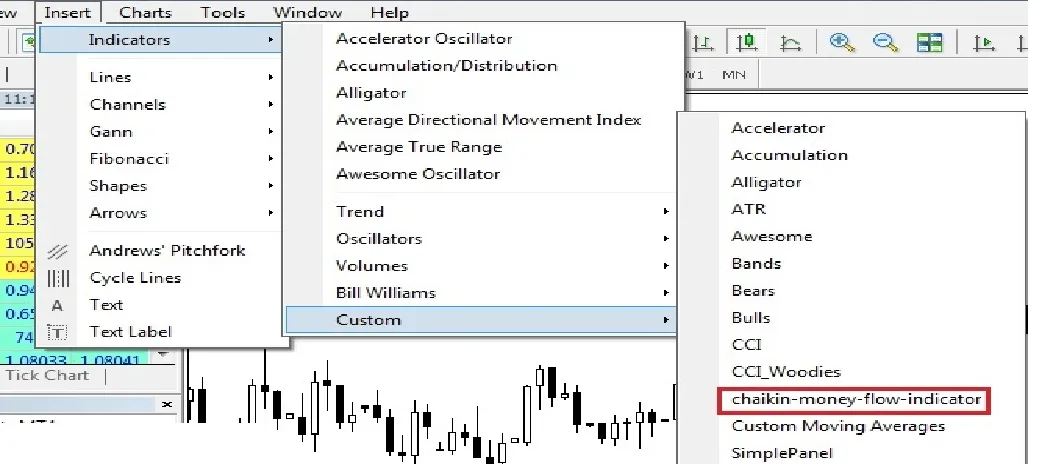
Once you have pasted it in, close MT4 and start it again (or right-click Indicators in the Navigator window and pick Refresh), and the Chaikin Money Flow indicator will appear in the list of indicators, under Custom.
To put the CMF indicator on a chart, follow this path: Insert → Indicators → Custom → Chaikin Money Flow Indicator, as in the picture below:
The settings dialog appears as follows:
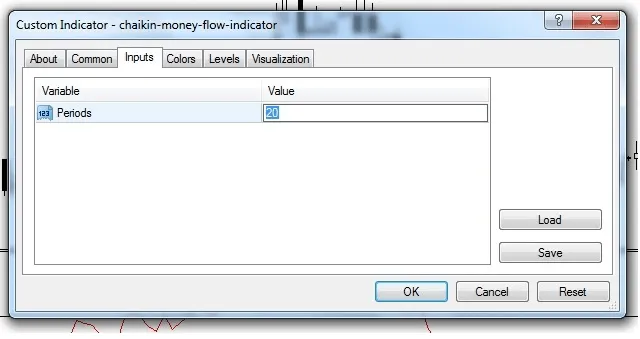
Here you only need to pay attention to the Input, Colors, Levels and Visualization tabs.
- Input: pick the period of the indicator. The system default is 20; to change the period, double-click the number 20, change it to suit your strategy and press OK.
- Colors: pick the color of the indicator
- Levels: add or remove any values you like. Usually, to trade with the CMF indicator, traders add the 0.0 line.
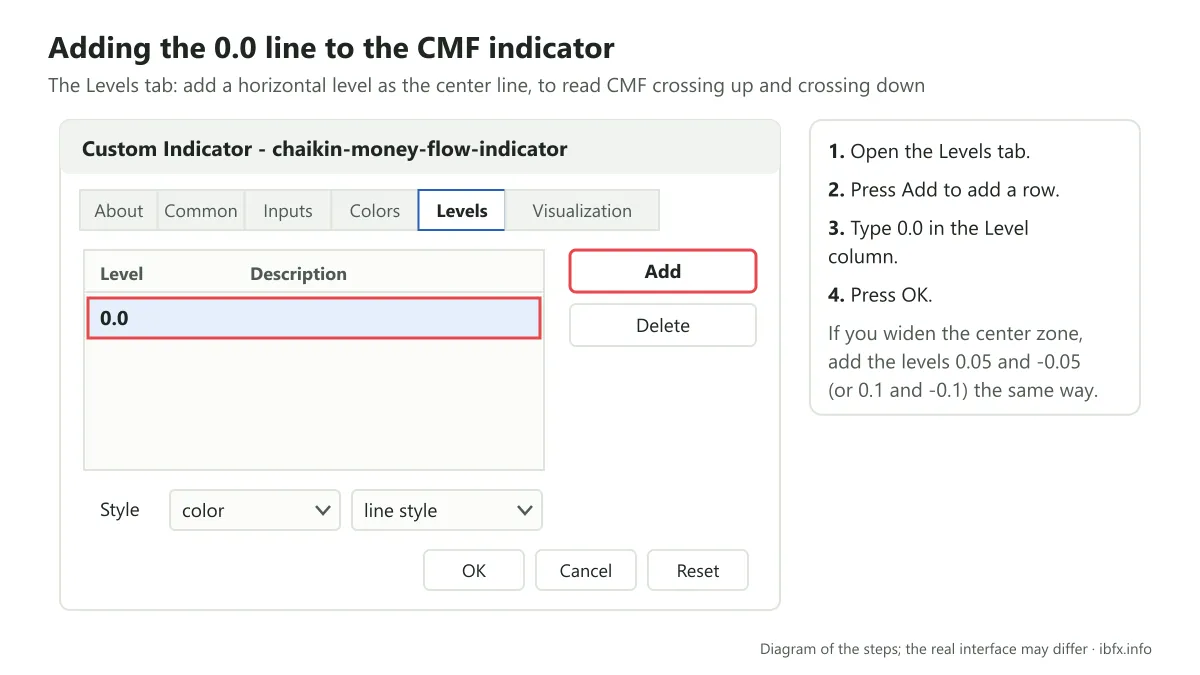
To add the 0.0 line, press the Add button, then type the value 0.0 into the Level column, then press OK.
- Visualization: pick the timeframes the indicator is shown on.
Once you have set the parameters, the Chaikin Money Flow indicator appears on the price chart as in the picture below:
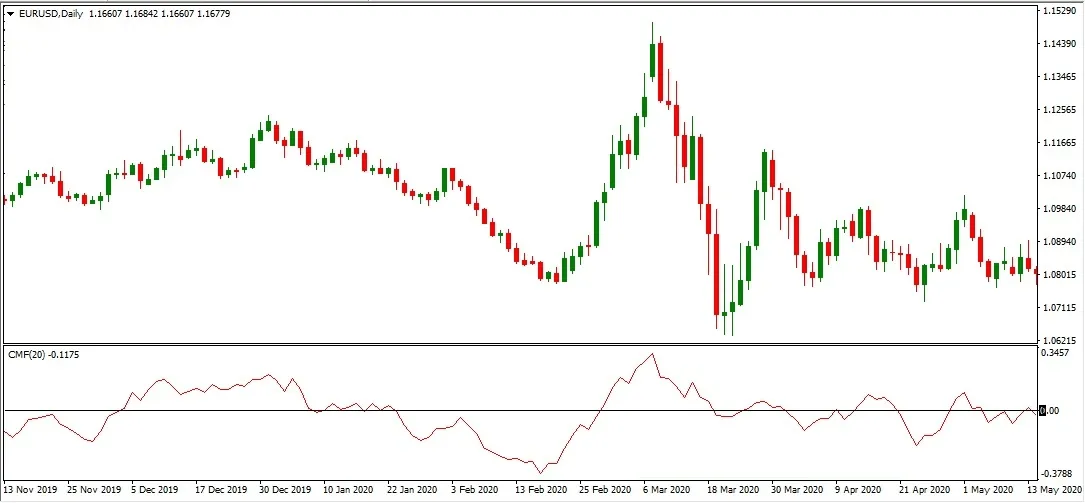
Some points about the Chaikin money flow indicator
Before going into how to trade with the Chaikin Money Flow indicator, let us look at 3 points about it.
First, the idea behind the Chaikin Money Flow indicator is to compare the closing price and volume with the trading range of the asset (the high minus the low), in order to look at the money flow of that asset over a given stretch of time, that is, whether buying pressure or selling pressure has the upper hand. In detail, when price regularly closes in the upper half of the candle’s range on large volume, CMF is positive and rising, which shows buying pressure has the upper hand (usually described as money flowing in). The other way round, when price usually closes in the lower half of the candle’s range, CMF is negative and falling, which shows selling pressure has the upper hand (money flowing out). Keep in mind that every trade always has a buyer and a seller, so CMF is not counting more buyers than sellers.
Marc Chaikin first developed this indicator and used it in stock trading, but today the indicator is still widely used across different financial markets, including forex. Spot forex, however, has no centralized trading volume; CMF on MT4 uses tick volume (the number of times the price changed), so it only reflects money flow indirectly and needs to be read with care.
Second, money flow and price. As the volume indicators see it, money flow is the push behind a rise or a fall in price. In an uptrend, if CMF stays positive and rises along with price, the trend is being supported; if CMF weakens while price still rises, that is a warning sign that the trend may be weakening. The other way round in a downtrend. CMF does not always lead price, though, and these warnings can be wrong.
Third, CMF can be used on many kinds of asset. Because CMF divides the sum of money flow volume by the sum of trading volume, its value always sits between -1 and 1, so you can compare assets with large or small trading volume. Even so, how reliable CMF is depends on the quality of the volume data, and in forex that data is only tick volume.
How do you use the Chaikin Money Flow indicator?
The most basic principle for using the Chaikin Money Flow indicator is to work from where the CMF line sits relative to the 0.0 center line, in much the same way as you would use an oscillator.
- CMF > 0, the CMF line above the 0.0 line → buying pressure has the upper hand (the accumulation phase), so look for Buy trades first.
- CMF < 0, the CMF line below the 0.0 line → selling pressure has the upper hand (the distribution phase), so look for Sell trades first.
Trading with the trend on CMF crossing the 0.0 line
When the CMF line crosses above the 0.0 line, enter a Buy.
When the CMF line crosses below the 0.0 line, enter a Sell.
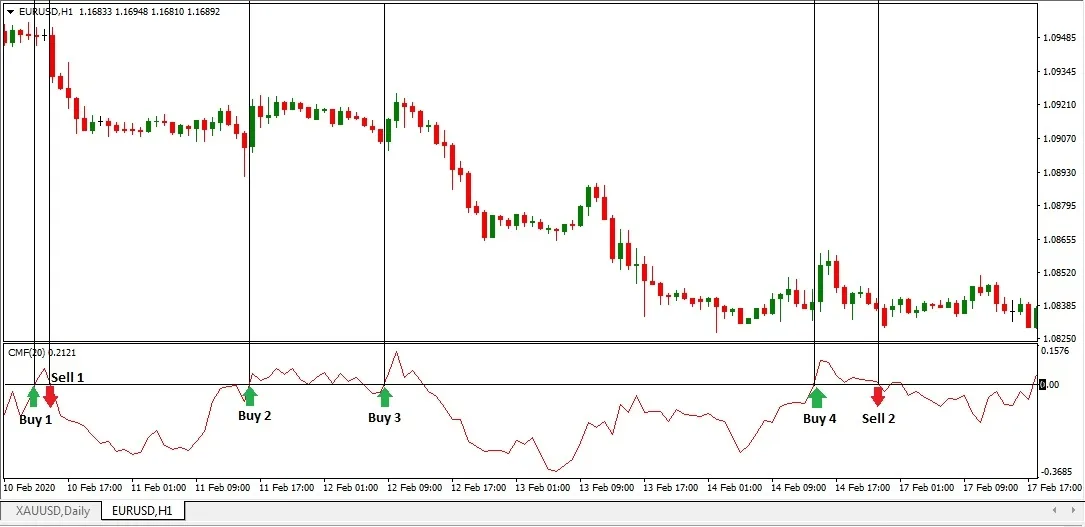
The picture above is EUR/USD on the H1 timeframe. It is easy to see that the CMF line crosses the 0.0 line very often, and that there are a great many false signals among those crossings.
In the picture above, if we take trades on the crossing signals between the CMF line and the 0.0 line, only Sell 1 brings a potential profit; the rest all seem to fail, or where there is a profit it is very small and cannot cover trading costs.
That is why one of the better ways to trade this signal is to trade with the trend. That is, in an uptrend only wait for the CMF line to cross above the 0.0 line to enter a Buy, and in a downtrend only wait for the CMF line to cross below the 0.0 line to enter a Sell.
The trading steps are as follows:
Step 1: work out the overall trend of the market
There are many ways to tell whether the market is in an uptrend or a downtrend; you can use trendlines, moving averages, or simplest of all just look at the price chart, remembering to zoom out to get a fuller picture of the market.
Step 2: enter the trade
With the crossing signal between the CMF line and the 0.0 line, you can also enter in several different ways. For instance:
Way 1: enter a Buy as soon as the CMF line crosses above the 0.0 line, if the market is in an uptrend, or enter a Sell as soon as the CMF line crosses below the 0.0 line if the market is in a downtrend.
Entering this way, though, you can still run into false signals, even if some have been filtered out.
Way 2: add the +/-0.05 lines, or it could be +/-0.1. Enter a Buy as soon as the CMF line crosses above the +0.05 line in an uptrend, and enter a Sell when the CMF line crosses below the -0.05 line in a downtrend.
Adding these lines helps cut out more of the noisy signals than the 0.0 line alone. We call adding these lines “widening the center zone”, meaning that instead of the center zone being nothing but the 0.0 line, it is now widened into a zone bounded by the 0.05 and -0.05 lines.
Step 3: place the stop loss and the take profit
- Put the stop loss below the nearest low (a Buy) or above the nearest high (a Sell)
- Take profit when the CMF line crosses above the 0.0/0.05 line (a Sell) or when the CMF line crosses below the 0.0/-0.05 line (a Buy)
Example: AUD/USD on the H1 timeframe
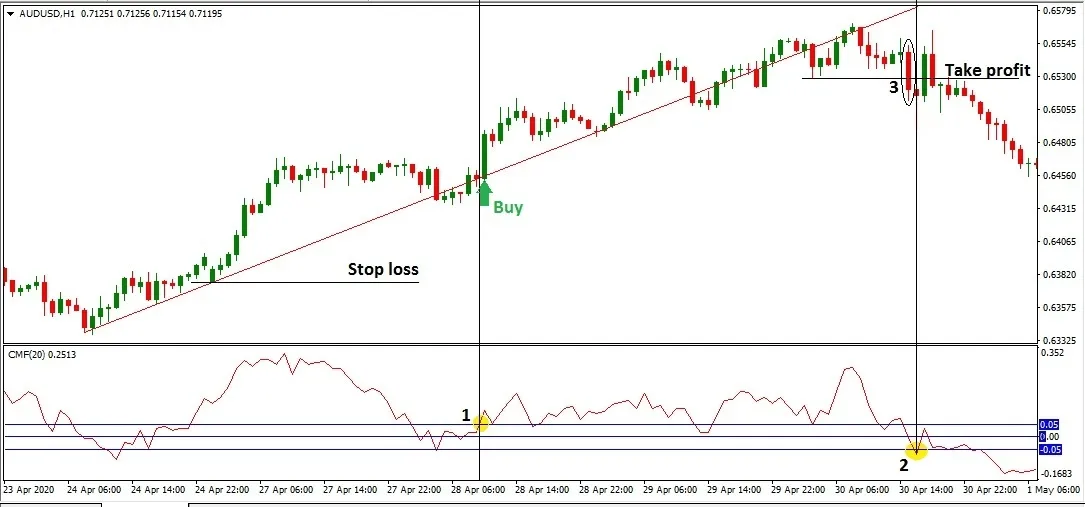
When price makes a higher high than the high before it and a higher low than the low before it, that shows the market is in an uptrend, and your job now is to wait for the CMF line to cross above the 0 or 0.05 line to enter a Buy.
At position 1, as the CMF line crosses above the 0.05 line, enter a Buy. Put the stop loss at the nearest low before it.
At position 2, as the CMF line crosses below the -0.05 line, you can close the trade right there. In this case you can also close the trade on price breaking the trendline of the uptrend. At position 3, price has broken the rising trendline and gone below the nearest low before it, which is the signal that price is turning down; you can close the trade as soon as price breaks the support of the nearest low before it (as the circled bearish candle closes, as in the picture). The close signal at position 3 comes earlier than the one at position 2, but the difference is not large.
Keep in mind: when trading the crossing signal between the CMF line and the 0.0 line, the +/- 0.05 lines or the +/- 0.1 lines, you should watch for this condition: if the “cross is long enough”, buying and selling pressure is that much clearer and stronger. That means that if CMF crosses above the +0.05 line, CMF should at least have started from below the -0.05 line, then risen and crossed above the +0.05 line. Or if CMF crosses below the 0.0 line, CMF should have started from a point far enough above the 0.0 line, then fallen and crossed below the 0 line.
A strategy on the widened crossing signal
Applying the “long enough cross” and “widened center zone” conditions above, we can trade the crossing signal between the CMF line and wider lines such as +/- 0.1 or +/- 0.15, or it could be +/-0.2, depending on how volatile the market is when you pick these lines. The wider the center zone, the fewer the noisy signals, but the “rarer” the crossings of those lines become as well.
This strategy is often used even when there is no clear trend in place, because CMF running straight up from below, or straight down from above, shows buying or selling pressure has suddenly become strong, which may be the start of a new trend. This is still a signal that can be wrong, though (all the more so when volume in forex is only tick volume), so place a stop loss and give priority to signals that run with the trend on the higher timeframe.
Say you use the crossing signal between the CMF line and the +/-0.1 lines. The way to enter is as follows:
Enter a Buy when the CMF line crosses above the 0.1 line, coming up from below the -0.1 line. Enter a Sell when the CMF line crosses below the -0.1 line, coming down from above the 0.1 line.
Example 1: AUD/USD on the H1 timeframe
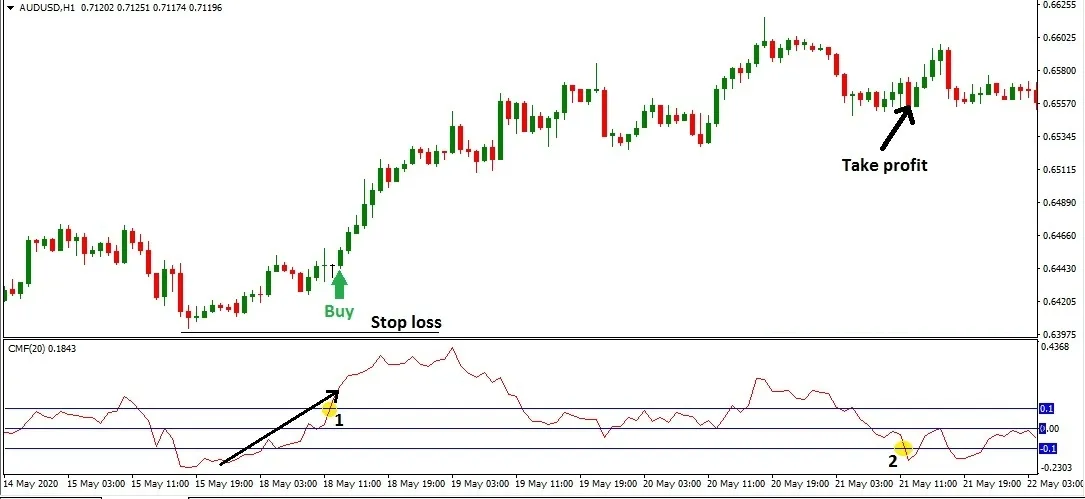
At position 1, the CMF line rises sharply from below the -0.1 line and crosses above the 0.1 line. You can enter as soon as the CMF line goes above the 0.1 line.
Put the stop loss a little below the nearest low before it. Close the trade to take profit when the CMF line turns down sharply from above the 0.1 line and crosses below the -0.1 line, at position 2 in the picture.
Example 2: USD/JPY on the H1 timeframe
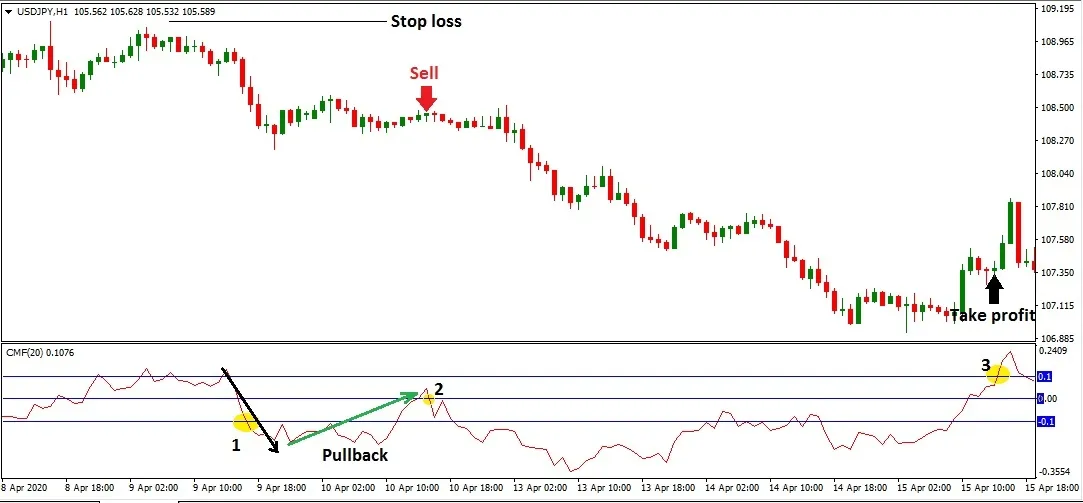
At position 1, the CMF line falls sharply from above the 0.1 line to below the -0.1 line, giving a sell signal. You can enter a Sell right after CMF crosses below the -0.1 line, in the same way as in example 1. Many traders, though, do not enter straight away but wait for a pullback (price moving back up) to get a better selling price and a closer stop loss.
One common explanation is that after a hard sell-off price usually retraces part of the move before falling further, because some people take profit on their Sell trades and some others buy the bottom.
Once the pullback is over and the line breaks back down through 0.0 (position 2), you can enter a Sell. Put the stop loss a little above the nearest high. Close the trade to take profit when CMF turns, rises sharply from below the -0.1 line and crosses above the 0.1 line.
Keep in mind: where CMF pulls back up above the 0.0 line, price still rises but must not go above the high before it; the other way round, if CMF pulls back down below the 0.0 line, price still falls but must not go below the low before it. If that condition is not met, it is not a pullback.
So what about the case where CMF does not pull back to the 0.0 line? And what if CMF pulls back to the 0.0 line several times?
Going back to example 1, a trader who waited for a pullback would have missed a good entry. In fact CMF did pull back to the 0.0 line, but only after quite a long time; after that long pullback, a trader entering would still make a profit, but not a large one, and with a poor risk-reward ratio, so the trade is not worthwhile.
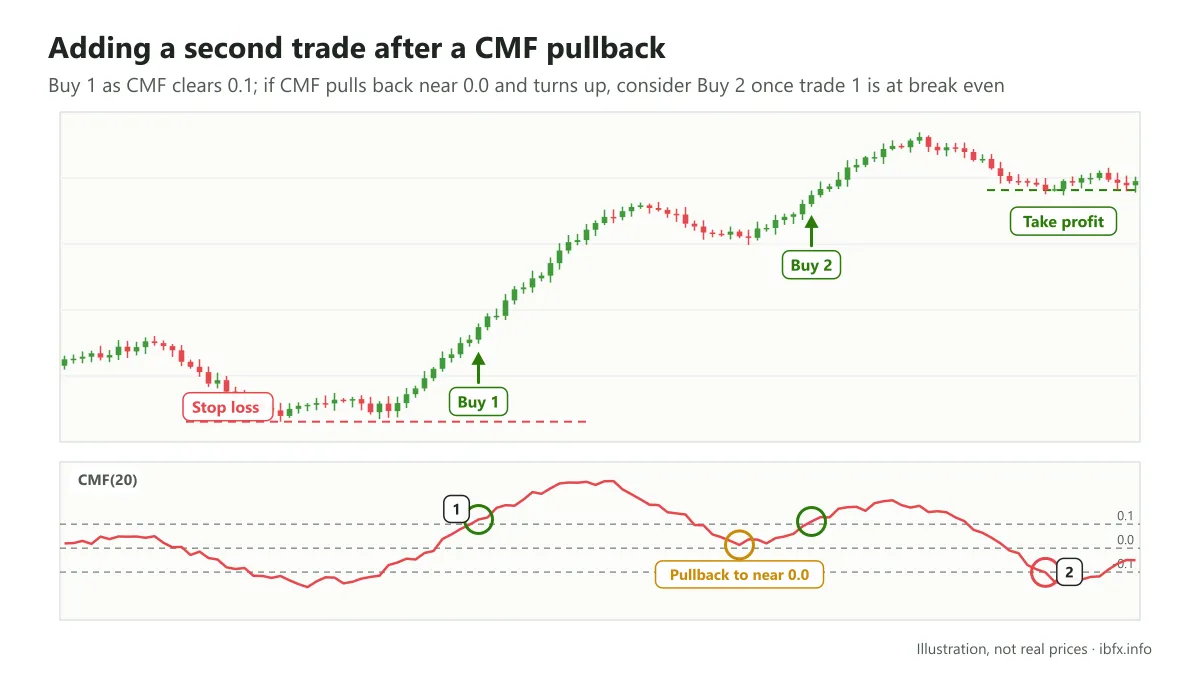
Where there are several pullbacks, an experienced trader can add another trade after each one, but only once the earlier trade has its stop loss moved to break even and the total risk across the trades is still within the limit you allow yourself.
Trading divergence and convergence between the CMF line and price
This is a strategy that will be very familiar from the oscillator family, and it is applied to the Chaikin Money Flow indicator too. See also: What is divergence?
Convergence (bullish divergence): when price makes a lower low but CMF makes a higher low, showing the push behind the fall in price is weakening and the market may turn up → a signal to consider a Buy.
Divergence (bearish divergence): when price makes a higher high but CMF makes a lower high, showing the push behind the rise is weakening and the market may turn down → a signal to consider a Sell.
Example: the H1 timeframe
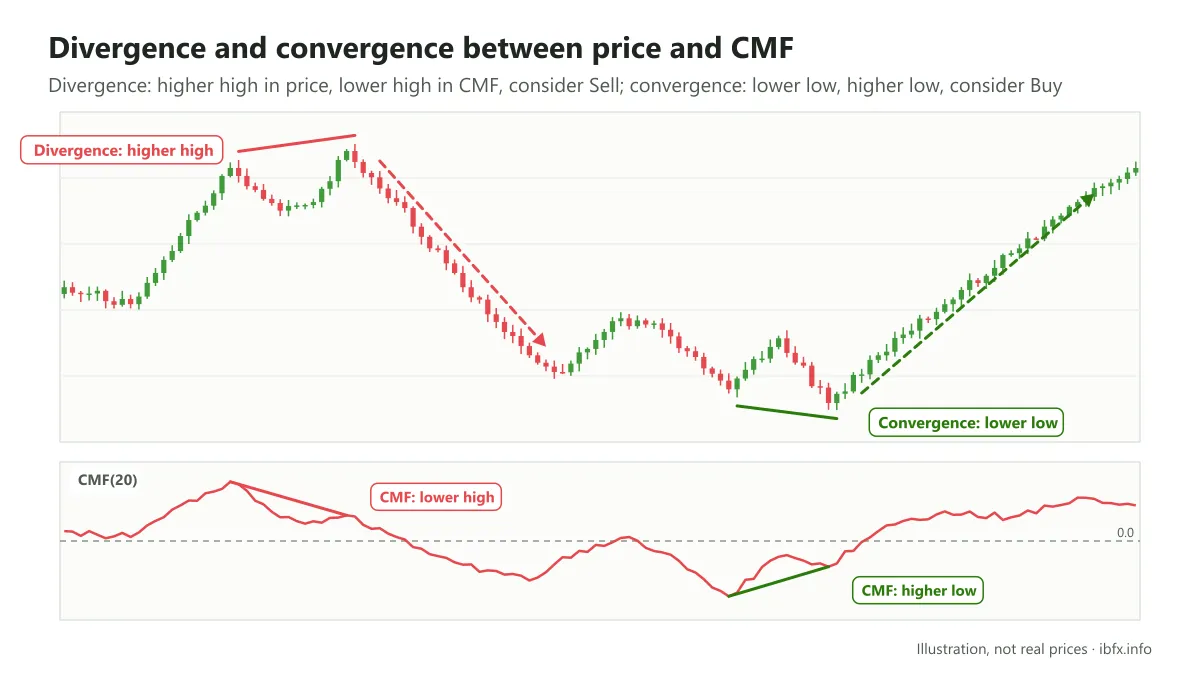
Just like the other signals, divergence and convergence between price and CMF also produce false signals quite often, particularly when the market is in a strong uptrend or downtrend.
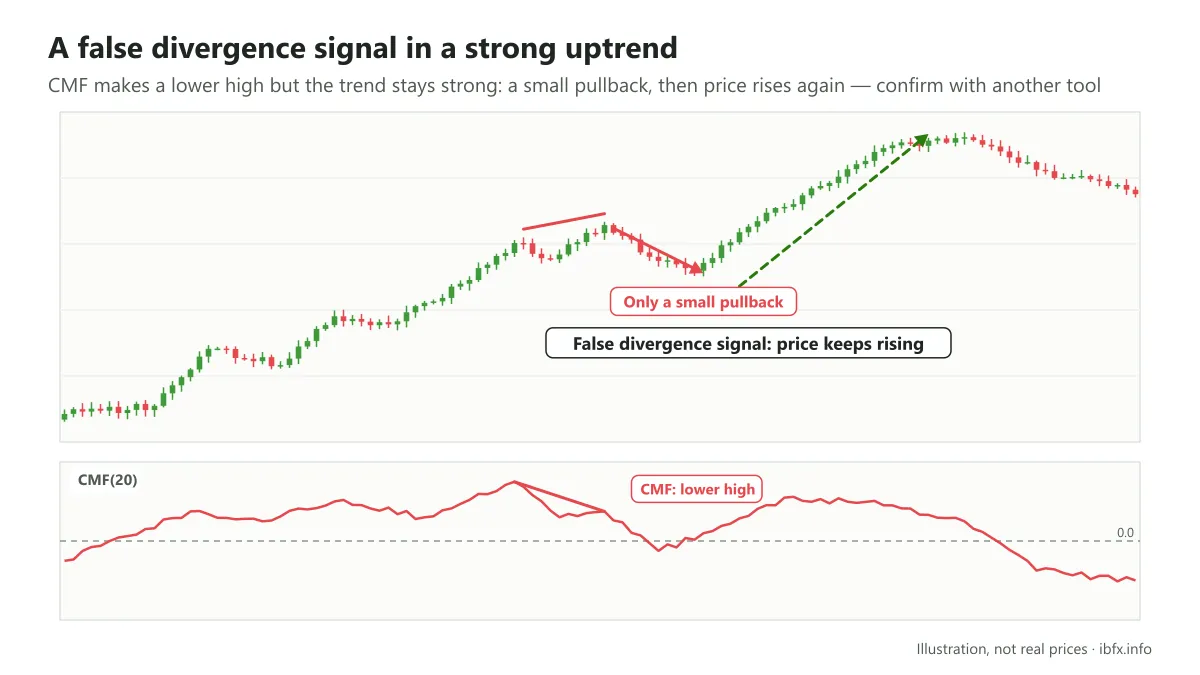
In the picture above, although price does fall after the divergence between price and CMF appears, it is only a very small pullback inside a very strong uptrend.
Trading divergence and convergence is a kind of reversal trading, so it is a great deal harder to get into than trading with the trend. On top of that, Chaikin Money Flow is no “holy grail” either, so there is no question of the signals this indicator produces always being right. That is why, when you use CMF, you have to bring in other technical analysis tools such as indicators, candlestick patterns, chart patterns and news trading.
Chaikin Money Flow is a volume indicator plenty of traders use. It is no “holy grail”, but if you practice using this indicator regularly, build up experience and work out your own way of reading it, then not only Chaikin Money Flow but any tool or trading method can become something useful in your trading.