If you are a devotee of Bollinger Bands, this article will help you put the ways of using this indicator in order.
This article will help you trade more simply with Bollinger Bands.
How the Bollinger Bands indicator is built
Bollinger Bands is a very widely used tool these days, and it combines a Moving Average with the standard deviation. Bollinger Bands was developed by John Bollinger in 1983 to measure how much price in the market moves.
To make the signals more reliable in trading, Bollinger Bands should be combined with another indicator, such as the Stochastic oscillator, the RSI, or the momentum indicator MACD (moving average convergence divergence). The Bollinger Bands show how much the market is moving right now, which helps you recognize a stretch of accumulation, the point at which price starts to move hard, and the price zones that are relatively high or relatively low compared with the recent past. As for what it is built from, Bollinger Bands is a tool that combines a Moving Average with the standard deviation to form 2 bands, an upper one and a lower one.
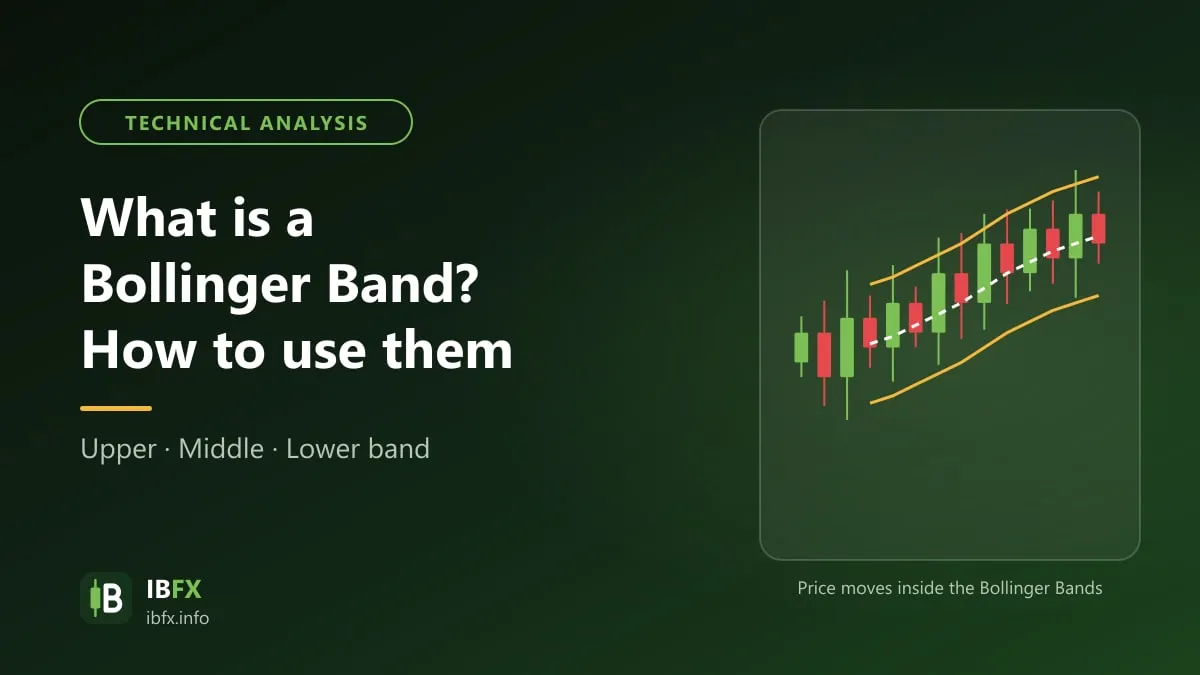
The pieces that make up the Bollinger Bands indicator: the middle line (Moving Average) uses 20 periods by default, SMA (20). The Upper Band sits above the SMA (20) by a distance equal to 2 times the standard deviation of price over the 20 periods. The Lower Band sits below the SMA (20) by a distance equal to 2 times the standard deviation.
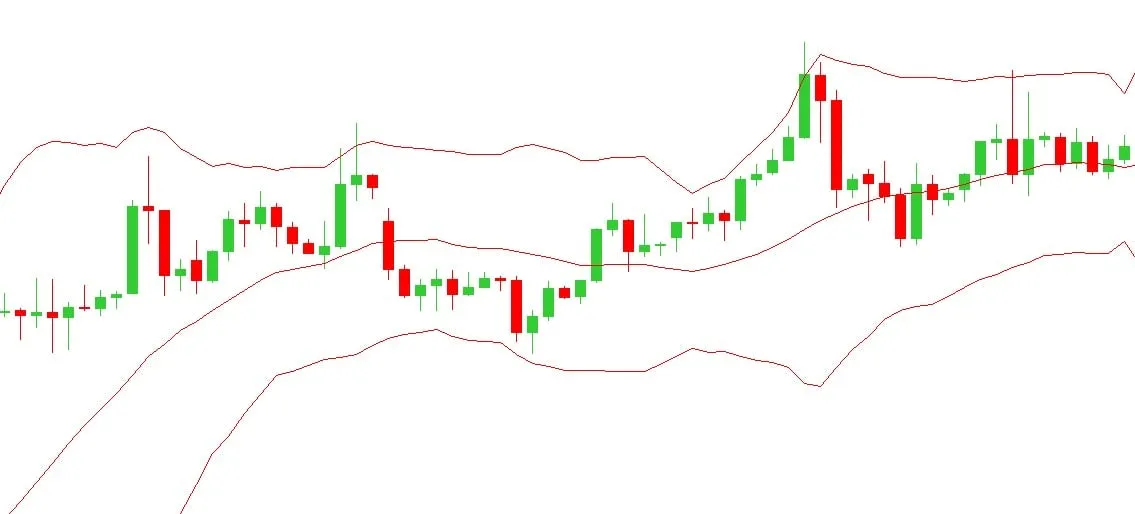
The Bollinger Bands indicator in real life, once it has been set up.
How to use Bollinger Bands
There are many ways of using Bollinger Bands; a common one is to look for a trade when price touches the bands, but price touching a band is not by itself a signal to enter.
To cut down the losses, we should wait until price moves outside the Bollinger Bands and then closes back inside them, and only then look at buying (at the lower band) or selling (at the upper band).
There are 3 ways of applying Bollinger Bands to trading that are the simplest and the most common:
- Trading while price is inside the Bollinger Bands.
- Trading while price is at the support and resistance levels of the trend.
- Trading when the Bollinger Bands form a bottleneck.
There are a great many different trading strategies that use Bollinger Bands, but which one you pick still depends on the trading style of each trader.
Trading while price is inside the two Bollinger Bands
This way is fairly simple, perhaps the simplest of all: traders usually buy when the price line touches or moves outside the lower Bollinger Band, and sell when the price line touches or moves outside the upper band.
It rests on the principle that price mostly swings in the space between the upper band and the lower band of the Bollinger Bands, turning around the SMA(20) line. This way mainly suits a sideways market; in a strong trend, price can walk along one band for a very long time and a trade against the trend will lose.
- Buy signals: We Buy when price touches the lower band (Lower Band) of the indicator.
- Sell signals: We Sell when price touches the upper band (Upper Band) of the indicator.
Here is an example:
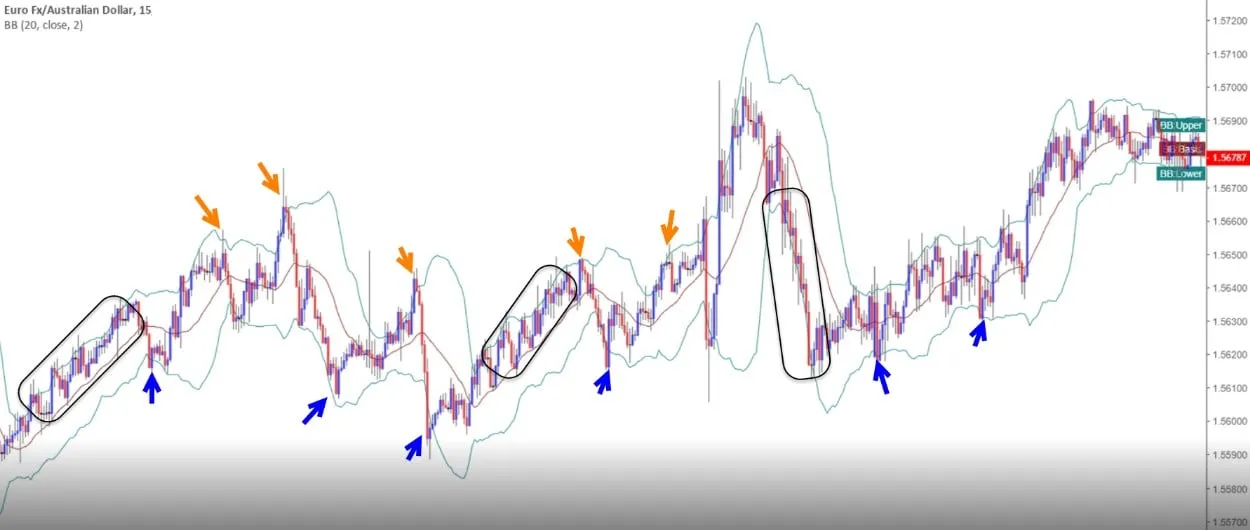
The blue and orange arrows mark the buy and sell signals, which are fairly simple.
You also have to accept the risk when you enter a buy or a sell as soon as price merely touches the upper or the lower Bollinger Band, because in practice you may have to carry quite a wide Stop Loss when it goes against the direction we predicted.
Usually we should wait until the price line moves outside the upper or the lower Bollinger Band and price then closes back inside the Bollinger Bands: that is a good moment to enter, because it is a way of holding the loss down when price keeps running hard outside the band, and always place the stop loss outside the band.
Trading Bollinger Bands together with the trend
This method is simple, but it asks more of you: you have to be able to identify where support and resistance are, and on top of that you have to know how to work with the trend.
You then combine that with the Bollinger Bands so the trading signals are more accurate.
- Buy signals: enter a Buy when price is at the lower Bollinger Band and also near an up trend line.
- Sell signals: enter a Sell when price is at the upper Bollinger Band and also near a down trend line.
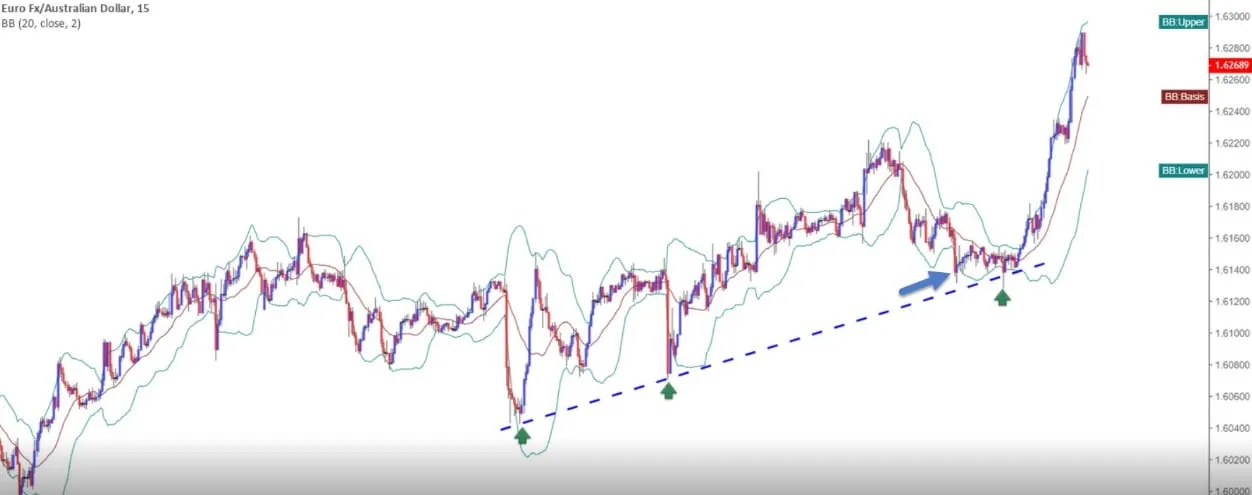
Trading Bollinger Bands together with the trend. The picture above illustrates the Buy case; the Sell case is its mirror image, with price at the upper band and a falling trendline.
Once you have identified the trend, then when the uptrend is strong, price rises hard while it stays in the upper half of the Bollinger Bands (the space between the upper band and the SMA20 line), and the other way round, when the downtrend is strong, price falls hard while it stays in the lower half of the Bollinger Bands (the space between the SMA20 line and the lower Bollinger Band); that is the moment when we look for a good chance to trade.
After price has moved fast all of a sudden, it tends to pull back toward the trend line, and when price settles down and moves less, the BB bands narrow.
When the Upper Band and the Lower Band squeeze in, that is a warning sign that a hard price move is coming in the near future, and if we combine it with the trend line at that moment the odds will be better.
Trading when the Bollinger Bands squeeze in
One common thing this indicator does is form a bottleneck.
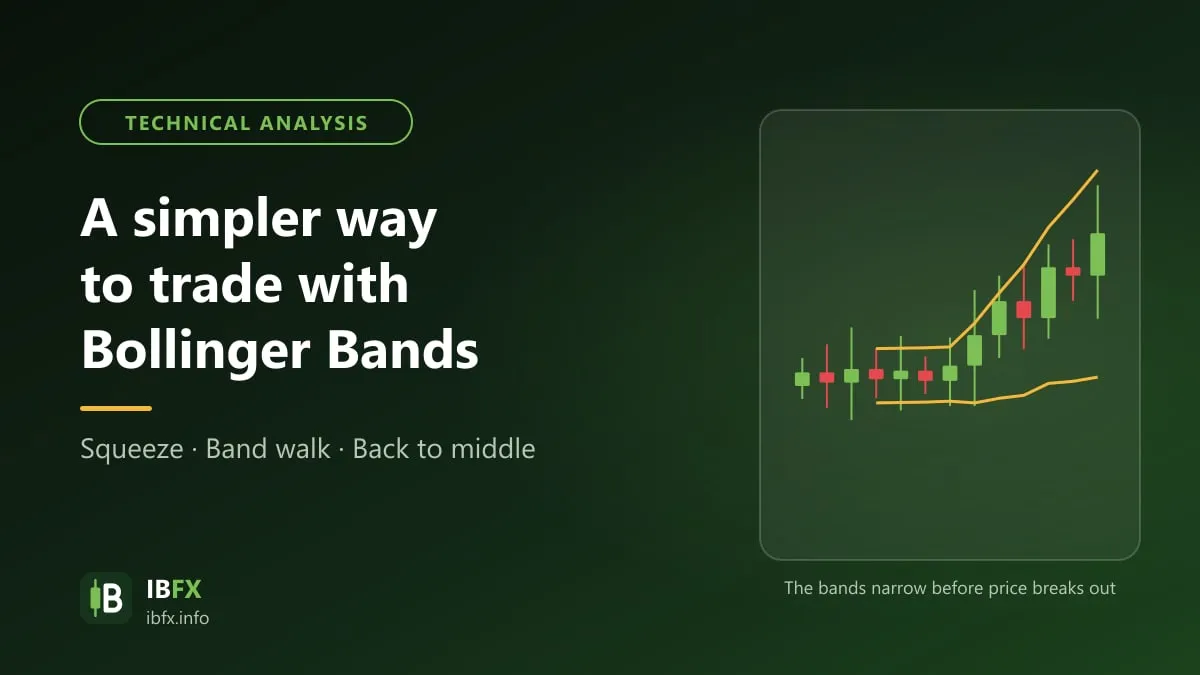
When the upper band and the lower band draw in toward each other into the shape of the neck of a bottle, that is a warning sign that a hard price move is coming in the near future; this bottleneck stretch is also called a sideways stretch.
When the bands widen again, price usually runs in the direction of the break through the upper or the lower band, which may be the start of a new trend. During the sideways stretch, on the other hand, price that touches the upper band usually turns back down, and the other way round.
- Some traders sell when price closes at the upper band and buy when price closes at the lower band during the bottleneck stretch.
- One important note: this way carries a high risk, because the bottleneck is usually the stretch right before price breaks out hard, and the bands are very narrow at that point so the potential profit is small. Many traders choose instead to wait for price to break clearly out of the bottleneck and then trade in the direction of the break, while staying careful about a false break (John Bollinger calls it a “head fake”).
The picture below is an example on the EURAUD currency pair.
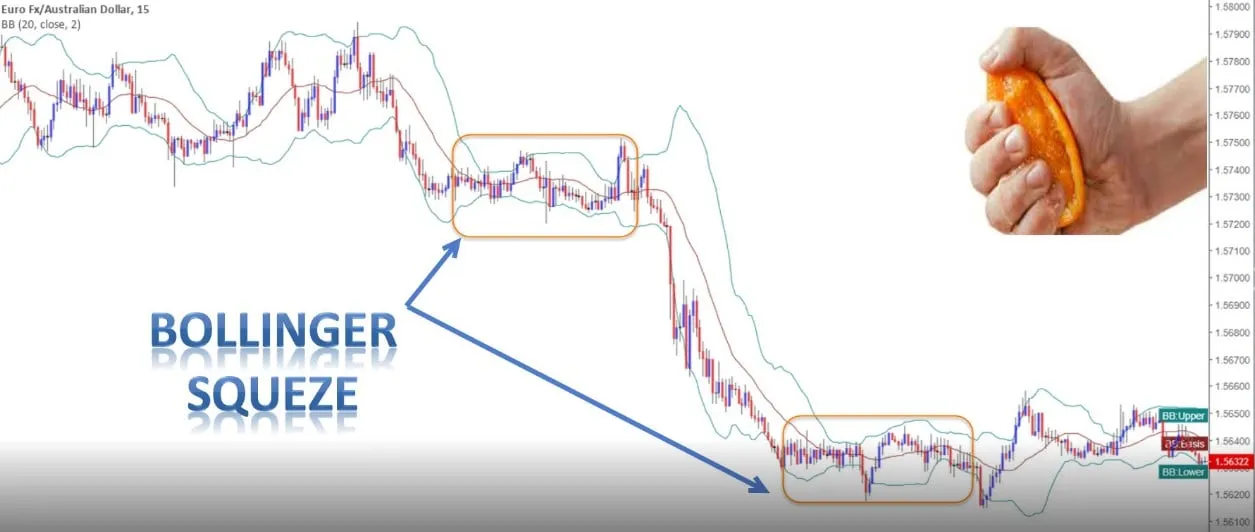
The bottleneck of the Bollinger Bands is fairly widely used for trading a sideways market.
Usually, after price has moved hard several times in a row, the BB bands widen, which is the stretch in which the market runs one way.
Straight after that the market pulls back and the price line tends to return to a state of consolidation and move less; at that point the pieces of the Bollinger Bands are far apart, so in the future the price line may well be drawn in again into the shape of a bottleneck.
Those are the ways of applying Bollinger Bands to make your trading plans better, but in practice, to work well with Bollinger Bands, do not forget to watch the news and the events on the economic calendar so you stay clear of the moments when the market moves hard and the Bollinger Bands signals stop being accurate. Practice on a demo account and always place a stop loss.