On this page
This article guides you through the Bollinger Bands indicator. It is a useful tool for measuring how much price moves, for recognizing the stretch in which the market is accumulating (the bands drawing in) and the stretch in which price starts to move hard. When the market moves sideways, trend-following indicators such as the MACD or the moving average usually give a lot of noisy signals, while Bollinger Bands combined with an oscillator such as the RSI or the Stochastic can be of help. If you are interested in the Bollinger Bands, read the article below to understand them properly and to know how to trade with Bollinger Bands.
What are Bollinger Bands?
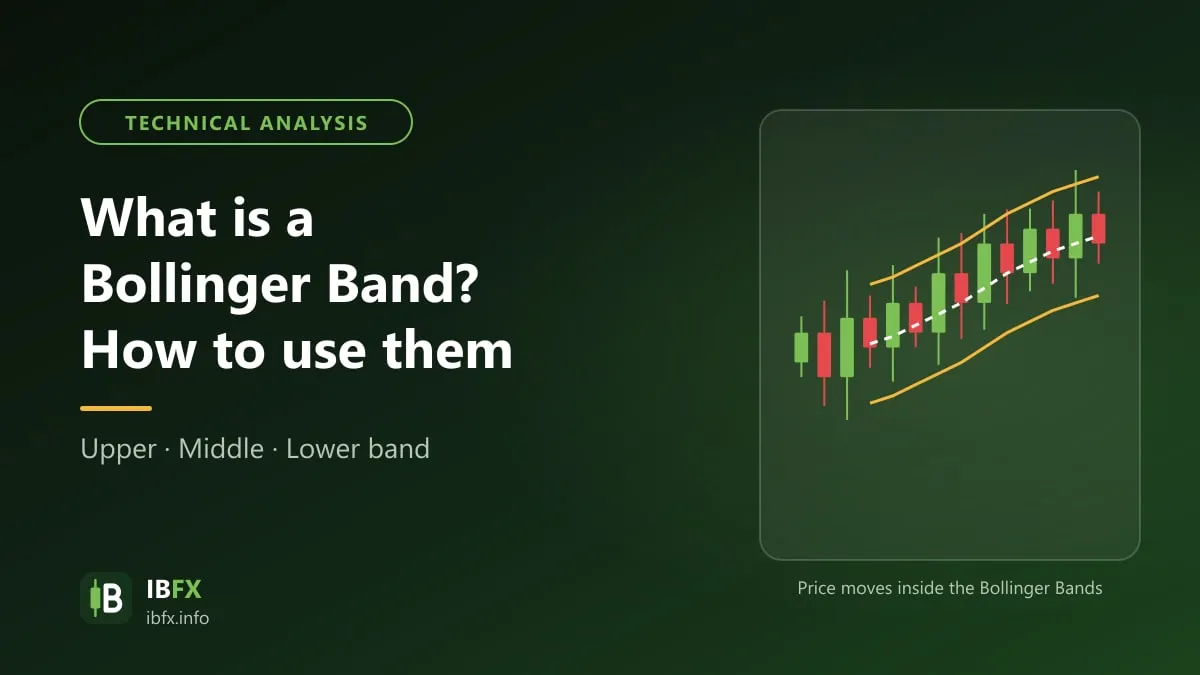
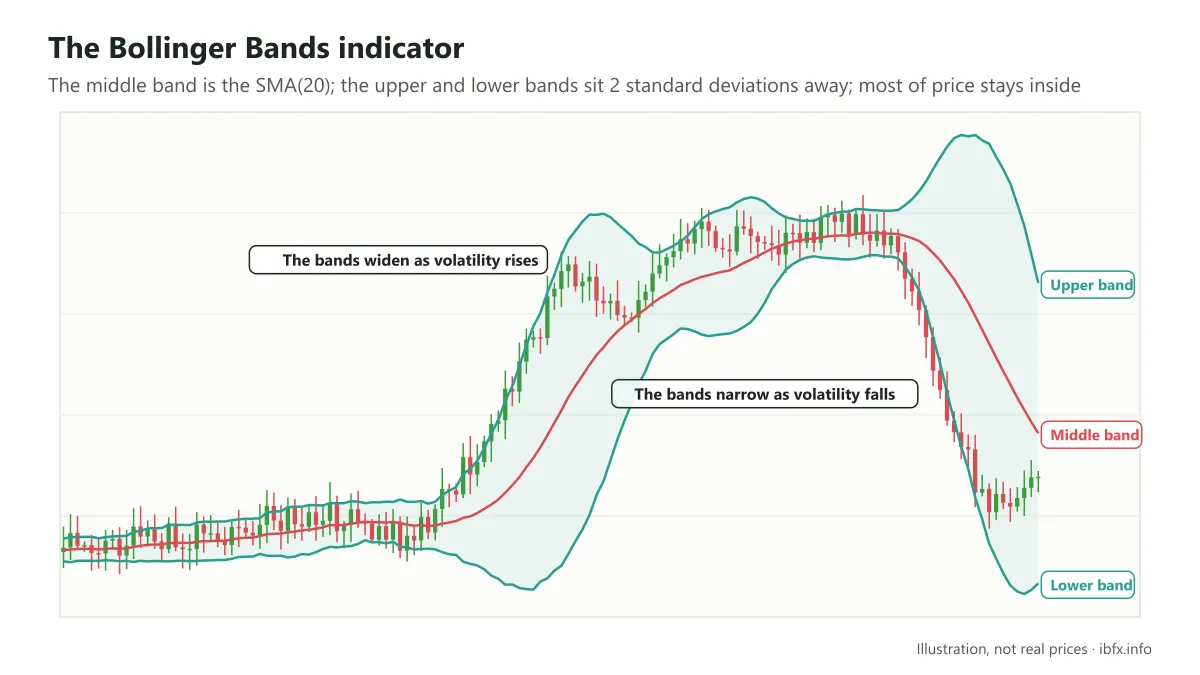
Developed by John Bollinger, Bollinger Bands® is an indicator built out of 3 bands, based on the formula for the simple moving average (SMA), from which it looks at how much price moves. That movement is based on the standard deviation, which changes as volatility rises and falls. The bands widen on their own when volatility rises and draw in when volatility falls.
How do Bollinger Bands work?
Where other envelope-style bands such as the Envelopes use a fixed percentage distance from the moving average, the Bollinger Bands use the standard deviation in the calculation.
The standard deviation is a tool widely used in statistics to find how far a sample sits from its own average.
So, to work out the standard deviation, you first need the variance.
The variance is worked out as:
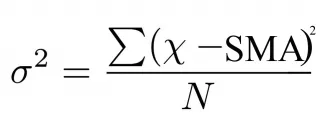
The sum of the squared differences between the data and the moving average, with that total divided by N.
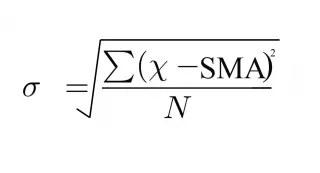
The square root of the variance is the standard deviation.
To get two or three standard deviations, you simply multiply that factor by the original standard deviation.
John Bollinger placed the upper band and the lower band two standard deviations away from the middle line so that they adjust better to how much the market moves. Because of that, the Bollinger Bands shift in step with the standard deviation of the moving average, react faster to changes in the market and are better able to “contain” the whole of price.
As a result, most of the price movement sits inside the Bollinger Bands, although price can still move outside them, especially when there is a strong trend. Because the middle band is held between the upper band and the lower band, it looks rather like a wall around price.
Since they take in nearly the whole range of price movement, the Bollinger Bands are often used to judge whether price is relatively high or relatively low compared with the recent past:
- When price is at or above the upper band, price is relatively high.
- When price is at or below the lower band, price is relatively low.
Note: according to John Bollinger himself, price touching a band is not a signal to buy or sell. In a strong trend, price can “walk along” the upper band or the lower band for a very long time.
When the Bollinger Bands draw in or widen, they say the following:
- A change in price tends to come after the range has tightened and volatility has eased off.
- When price moves outside the bands and then works its way back inside them, it shows the trend may be about to turn.
The formula for Bollinger Bands
Because the Bollinger Bands are built out of 3 bands, the formula goes like this:
- Upper band = SMA (20) + (the 20-session standard deviation of price x 2)
- Middle band = SMA (20)
- Lower band = SMA (20) – (the 20-session standard deviation of price x 2)
Looking at the formula, you can see that the default values (a period of 20, a factor of 2) are the ones Mr Bollinger himself suggested.
The period of 20 is used to describe the short to medium-term trend: on the D1 time frame, 20 sessions is about 1 month of trading. On the kinds of period a moving average can use, you can read more here:
How to set Bollinger Bands up
Setting this indicator up is extremely simple:
All you have to do is go into the MT4 software
Choose Insert -> choose Trend -> choose Bollinger Bands
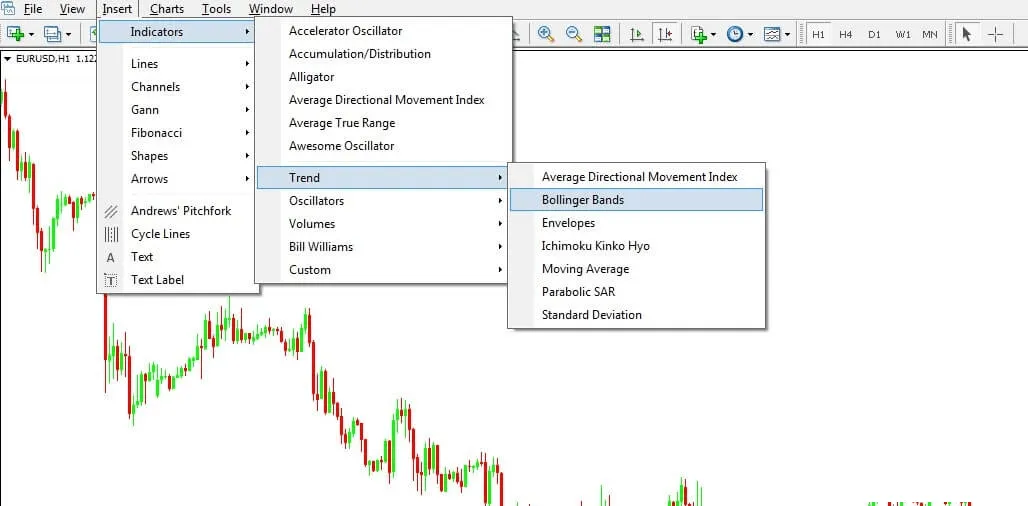
A window then appears containing:
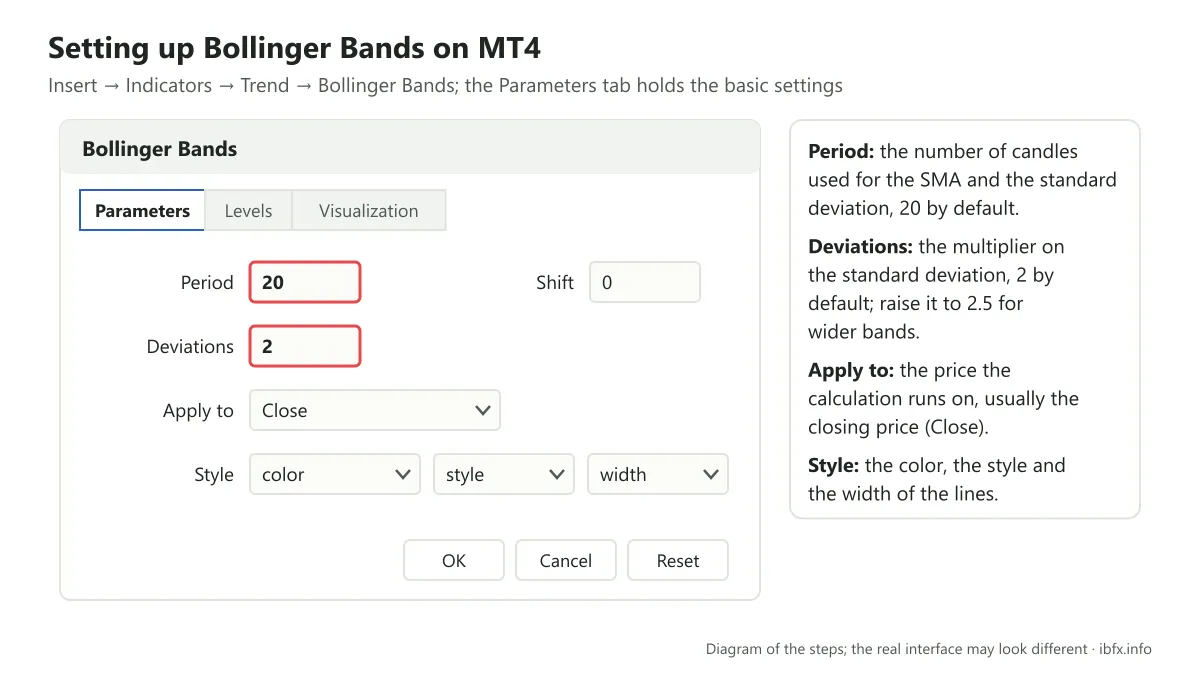
+ The Parameters section: where you set the basic values, as in the example below, which shows the defaults.
++: Period 20: a period of 20 candles in a row.
++ Deviations: the multiplier on the standard deviation, 2 by default (you can raise it to 2.5 for wider bands).
++ Apply to: applied to the closing price of the candle.
++ Style: pick the color and the width of the indicator lines in turn.
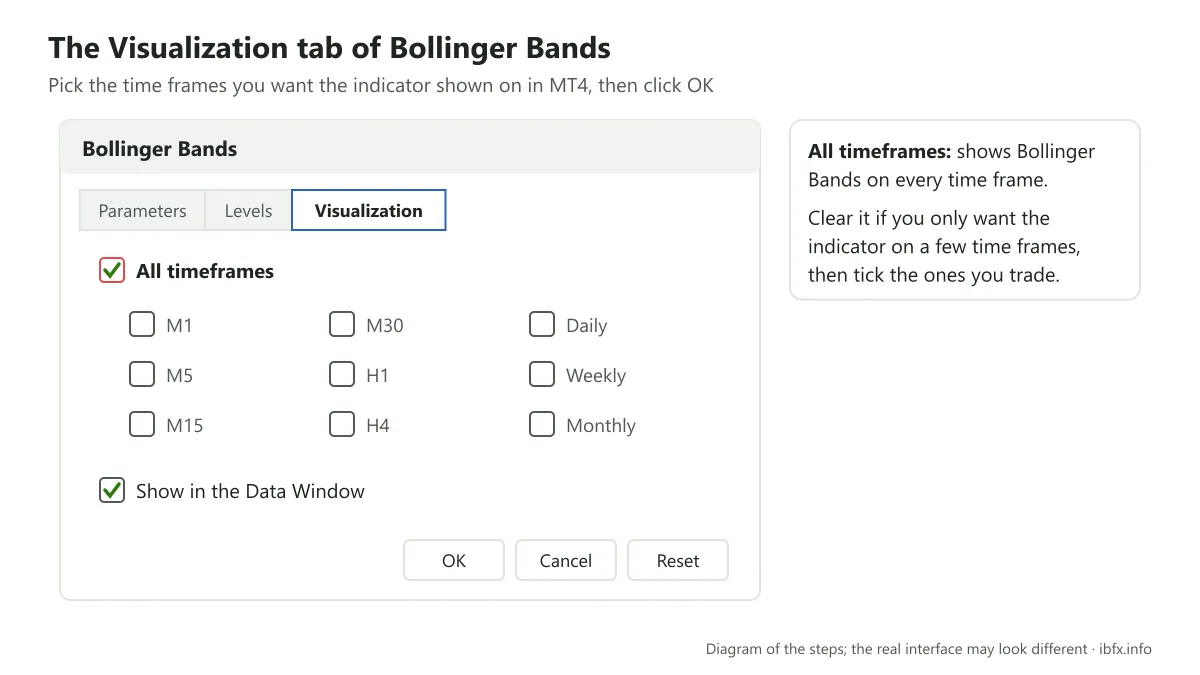
+ The Visualization section: this one is fairly simple, it lets a trader pick the time frames we trade so that the indicator shows on the MT4 screen.
How to trade with Bollinger Bands
The most common method many traders apply is trading the Bollinger Bands as a bottleneck. Besides that, John Bollinger, who was once a market analyst on American financial television, advises combining Bollinger Bands with other indicators such as the RSI rather than using them on their own. Now we will set out the ways of trading with Bollinger Bands in detail.
- Trading Bollinger Bands on the 2 bands
- Trading Bollinger Bands as a bottleneck
- Trading Bollinger Bands with other indicators
Trading Bollinger Bands when price touches the upper band and the lower band
This can be seen as the simplest way: because price swings around the 2 bands, the upper one and the lower one, the trading formula is simply this:
+Buy: We Buy when price touches the lower edge (Lower Band) of the indicator.
+ Sell: We Sell when price touches the upper edge (Upper Band) of the indicator.
In practice we always advise you not to enter a buy or a sell when price has merely touched the upper or the lower band of the Bollinger Bands, because doing so is very risky.
If the market is in a sideways state, though, with price flipping up and down, this method can be used, on condition that you put the stop loss outside the band and close the trade as soon as the market starts to trend.
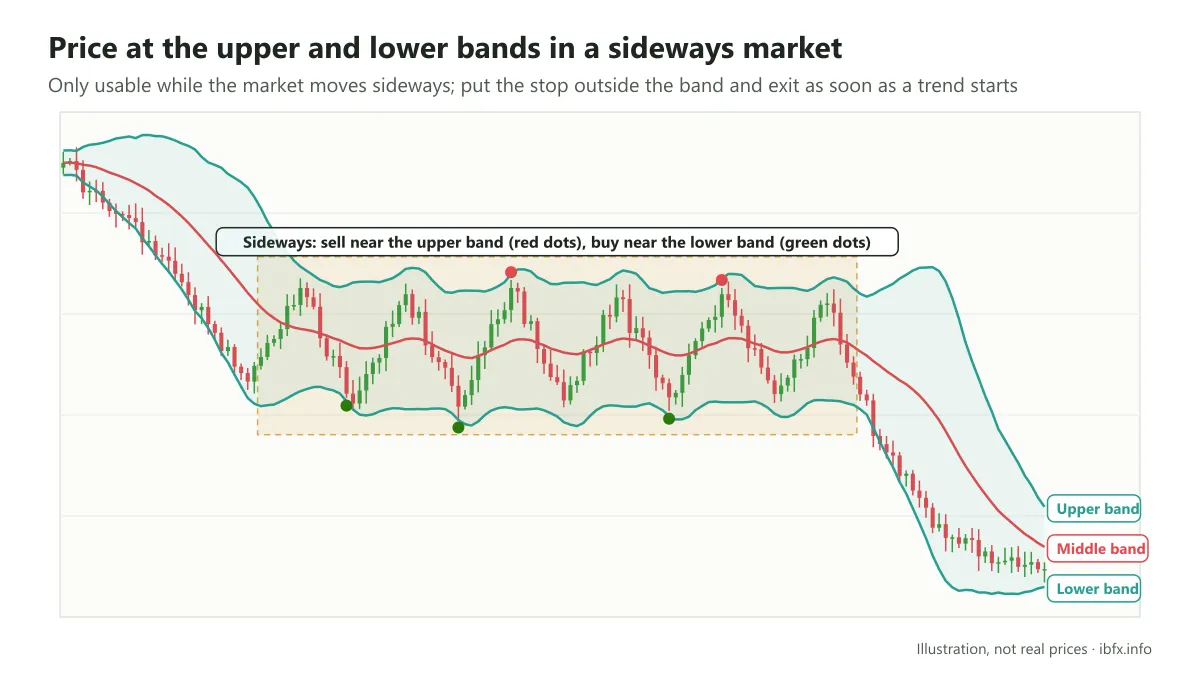
Looking at the picture above, in the part marked out in yellow, price goes up and down again and again without a break between the 2 bands. And this is also the moment when price has settled into a sideways state, so the way of buying when price touches the lower edge and selling when price touches the upper edge applies here.
Trading Bollinger Bands as a bottleneck
Given the way the Bollinger Bands are built, whose main purpose is to take in the whole course of the price action, the market is not always of one shade like that. It is always moving, and according to John Bollinger the stretches of low volatility usually come right after the stretches of high volatility.
Because of that, the bands drawing in or narrowing can give notice of a considerable rise or fall. Once the squeeze on price has begun, the next break out of the band signals that the market is about to set a new order.
- A new rise begins with a squeeze, and then a break of price at the upper band.
- A new fall begins with a squeeze and then a break of price at the lower band.
A bottleneck is a stretch where the two bands narrow markedly compared with the stretch before it and the stretch after it.
So when price breaks and then follows the lower band down, the fall that comes next is usually very hard.
You should also notice that the band in the middle is the SMA20, the simple moving average. Compared with the EMA, the SMA reacts more slowly but carries less noise, and it is still a good tool for watching the trend. Bollinger used the SMA because the standard deviation in the formula is also worked out around the simple average, which keeps the bands consistent in statistical terms.
If price stays below the SMA20 all through the bottleneck stretch, then when the bottleneck ends, a fall is the more likely direction. This is a useful hint: where price sits relative to the middle band can tell you which direction is more likely when the bands widen, though it is not right every time.
That is why, when you trade with Bollinger Bands, do not forget the SMA line in the middle; putting the direction of the middle line together with the bottleneck will help you judge the direction of the break on firmer ground, and be careful of the false breaks set out below.
NOTE: The Head Fake
In his book, Bollinger on Bollinger Bands, John Bollinger advises traders to be careful of the “head fake”. This happens when price breaks one edge of the range, then suddenly turns and moves the other way, much like a price trap.
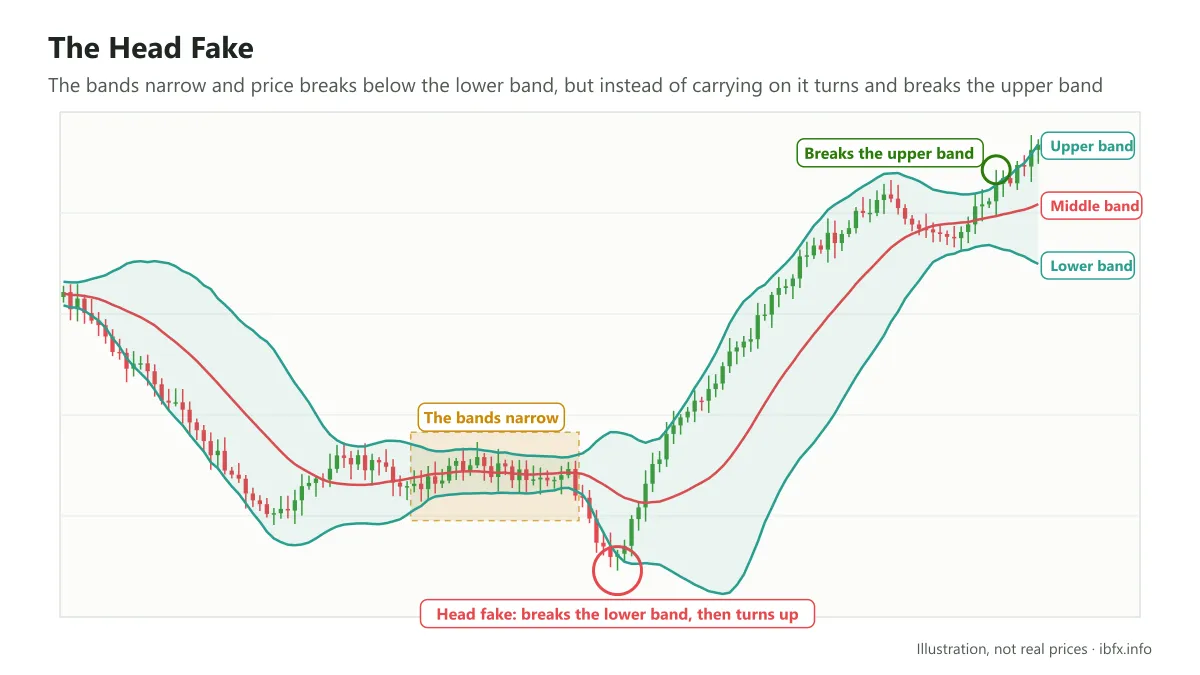
A bullish head fake happens when the Bollinger Bands draw in and price moves above the upper band. This bullish signal does not last, because price quickly moves back below the upper band and goes on to break the lower band. A bearish head fake starts when the Bollinger Bands draw in and price breaks below the lower band. This bearish signal does not last long, because price quickly moves back above the lower band and goes on to break the upper band.
Combining Bollinger Bands with another indicator
Bollinger Bands with the RSI
Combining them with an oscillator such as the RSI is a method many traders use; on the RSI you can read more here:
In the basic sense, the RSI belongs to the oscillator group, so it tells a trader about the oversold zones (below 30) and the overbought zones (above 70). The RSI is also used to find divergence, but that is a different signal from an overbought or oversold zone, even though the two often show up close together.
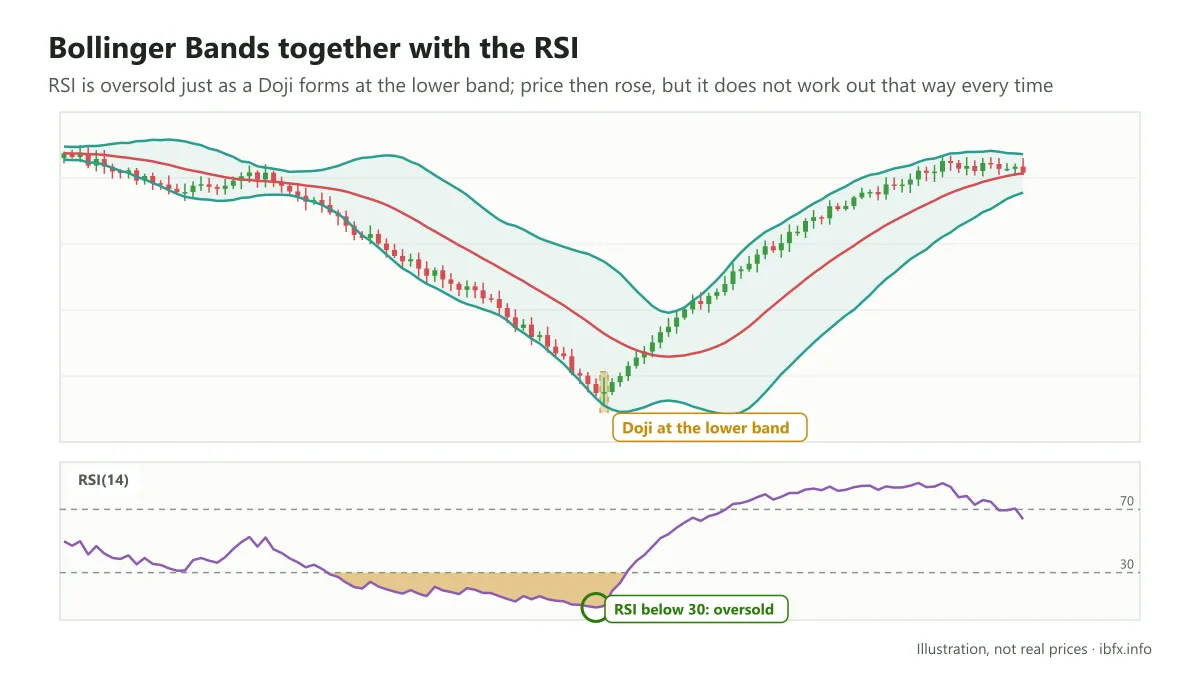
Looking at the picture above, you can see that the RSI has gone below 30, which means the market is in an oversold state. At the same time, on the daily price chart a Doji reversal candle has formed at the lower band.
The two things, oversold and the Doji, appeared together, and price then rose. Even so, this combination does not give that result every time.
Trading BB with the RSI on divergence or convergence
Divergence and convergence is something we have brought up a great many times; when divergence or convergence appears, it means the side that had the upper hand is no longer keen on pushing price higher (the buyers) or pushing price lower.
Divergence or convergence forming, however, only shows that one of the 2 sides is no longer keen, not that price will turn the moment you see divergence or convergence. That is why you have to take a number of other things into account as well, to hold down the risk when you trade forex.
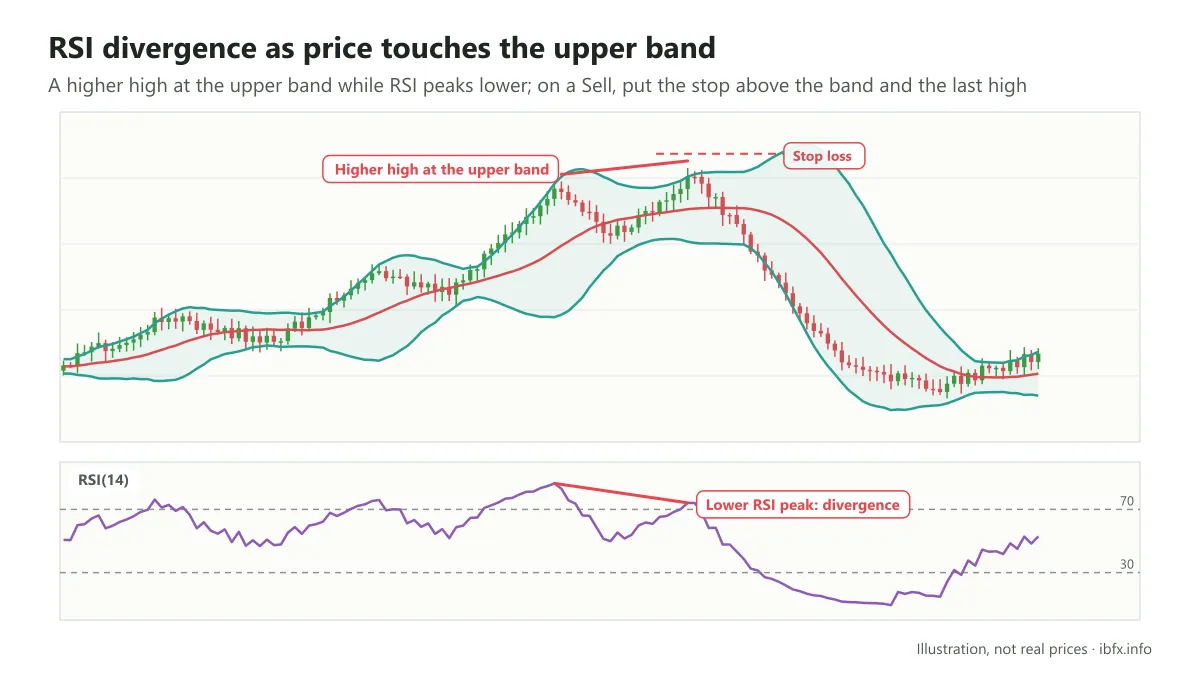
Looking at the picture above, you can see that the RSI has produced divergence, and at exactly that moment price has also touched the upper edge of the BB. Price then fell hard. If you enter a Sell on this signal, you can put the stop loss a little above the band and the nearest high.
Combining Bollinger Bands with reversal candlestick patterns
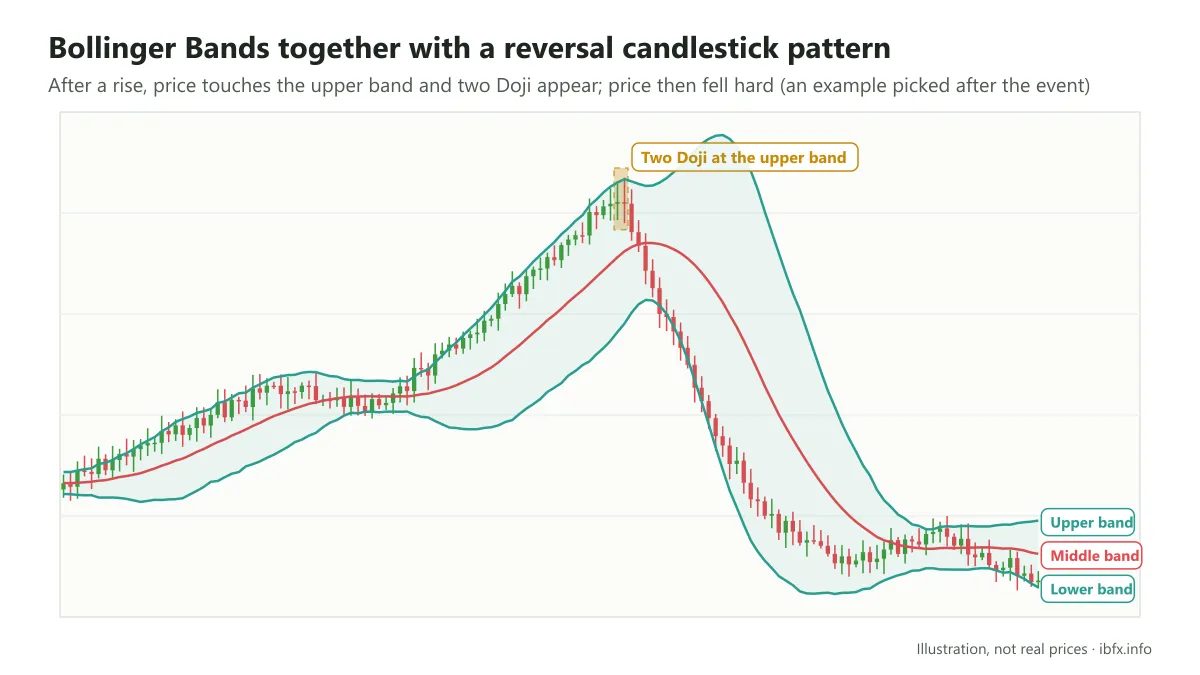
This is a method a great many traders are familiar with; as in the example below, after a run higher price not only touched the upper band but also formed 2 Doji candles, and price then fell hard.
Combining Bollinger Bands with the double top or double bottom pattern
For newer traders it is quite hard to pick out the double top and double bottom shapes, so one simple trick is to switch the Japanese candlestick chart to a line chart:
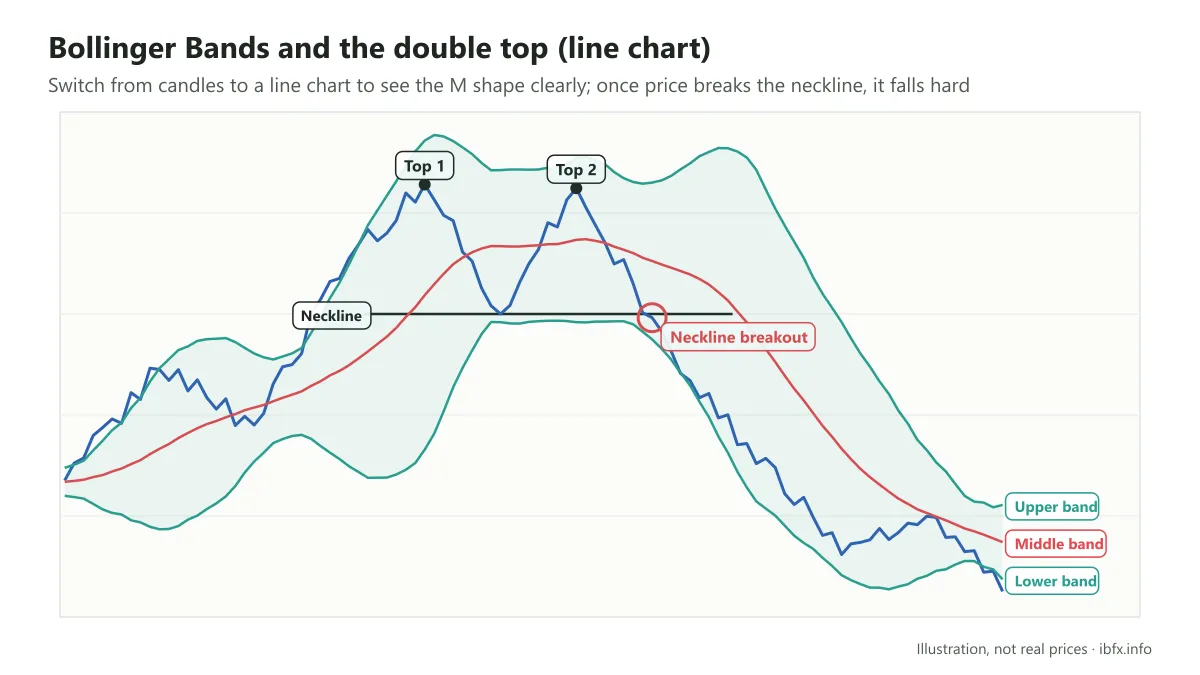
You will see the pattern show very clearly, no longer as hard to pick out as it is on the Japanese candlestick chart, will you not? After the double top formed and price broke through the Neckline, it fell very hard.
If the M shape stands for the double top pattern, then the W shape stands for the double bottom pattern:
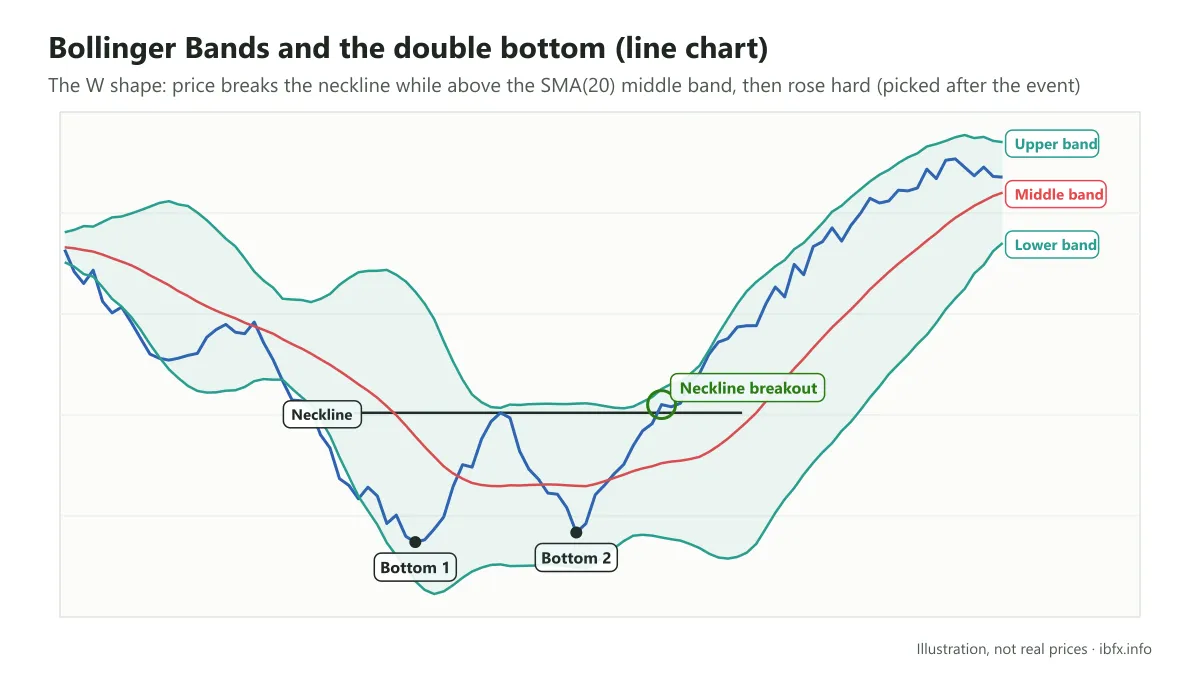
In the example above, besides the double bottom or W shape, price was also above the SMA 20 line, which is why after price broke out of the neckline it rose very hard.
So that is the basic knowledge and the ways of trading with Bollinger Bands. The examples were picked once the course of price was already known; practice on a demo account and always place a stop loss. Read more: Trading with Bollinger Bands made simpler.